Introduction
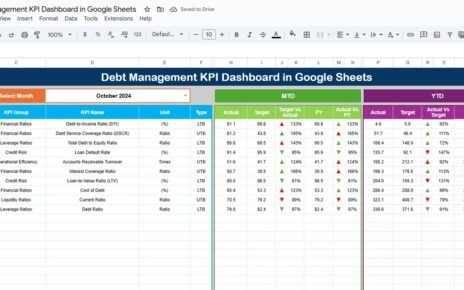
The Account Management KPI Dashboard in Google Sheets is a comprehensive and easy-to-use tool designed to help businesses track and analyze their key performance indicators effectively. Whether you’re managing customer accounts, sales targets, or growth metrics, this ready-to-use template simplifies monitoring performance metrics with interactive and dynamic features.Account Management KPI Dashboard in Google Sheets
Key Features of Account Management KPI Dashboard in Google Sheets
- Six well-structured worksheet tabs for data input, analysis, visualization, and definitions.
- Interactive month selection with dropdown, dynamically updating dashboard figures.
- MTD (Month-to-Date) and YTD (Year-to-Date) comparisons including Actual, Target, and Previous Year data.
- Conditional formatting with up/down arrows to visualize Target vs Actual and PY vs Actual performance quickly.
- Trend analysis charts for detailed KPI visualization over time.
- Clear definitions and types for KPIs, supporting better understanding and accuracy.Account Management KPI Dashboard in Google Sheets
Dashboard Pages Explanation
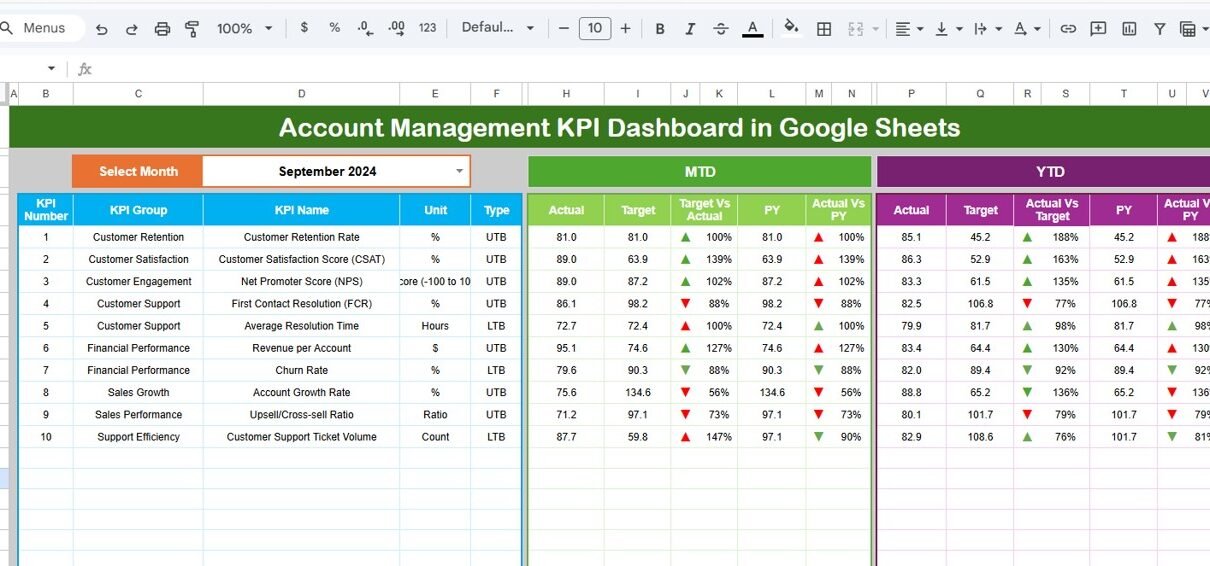
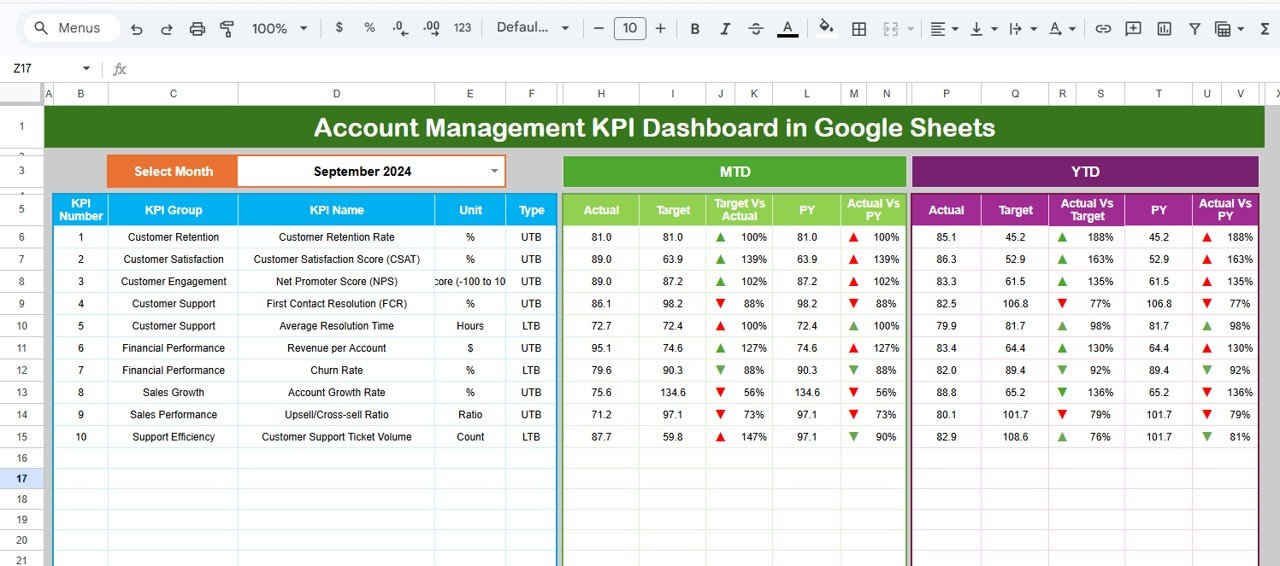
1. Dashboard Sheet Tab
This is the main interface showing all critical KPI information for the selected month.
- Use the drop-down on range
D3to select the month. - View MTD Actual, Target, Previous Year data along with visual performance indicators.
- View YTD Actual, Target, Previous Year data to get a broader picture of the year’s progress.Account Management KPI Dashboard in Google Sheets
Click to Buy Account Management KPI Dashboard in Google Sheets
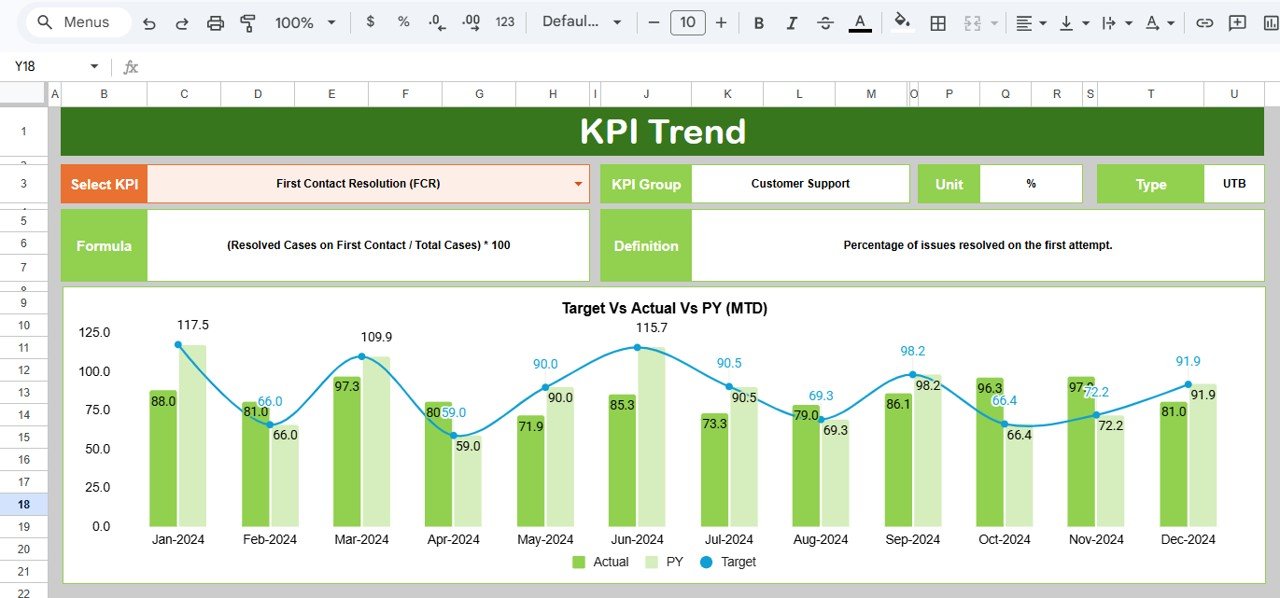
2. KPI Trend Sheet Tab
This sheet provides details and visual trends for individual KPIs.
- Select the KPI name via the drop-down on
C3. - Displays KPI Group, Unit, Type (Lower the Better or Upper the Better), Formula, and Definition.
- Includes trend charts showing MTD and YTD data for Actual, Target, and Previous Year metrics.
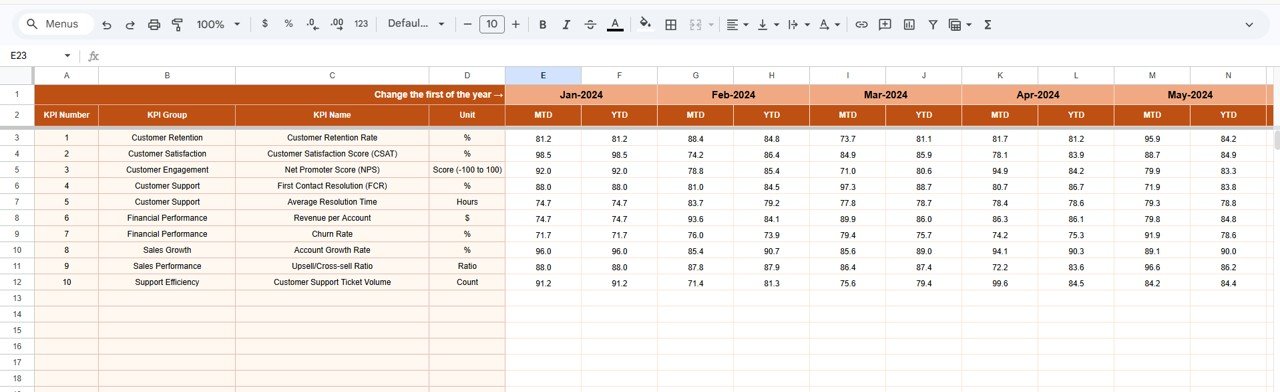
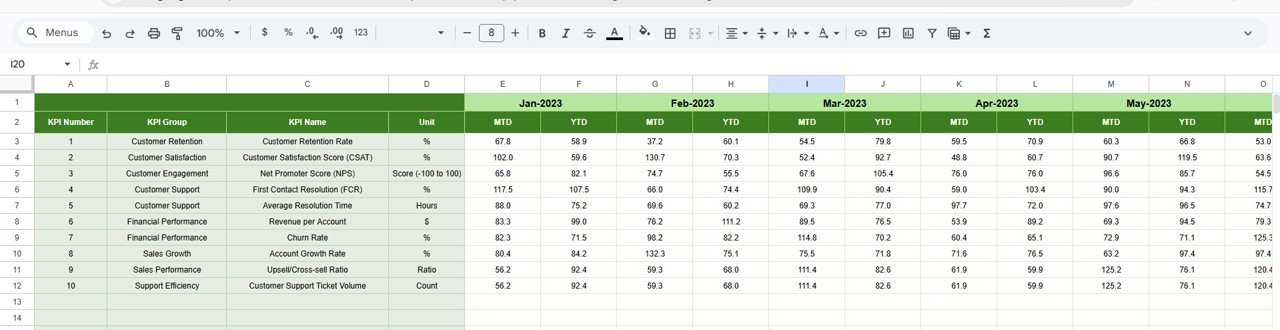
3. Actual Numbers Input Sheet
This sheet allows you to input the actual numbers recorded for the selected month and year.
- Change the starting month of the year via range
E1. - Enter MTD and YTD actual values corresponding to KPIs.
Click to Buy Account Management KPI Dashboard in Google Sheets
4. Target Number Input Sheet
This sheet is for entering monthly target numbers for KPIs both as MTD and YTD.
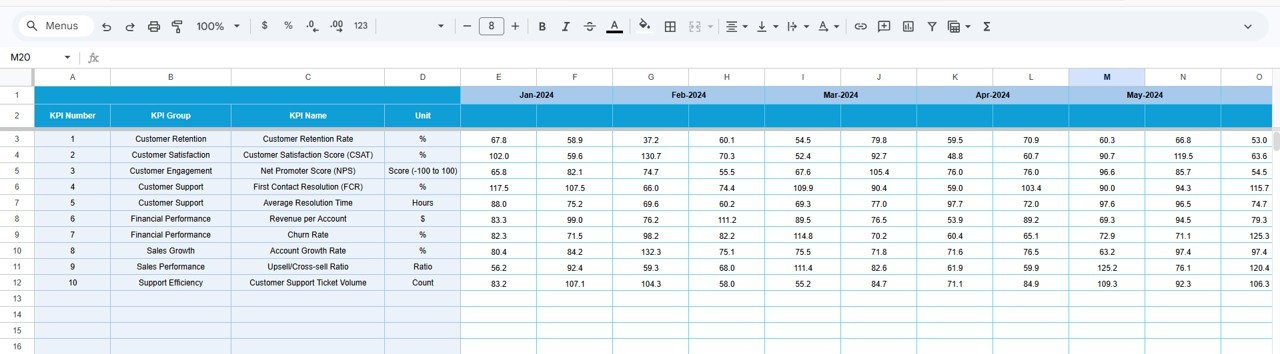
5. Previous Year Number Sheet Tab
Input the previous year’s KPI numbers here, mirroring the current year’s data format.
Click to Buy Account Management KPI Dashboard in Google Sheets
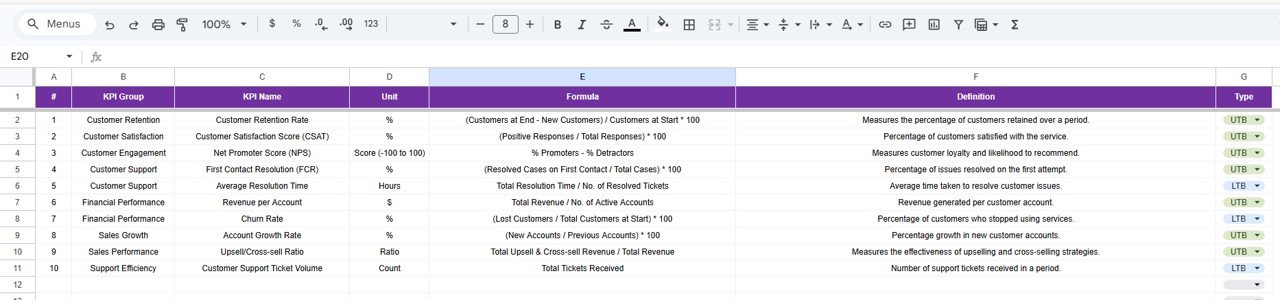
6. KPI Definition Sheet Tab
This sheet stores definitions and classifications for each KPI.
- KPI Name, KPI Group, Unit, Formula, and Definition.
- KPI Type set as LTB (Lower the Better) or UTB (Upper the Better).
Click to Buy Account Management KPI Dashboard in Google Sheets
Advantages of Account Management KPI Dashboard in Google Sheets
- User-Friendly Interface: Intuitive layout with dropdowns and conditional formatting reduces learning curve.
- Real-Time Data Updates: Dynamic month selection lets you analyze any period instantly.
- Comprehensive Analytics: Visualizes both MTD and YTD data while comparing with previous year’s metrics.
- Customization: Easily adaptable KPI definitions allow you to tailor the dashboard to your organization’s needs.
- Cost-Effective: Built fully in Google Sheets, eliminating the need for costly software.
Opportunities for Improvement
Click to Buy Account Management KPI Dashboard in Google Sheets
- Integrate automatic data imports via Google Sheets API to reduce manual data entry.
- Add predictive analytics or forecast models using Google Sheets add-ons or Apps Script.
- Enhance mobile responsiveness and embed interactive charts for easier sharing.
- Include more granular drill-downs by accounts or regions for deeper insights.
Best Practices
- Regularly update actual and target numbers to keep the dashboard relevant and accurate.
- Train account managers on interpreting conditional formatting and trends for proactive decision making.
- Keep KPI definitions up to date for organizational alignment.
- Use the KPI Trend tab to identify emerging performance patterns early.
- Backup your dashboard regularly to prevent data loss.
FAQs
Click to Buy Account Management KPI Dashboard in Google Sheets
Can this dashboard be customized for different industries?
Yes, by updating the KPI definitions and input data accordingly, you can tailor it to suit varied business needs.
Is prior experience with Google Sheets necessary?
Basic knowledge helps, but the template’s intuitive design allows users with minimal experience to navigate it efficiently.
Can multiple users collaborate on the dashboard simultaneously?
Google Sheets supports real-time collaboration, making it easy for teams to work together on data input and analysis.
Conclusion
Click to Buy Account Management KPI Dashboard in Google Sheets
The Account Management KPI Dashboard in Google Sheets is an invaluable tool for businesses aiming to track their KPIs effectively with ease and accuracy. Its interactive features, clear data inputs, and meaningful visuals empower account managers to make informed decisions that drive growth. Leveraging this template can save time, enhance reporting, and provide actionable insights at a glance.
For additional resources and detailed walkthroughs, you can explore official guides on Google Sheets functions and features.
Visit our YouTube channel to watch the demo.
Click to Buy Account Management KPI Dashboard in Google Sheets