IT SLA Compliance and Ticket Monitoring Dashboard in Google Sheets
IT SLA Compliance and Ticket Monitoring Dashboard in Google Sheets is a ready-to-use, collaborative analytics template designed for IT service managers, help desk supervisors, IT operations leads, and managed service providers who need to monitor SLA compliance rates, track ticket volumes, analyze resolution times, and evaluate agent performance from a single Google Sheets workbook. This dashboard includes 5 interactive dashboard pages and a structured Data Sheet — delivering complete visibility into IT ticketing operations and SLA performance at a glance.IT SLA Compliance and Ticket Monitoring Dashboard in Google Sheets
Managing IT support tickets across disconnected spreadsheets and email threads creates confusion, delays critical decisions, and increases the risk of SLA breaches. This Google Sheets Dashboard template transforms your raw ticket data into powerful visual insights using Google Sheets’ built-in charting and formula engine — no scripts, no macros, and no coding required.
Click to Buy IT SLA Compliance and Ticket Monitoring Dashboard in Google Sheets
Key Features of IT SLA Compliance and Ticket Monitoring Dashboard in Google Sheets
This IT SLA Compliance and Ticket Monitoring Dashboard in Google Sheets includes 5 interactive dashboard pages plus a Data Sheet, tracking 5 key metrics: Total Ticket, Resolution Time (Days), Customer Rating, Open Ticket, and High Priority Ticket. Here are the standout features that make this template an essential tool for any IT team:IT SLA Compliance and Ticket Monitoring Dashboard in Google Sheets
- 5 KPI Cards on Overview Page — Total Ticket, Resolution Time (Days), Customer Rating, Open Ticket, and High Priority Ticket give you a high-level executive summary of your IT service health at a glance.
- SLA Compliance Tracking by Every Dimension — Monitor SLA Met rates across departments, ticket types, assigned agents, and monthly trends. Instantly identify which areas are meeting SLA targets and which are falling behind.
- Department Analysis — Dedicated page analyzing SLA Met, Resolution Time, High Priority Tickets, and Resolved counts broken down by each department for operational accountability.
- Ticket Type Analysis — Understand which ticket categories take the longest to resolve and where SLA breaches are most frequent with detailed breakdowns by ticket type.
- Assigned Agent Performance — Track individual agent SLA compliance rates, resolution times, high priority ticket loads, and total resolved counts for workforce optimization.
- Monthly Trends — Visualize SLA Met, Resolution Time, High Priority Ticket, and Resolved patterns over time for data-driven capacity planning and trend analysis.
- Dynamic Charts with Slicers — Every chart auto-updates when you replace the sample data. Multiple slicers allow instant filtering for quick drill-down analysis.
- Collaborative Google Sheets Platform — Share with your entire IT team in real-time from any device with Google Drive access.
Dashboard Pages Explanation
1. Overview Page
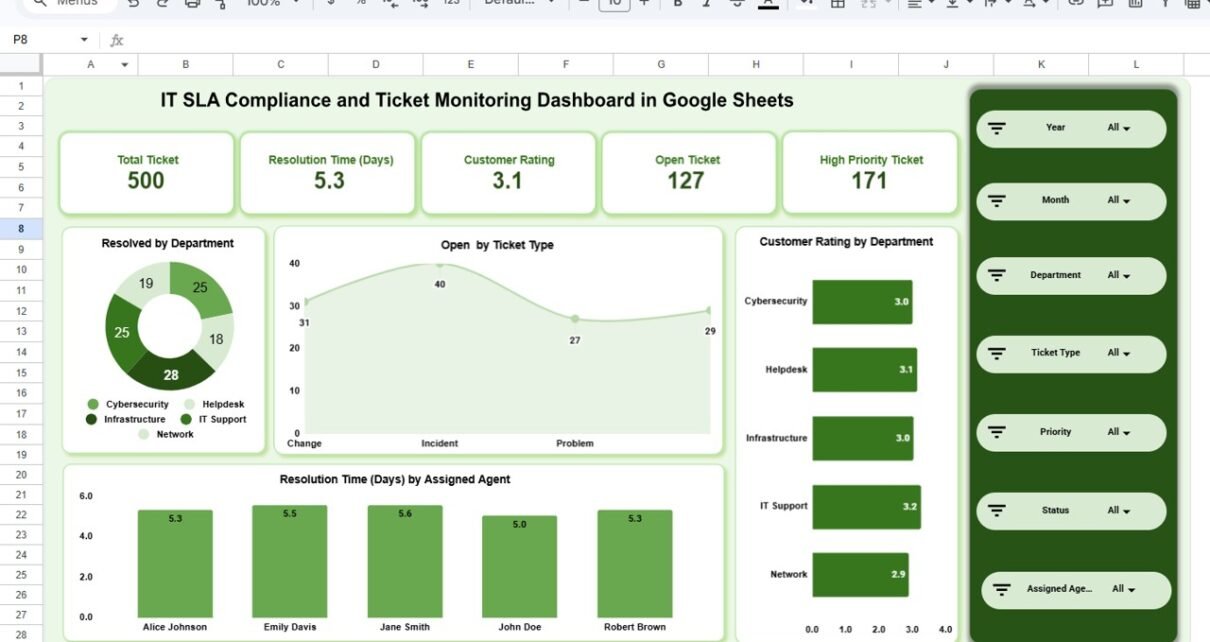
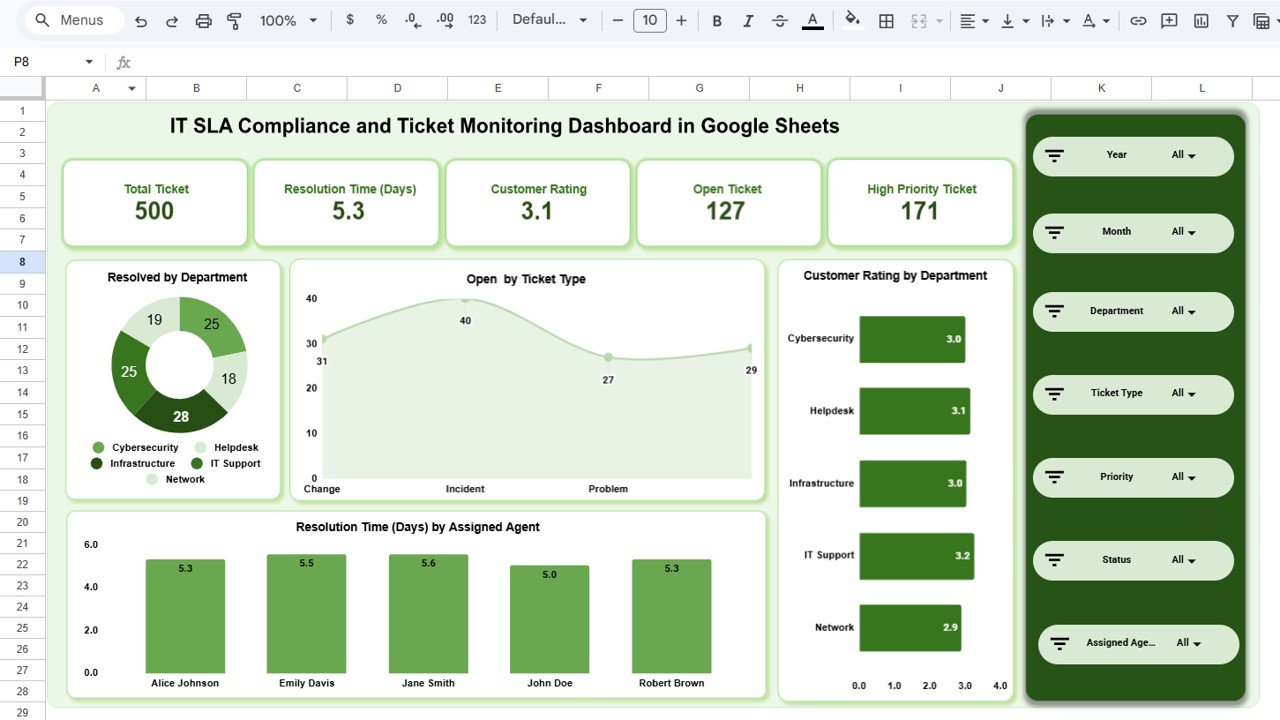
The Overview Page is the main landing page of the IT SLA Compliance and Ticket Monitoring Dashboard in Google Sheets. At the top, it displays 5 KPI cards showing high-level information — Total Ticket, Resolution Time (Days), Customer Rating, Open Ticket, and High Priority Ticket. Below the cards, multiple slicers allow you to apply filters and see the filtered dashboard instantly.IT SLA Compliance and Ticket Monitoring Dashboard in Google Sheets
The Overview page includes the following charts for visual analysis:
- Resolved by Department — This chart shows the total number of resolved tickets broken down by each department, helping you identify which departments are handling the most ticket volume and closing requests efficiently.
- Open by Ticket Type — This chart displays the count of currently open tickets categorized by ticket type, making it easy to spot which service categories have the highest backlog of unresolved requests.
- Customer Rating by Department — This chart visualizes the average customer satisfaction rating for each department, allowing managers to quickly compare service quality across teams and identify departments that need improvement.
- Resolution Time (Days) by Assigned Agent — This chart compares the average resolution time in days for each assigned agent, helping supervisors identify top performers and agents who may need additional support or training to improve their ticket turnaround speed.
IT SLA Compliance and Ticket Monitoring Dashboard in Google Sheets2. Department Analysis
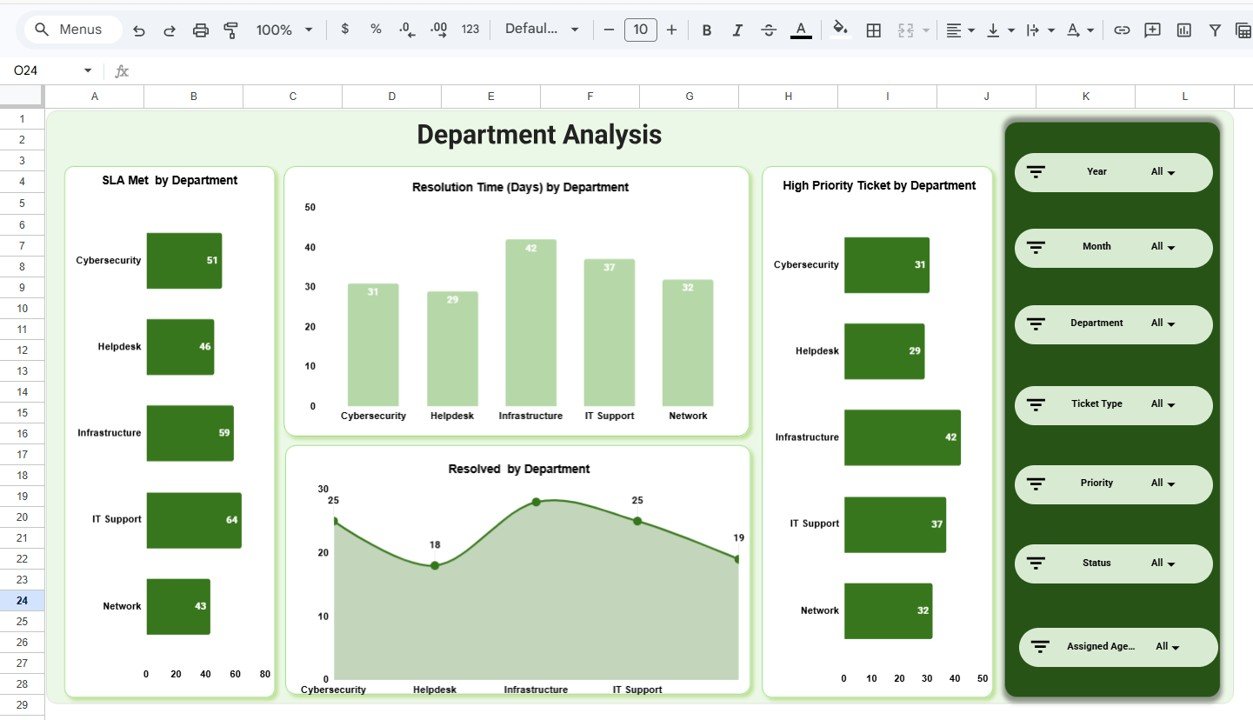
The Department Analysis page provides a deep-dive into department-level performance metrics. This page helps IT managers understand how each department is performing against SLA targets and where process improvements are needed. It includes the following charts:IT SLA Compliance and Ticket Monitoring Dashboard in Google Sheets
- SLA Met by Department — This chart shows the SLA compliance rate for each department, making it easy to identify which teams are consistently meeting their service level agreements and which are falling short.
- Resolution Time (Days) by Department — This chart compares the average ticket resolution time across departments, highlighting which teams resolve issues fastest and which departments experience delays that could lead to SLA breaches.
- High Priority Ticket by Department — This chart displays the count of high priority tickets assigned to each department, helping managers understand where critical issues are concentrated and allocate resources accordingly.
- Resolved by Department — This chart shows the total number of resolved tickets per department, providing a clear picture of each team’s throughput and capacity for handling IT service requests.
 Department Analysis
3. Ticket Analysis
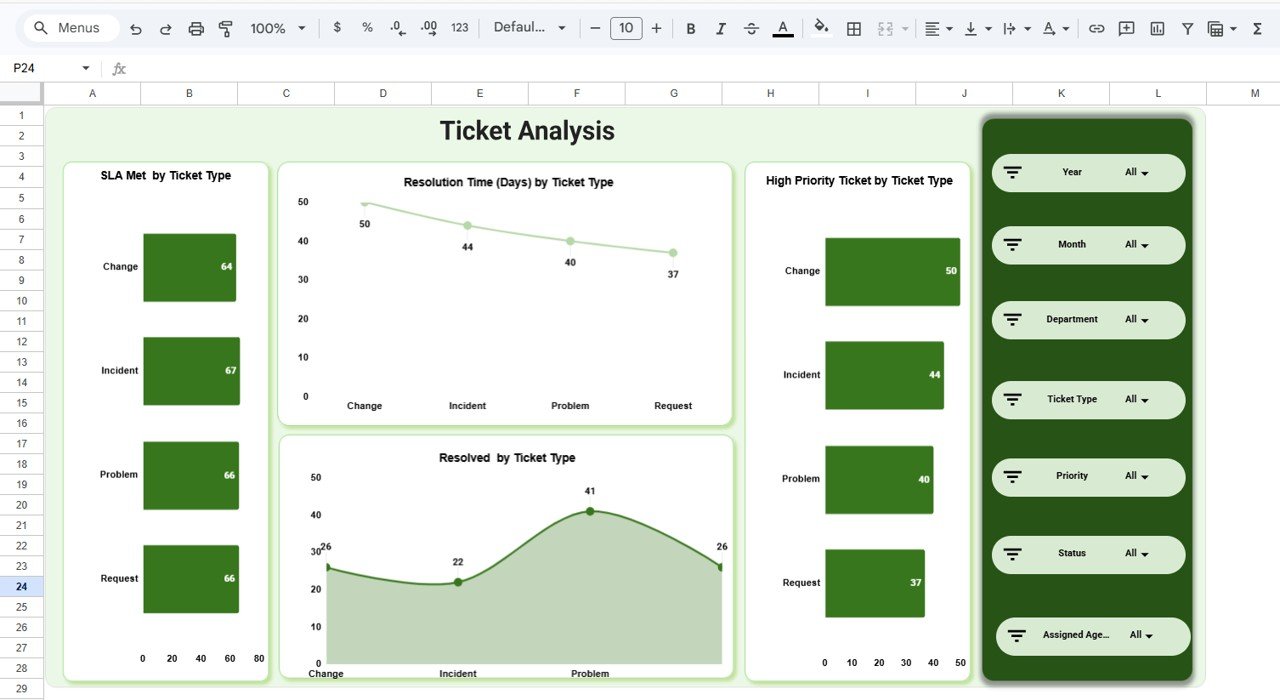
The Ticket Analysis page breaks down all performance metrics by ticket type, giving you granular visibility into how different service categories perform. This page includes:
- SLA Met by Ticket Type — This chart displays the SLA compliance rate for each ticket category, revealing which types of requests consistently meet targets and which categories need process optimization.
- Resolution Time (Days) by Ticket Type — This chart compares average resolution times across different ticket types, helping you understand which service categories take the longest to resolve and may require additional resources.
- High Priority Ticket by Ticket Type — This chart shows the distribution of high priority tickets across ticket categories, identifying which types of requests generate the most urgent issues for your IT team.
- Resolved by Ticket Type — This chart visualizes the total number of resolved tickets by category, providing insight into the volume and completion rate for each type of service request.
 Ticket Analysis
4. Assigned Agent Analysis
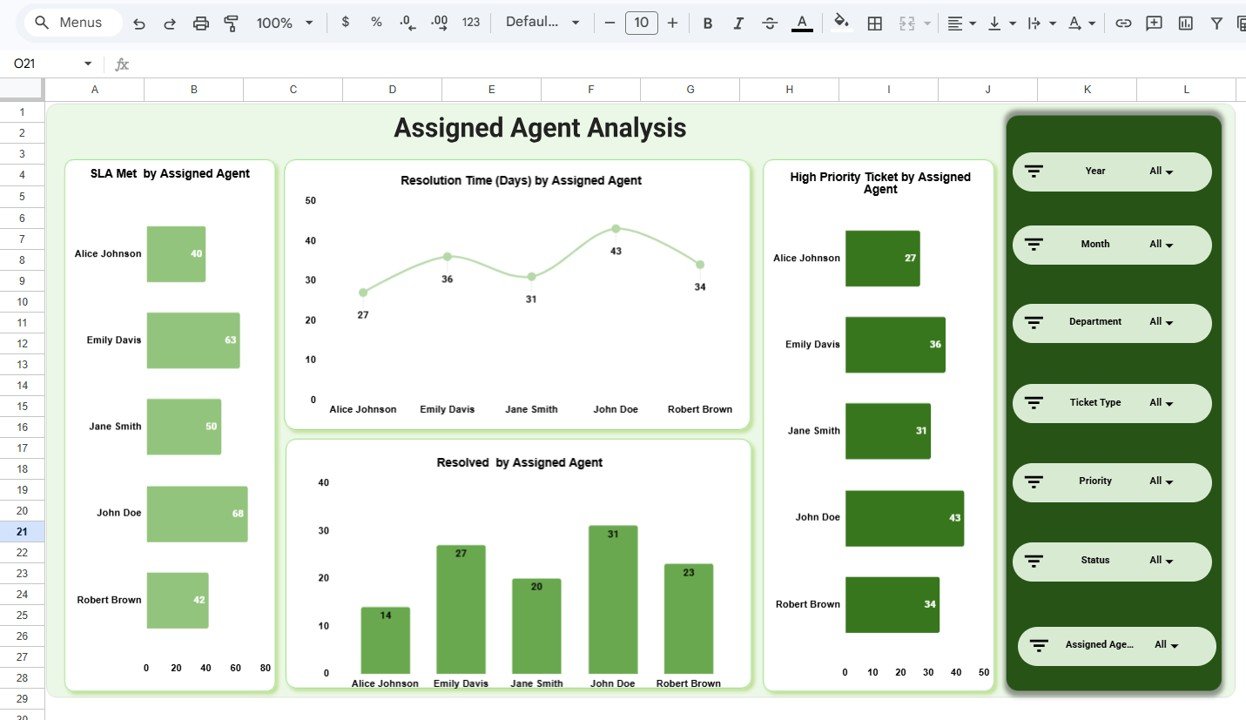
The Assigned Agent Analysis page evaluates individual team member productivity and SLA performance. This page is essential for performance reviews, workload balancing, and identifying agents who may need coaching. It includes:
- SLA Met by Assigned Agent — This chart shows each agent’s SLA compliance rate, making it easy to identify top-performing agents who consistently meet service level targets and those who may need additional support.
- Resolution Time (Days) by Assigned Agent — This chart compares the average resolution time for each agent, helping supervisors spot efficiency differences and address bottlenecks in individual workflows.
- High Priority Ticket by Assigned Agent — This chart displays how many high priority tickets are assigned to each agent, ensuring critical workload is distributed fairly and no single agent is overwhelmed with urgent requests.
- Resolved by Assigned Agent — This chart shows the total tickets resolved by each agent, providing a clear measure of individual throughput and contribution to the team’s overall ticket resolution performance.
 Assigned Agent Analysis
5. Monthly Trends
The Monthly Trends page tracks temporal patterns across all key SLA and ticket metrics. This page is critical for identifying seasonal patterns, workload spikes, and long-term improvement trends. It includes:
- SLA Met by Month — This chart tracks the SLA compliance rate month over month, allowing you to spot declining compliance trends early and take corrective action before SLA breaches become a pattern.
- Resolution Time (Days) by Month — This chart shows how average resolution times change over time, helping you assess whether process improvements are reducing ticket turnaround or if workload increases are causing delays.
- High Priority Ticket by Month — This chart displays the count of high priority tickets each month, making it easy to identify months with unusual spikes in critical issues that may require additional staffing or resources.
- Resolved by Month — This chart visualizes the total tickets resolved each month, providing a clear view of your team’s capacity and throughput trends over time for better workforce planning.
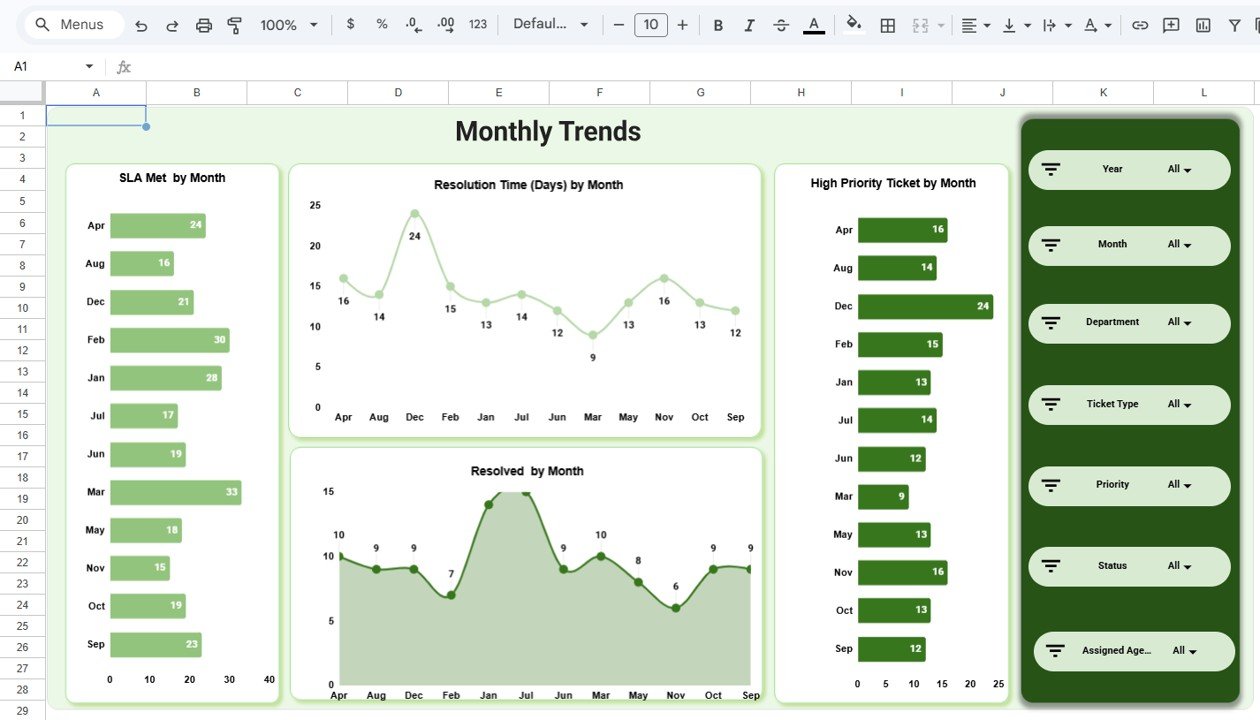 Monthly Trends
6. Data Sheet
The Data Sheet is the structured data input tab containing all ticket records. This is where you add your IT ticket data in the same column format as the sample records provided. Simply replace the sample rows with your own data and all 5 dashboard pages update automatically with your real numbers. No formulas to edit, no scripts to run — just paste your data and the entire dashboard refreshes.
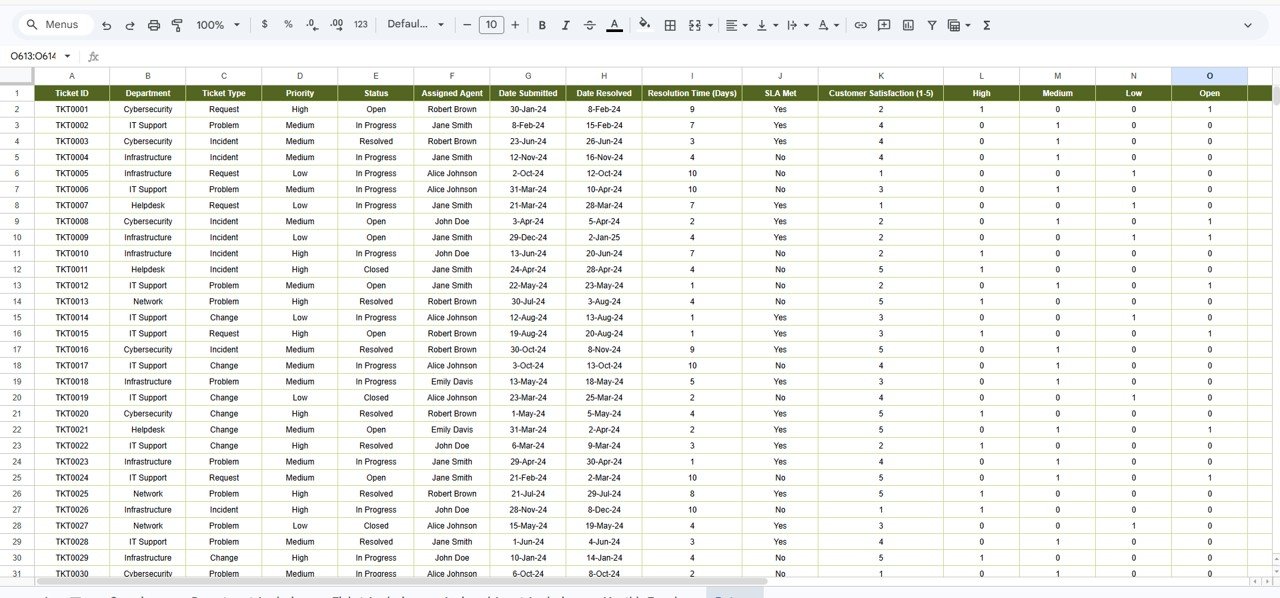 Data Sheet Tab
Advantages of IT SLA Compliance and Ticket Monitoring Dashboard in Google Sheets
- Zero Setup Time — Make a copy from Google Drive and start analyzing immediately. No software installation or configuration needed.
- Real-Time Collaboration — Multiple team members can view and analyze the dashboard simultaneously, making it ideal for distributed IT teams.
- Automated SLA Tracking — Built-in formulas automatically calculate SLA Met rates, resolution time averages, and high priority ticket counts as you update ticket data.
- Cross-Device Access — Access from any device with a web browser — desktop, tablet, or smartphone — through Google Drive.
- Cost-Effective Solution — No expensive ITSM software licenses needed. Get professional-grade SLA analytics using the free Google Sheets platform.
- Fully Customizable — Add new ticket types, modify departments, change agent names, or add new dashboard pages to match your specific IT operations.
Opportunities for Improvement
Click to Buy IT SLA Compliance and Ticket Monitoring Dashboard in Google Sheets
- Integration with external ticketing systems like Jira, Zendesk, or ServiceNow could automate data entry and reduce manual updates.
- Adding Google Apps Script automation could enable email alerts when SLA breach thresholds are crossed.
- A dedicated escalation tracking page could help managers monitor overdue tickets that require immediate attention.
- Adding a customer feedback analysis section would provide deeper insights into end-user satisfaction beyond numerical ratings.
Best Practices for Using the IT SLA Compliance Dashboard
- Update Data Regularly — For accurate SLA tracking, update ticket data at least weekly. Daily updates are recommended for high-volume help desks.
- Set Clear SLA Targets — Define resolution time and response time targets for each ticket type and priority level before importing data.
- Review Agent Performance Monthly — Use the Assigned Agent Analysis page during monthly 1:1 meetings to discuss workload, SLA rates, and resolved counts.
- Monitor Monthly Trends Quarterly — Use the Monthly Trends page to identify seasonal patterns and plan staffing adjustments proactively.
- Share with View-Only Access — Share the dashboard with stakeholders using view-only permissions to prevent accidental data changes.
- Archive Old Data Quarterly — Move completed tickets older than 12 months to a separate archive sheet to keep the dashboard responsive.
Explore Relevant Templates
Click to Buy IT SLA Compliance and Ticket Monitoring Dashboard in Google Sheets
If you are looking for IT analytics tools on other platforms, check out these related templates from NextGenTemplates:
- IT Services Dashboard in HTML — Track IT service requests, SLA compliance, team performance, and service trends with interactive browser-based analytics.
- Cloud Migration Services Dashboard in Excel — Monitor cloud migration budget, workloads, downtime, and costs with pivot-powered Excel charts.
- Cloud Migration Services Dashboard in Power BI — Track cloud migration projects across platforms and industries with interactive Power BI visuals.
Browse all Google Sheets Dashboard Templates on NextGenTemplates.
Frequently Asked Questions
What KPIs does the IT SLA Compliance and Ticket Monitoring Dashboard in Google Sheets track?
The IT SLA Compliance and Ticket Monitoring Dashboard in Google Sheets tracks 5 key performance indicators including Total Ticket, Resolution Time (Days), Customer Rating, Open Ticket, and High Priority Ticket. It also analyzes SLA Met rates, resolution times, high priority tickets, and resolved counts across departments, ticket types, assigned agents, and monthly trends across 5 interactive dashboard pages.
Do I need advanced Google Sheets skills to use this dashboard?
No. Simply make a copy of the Google Sheet using the link provided in the PDF guide, replace the sample data with your own IT ticket records, and all charts and KPI cards update automatically. No scripts, macros, or advanced formulas to configure.
Can multiple team members access this dashboard simultaneously?
Yes. Since this dashboard runs on Google Sheets, you can share it with your entire IT team via Google Drive. Multiple users can view and analyze the dashboard simultaneously from any device with internet access.
What is the best Google Sheets template for tracking IT SLA compliance?
The IT SLA Compliance and Ticket Monitoring Dashboard in Google Sheets from NextGenTemplates is one of the best options available. It includes 5 interactive dashboard pages, 5 KPI cards, SLA compliance tracking by department, ticket type, agent, and month, plus a structured data sheet — all in a single collaborative Google Sheets workbook.
Can I customize the ticket categories and departments in this dashboard?
Yes. The data sheet allows you to define your own ticket types, department names, agent names, priority levels, and SLA targets. All charts across the dashboard adapt automatically to your custom data structure.
How does this compare to dedicated ITSM tools like ServiceNow or Zendesk?
This Google Sheets dashboard is ideal for small to mid-sized IT teams that need professional SLA analytics without the cost and complexity of enterprise ITSM platforms. It provides the core SLA tracking, ticket monitoring, and agent performance features that most teams need, with the added benefit of real-time collaboration through Google Drive and zero software licensing costs.
Conclusion
Click to Buy IT SLA Compliance and Ticket Monitoring Dashboard in Google Sheets
The IT SLA Compliance and Ticket Monitoring Dashboard in Google Sheets is the ultimate analytics solution for IT teams that want to track SLA compliance, monitor ticket volumes, analyze resolution times, and evaluate agent performance from a single collaborative workbook. With 5 interactive dashboard pages covering Overview, Department Analysis, Ticket Analysis, Assigned Agent Analysis, and Monthly Trends — plus 5 KPI cards, dynamic slicers, and a structured data sheet — this template delivers everything you need to run a data-driven IT service desk.
Click here to Purchase IT SLA Compliance and Ticket Monitoring Dashboard in Google Sheets
Visit our YouTube channel for step-by-step video tutorials: Youtube.com/@NeoTechNavigators
Click to Buy IT SLA Compliance and Ticket Monitoring Dashboard in Google Sheets