Freelancer Business Dashboard in Google Sheets is a comprehensive, cloud-based analytics template that empowers freelancers, consultants, and independent professionals to track their revenue, expenses, projects, clients, and overall business performance in one centralized place. With 13 KPI cards, 9 dynamic charts across 5 interactive pages, built-in slicers for instant filtering, and a dedicated record search sheet, this Google Sheets dashboard gives you the complete picture of your freelancing business without writing a single formula. Whether you are managing multiple clients on different platforms or trying to understand which service categories generate the highest profit, this template does the heavy lifting for you.
👉 Click here to Purchase Freelancer Business Dashboard in Google Sheets
Key Features of Freelancer Business Dashboard in Google Sheets
- 13 KPI Cards — The Overview page displays Sessions, Avg Hours, Total Revenue, Avg Rating, Open Projects, Unique Clients, Total Hours, Avg Rate, Total Expenses, Client Satisfaction, Completed Projects, Total Profit, and Audit Summary Completion Rate.
- 5 Interactive Dashboard Pages — Overview, Growth, Projects, Analytics, and Search sheets provide a 360-degree view of your freelancing business.
- 9 Dynamic Charts — From Revenue by Category to Monthly Profit Trends to Top Clients by Revenue, every critical metric is visualized.
- Interactive Slicers — Filter your dashboard by category, platform, status, or time period with a single click.
- Record Search by ID — Look up any project record instantly with full details plus a Client Summary panel.
- Cloud-Based Access — Works on any device via Google Sheets. Perfect for freelancers who work remotely or travel frequently.
- Auto-Updating — Replace sample data with your own and all charts, KPIs, and analysis pages refresh automatically.
- No Coding Required — Designed for non-technical users who want professional-grade analytics without complexity.
Dashboard Pages Explained
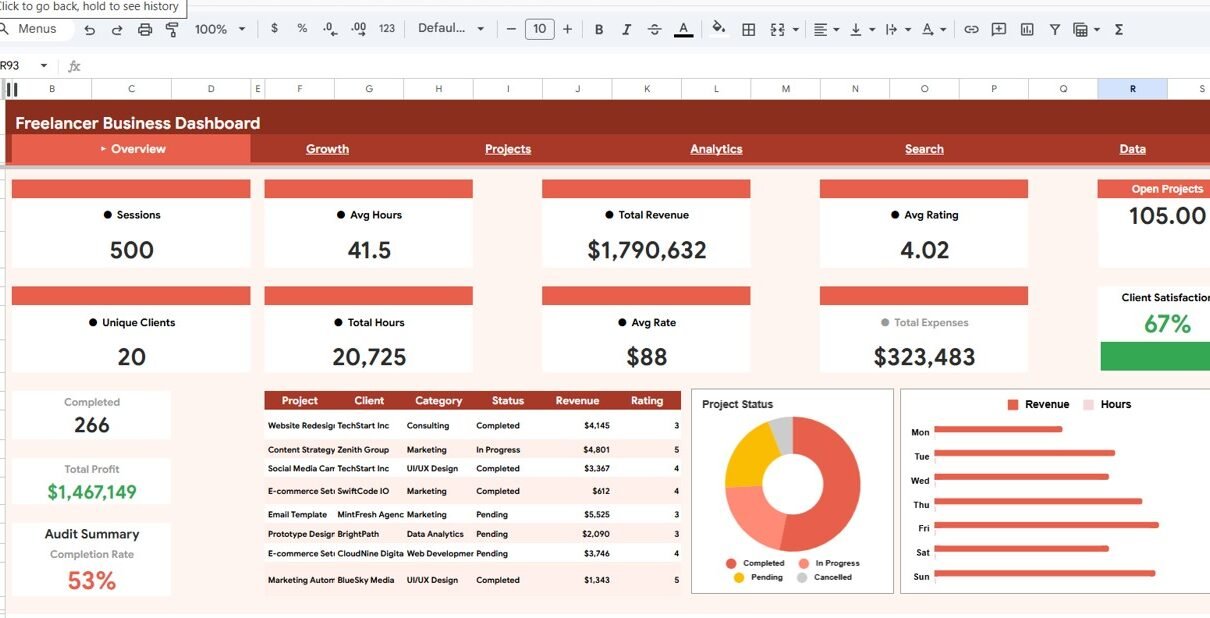
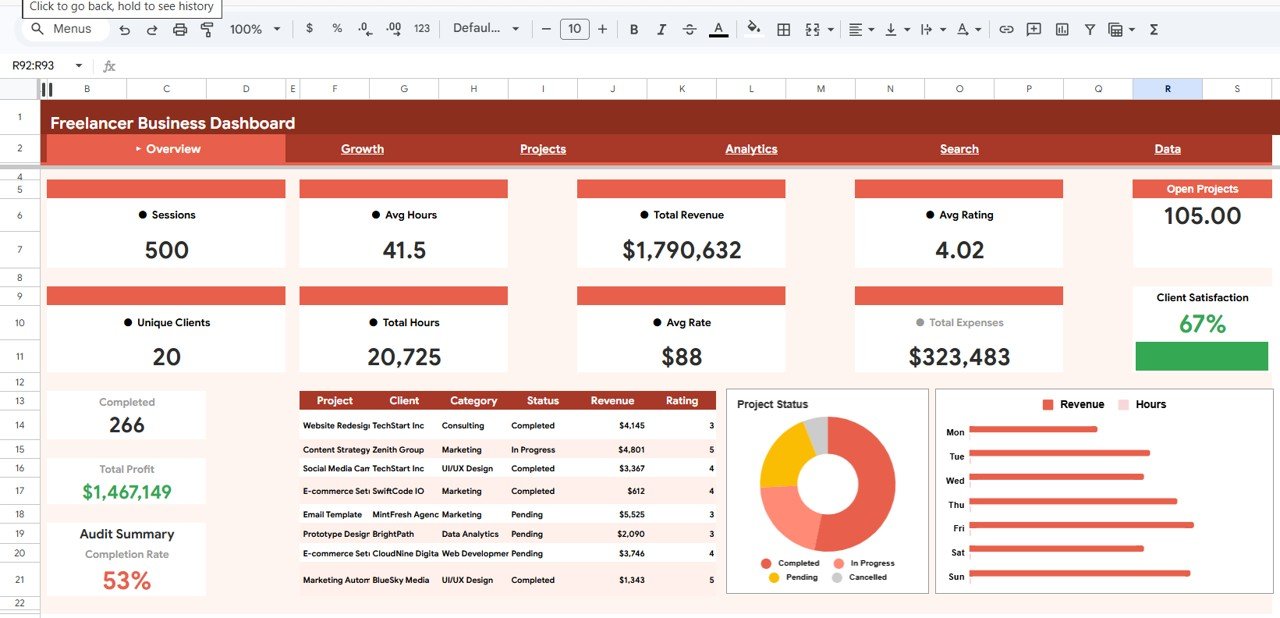
1. Overview Page
The Overview page is the main command center of the Freelancer Business Dashboard in Google Sheets. At the top, 13 KPI cards provide a high-level snapshot of your business health — including Total Revenue, Total Profit, Open Projects, Unique Clients, Client Satisfaction, and Audit Summary Completion Rate. Below the cards, three dynamic charts deliver instant visual insights:
- Project Status by Category — Shows the distribution of active, completed, and pending projects across your freelancing categories, helping you understand workload balance.
- Revenue by Category — Breaks down your total earnings by each service type so you can quickly identify your most profitable niches.
- Hours by Category — Reveals where you are investing the most time, enabling you to optimize hourly rates and prioritize high-value work.
Multiple interactive slicers allow you to filter the entire page by category, platform, status, or date range without modifying the underlying data.
Overview Page
2. Growth Page
The Growth page focuses on trend analysis and platform performance. This is where you track how your freelancing business evolves over time:
- Monthly Revenue and Profit Trend by Month — A line chart displaying your income and profit trajectory, helping you spot seasonal patterns and growth opportunities.
- Revenue by Platform — Highlights which freelancing platforms or acquisition channels (Upwork, Fiverr, Toptal, direct clients, etc.) generate the most income for your business.
- Revenue by Category per Quarter — A quarterly breakdown that helps you plan resource allocation, marketing efforts, and service expansion strategically.
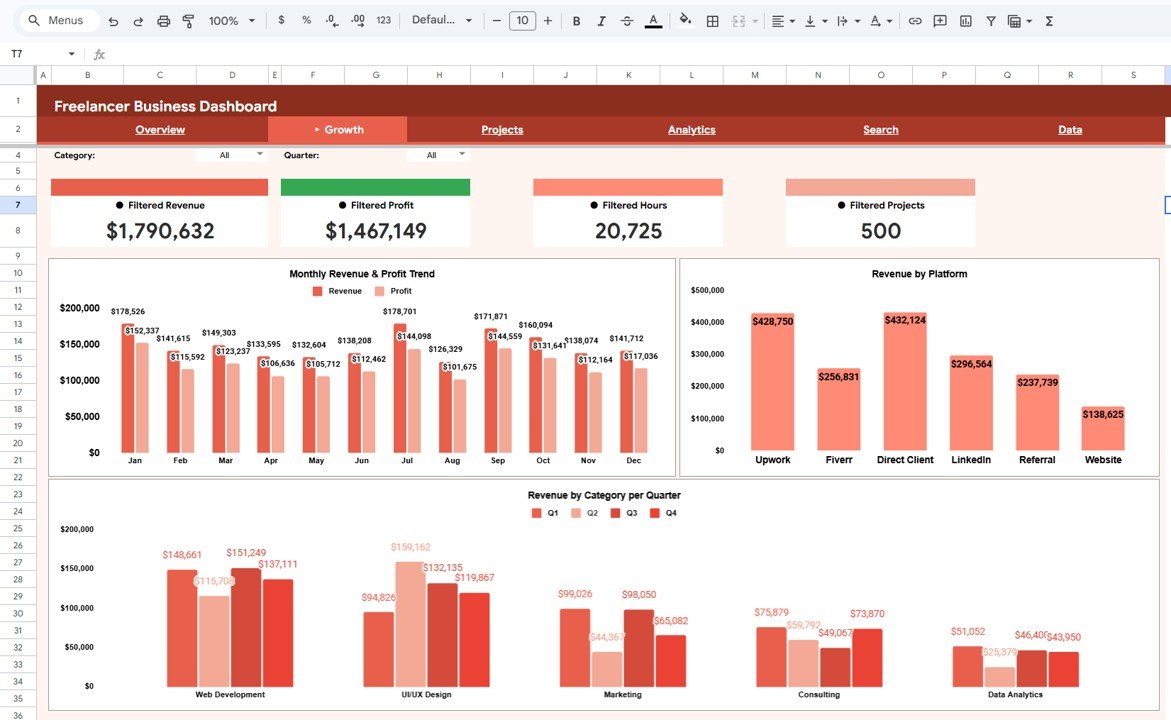
Growth Page
3. Projects Page
The Projects page provides a deep dive into individual project performance and client relationships:
- Hours Worked vs Revenue by Project — Compares the effort invested against the income earned for each project, making it easy to identify high-value and low-value engagements.
- Revenue by Priority — Shows how your earnings distribute across high, medium, and low priority projects so you can focus on what matters most.
- Top Clients by Revenue — Ranks your clients by total spending, enabling you to nurture your most valuable relationships and plan retention strategies.
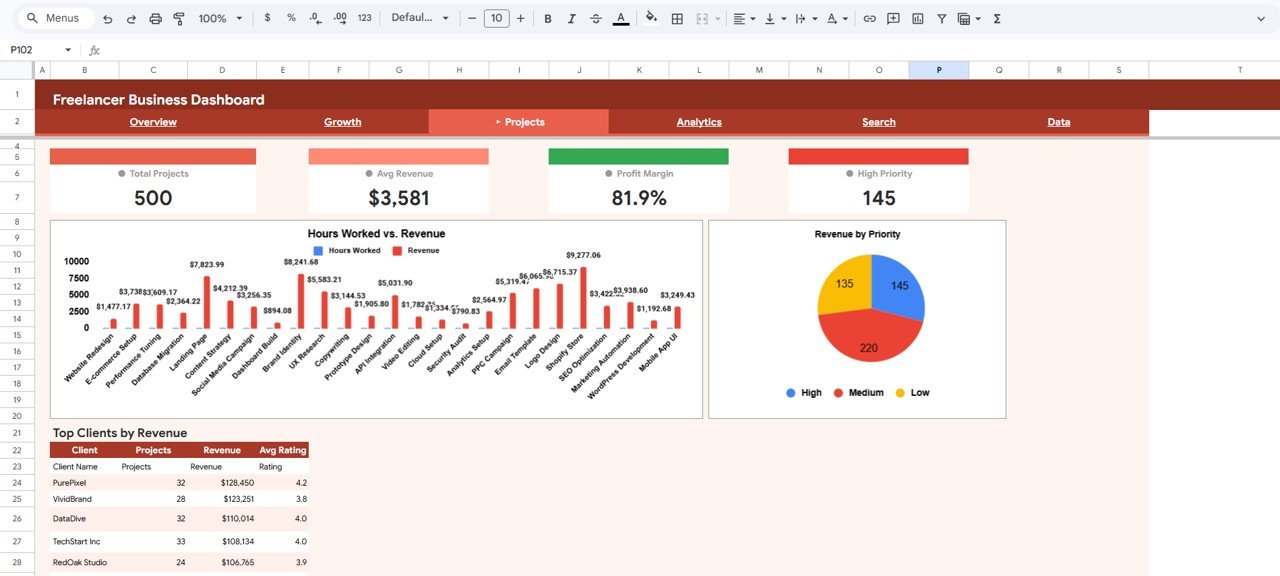
Projects Page
4. Analytics Page
The Analytics page delivers advanced category and time-based analysis for data-driven decision making:
- Projects by Category and Status — Visualizes how many projects in each category are active, completed, or on hold, giving you a clear picture of pipeline health.
- Category Performance Summary by Category — Aggregates key metrics per service category for a comprehensive side-by-side comparison.
- Monthly Hours and Projects by Month — Tracks your workload over time to help you manage capacity, prevent burnout, and plan hiring or outsourcing when needed.
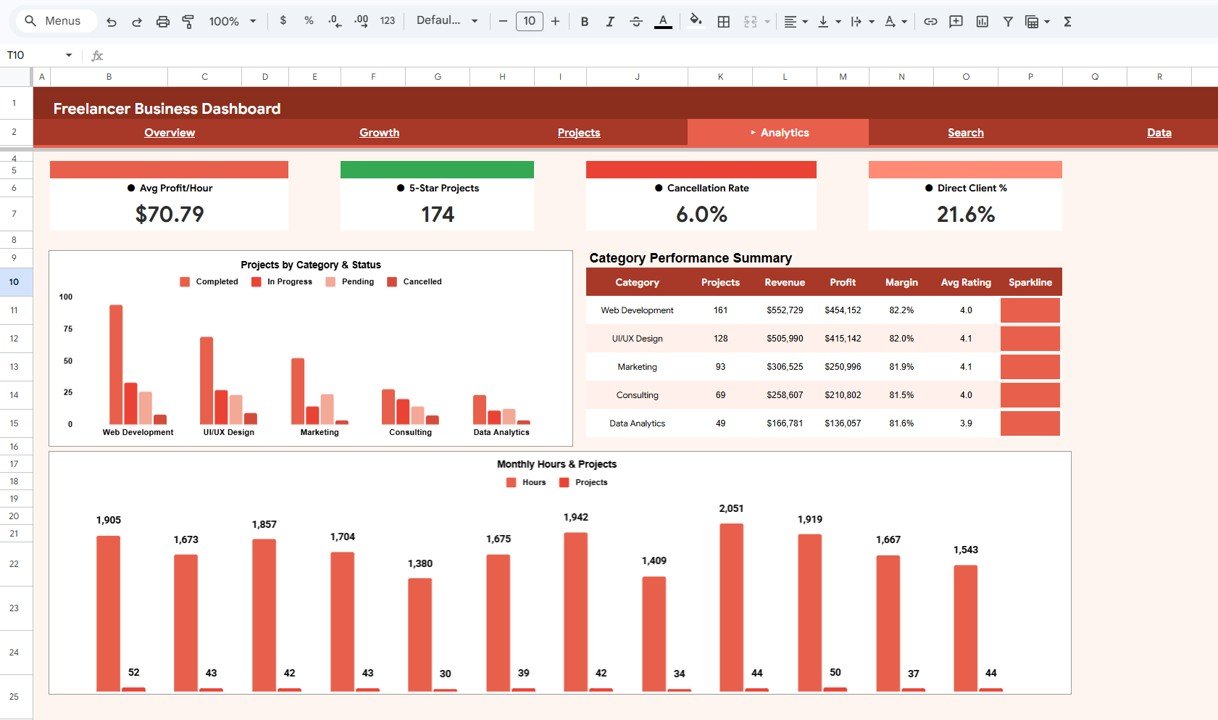
Analytics Page
5. Search Sheet
The Search sheet is a powerful lookup tool that lets you search any freelancer record by Record ID using a dropdown selector. Once you select a Record ID, it instantly displays the full details including Record ID, Date, Client Name, Project Name, Category, Platform, Status, Priority, Hours Worked, Hourly Rate, Revenue, Expenses, Profit, and Satisfaction. On the right side, a Client Summary panel shows Client Total Revenue, Client Total Projects, and Avg Client Rating for quick cross-reference.
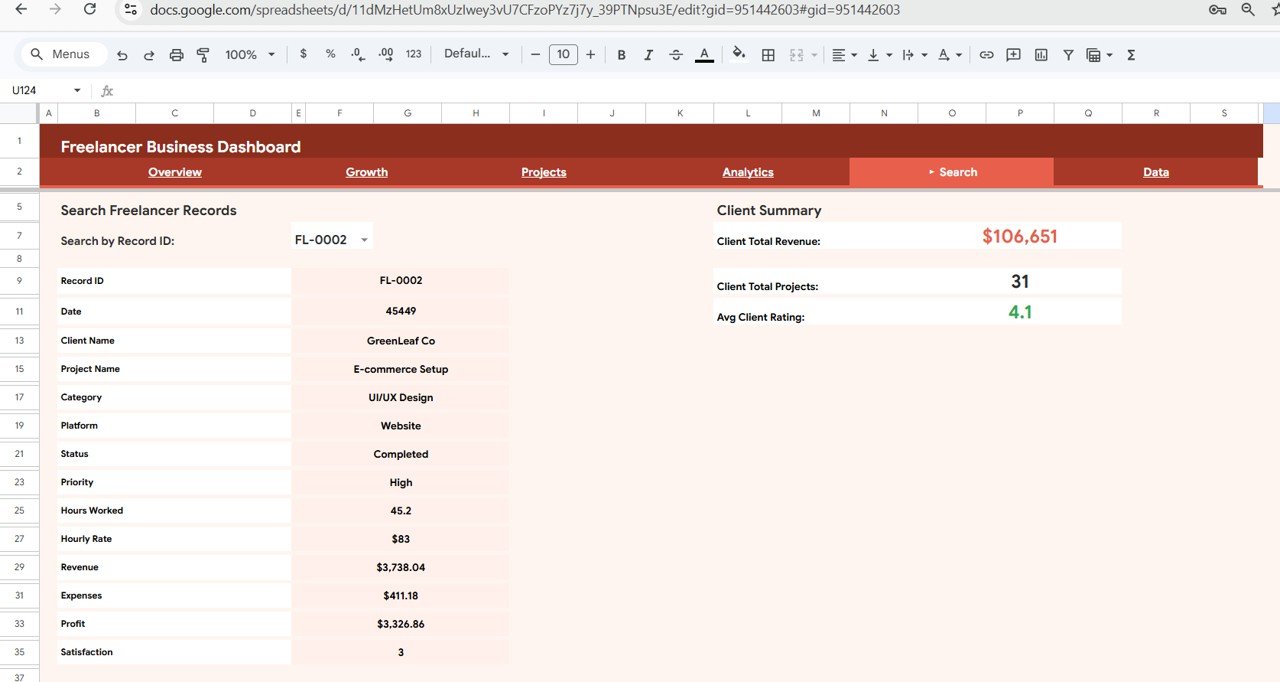
Search Sheet
6. Data Sheet
The Data sheet is the structured input layer where all your freelancing records are stored. Each row represents one project session with fields for Date, Client Name, Project Name, Category, Platform, Status, Priority, Hours Worked, Hourly Rate, Revenue, Expenses, Profit, and Satisfaction. Simply add your data in the same format and every dashboard page updates automatically. The template comes with 500 sample records so you can explore the dashboard features before adding your own data.
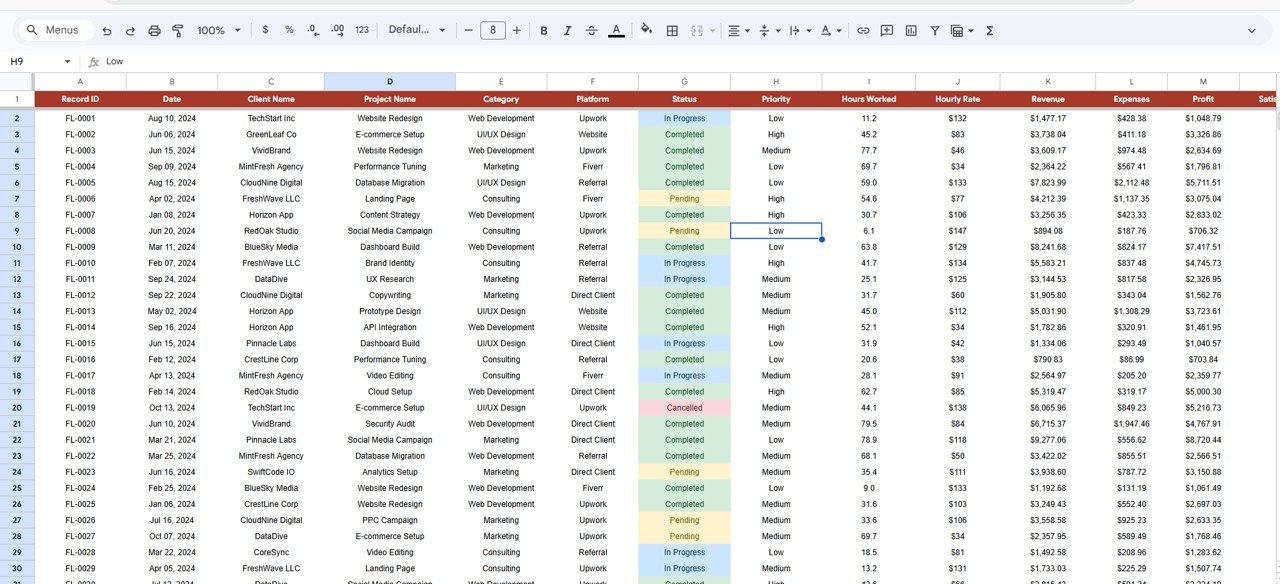
Data Sheet
Advantages of Freelancer Business Dashboard in Google Sheets
- Complete Business Visibility — With 13 KPIs and 9 charts spread across 5 pages, you get a full picture of revenue, expenses, profit, project status, client performance, and platform effectiveness in one template.
- Cloud-Native Convenience — Built in Google Sheets, you can access your dashboard from any laptop, tablet, or phone with an internet connection. No desktop software required.
- Real-Time Collaboration — Share your dashboard with an accountant, business partner, or virtual assistant for real-time input and review.
- Instant Filtering with Slicers — Drill down into specific categories, platforms, or time periods without editing any data or formulas.
- Time Savings — Instead of building charts and formulas from scratch, simply replace the sample data and your analytics are ready within minutes.
- Multi-Platform Tracking — Whether you earn from Upwork, Fiverr, Toptal, LinkedIn, or direct clients, track every platform’s contribution in a single view.
- Professional Reporting — Use the dashboard to present business performance to potential clients, partners, or lenders with polished visualizations.
This template is also available as a Freelancer Business Dashboard in Excel, Freelancer Business Dashboard in Power BI, and Freelancer Business Dashboard in HTML.
Opportunities for Improvement
- Automated Data Import — Currently, data entry is manual. You could enhance the template by connecting it to invoicing tools or time-tracking apps via Google Apps Script for automated data feeds.
- Custom Date Filters — While the slicers handle basic filtering, adding a custom date range picker using Apps Script would give you more granular control over time-based analysis.
- Goal Tracking — Adding monthly or quarterly revenue targets alongside actual performance would let you track progress toward financial goals directly on the dashboard.
- Invoice Integration — Linking completed projects to an invoice tracking sheet would help close the loop between project delivery and payment collection.
- Expense Categories — Breaking down expenses into sub-categories (software, hardware, marketing, travel) would provide deeper cost analysis insights.
Best Practices for Using the Freelancer Business Dashboard
👉 Click here to Purchase Freelancer Business Dashboard in Google Sheets
- Update Data Weekly — Make it a habit to enter your project records at least once a week so your dashboard always reflects your current business state.
- Use Consistent Naming — Keep client names, project names, categories, and platform names consistent across all records to ensure accurate aggregation in charts and KPIs.
- Review Growth Page Monthly — Check the Monthly Revenue and Profit Trend at least once a month to identify growth patterns and address declines early.
- Monitor Client Concentration — Use the Top Clients by Revenue chart to ensure you are not overly dependent on a single client. A healthy freelance business diversifies revenue sources.
- Track Satisfaction Scores — The Client Satisfaction KPI helps you maintain service quality. If scores dip below your target, investigate and address the root cause promptly.
- Backup Your Data — Google Sheets has version history, but consider exporting a periodic backup to protect your records.
- Share Read-Only Access — When sharing with clients or stakeholders, use Google Sheets’ sharing permissions to grant view-only access and protect your data.
Explore Relevant Templates
- Freelance Business KPI Scorecard in Google Sheets — A focused KPI scorecard template for tracking freelancer performance metrics with monthly targets and actuals.
- Personal Finance Dashboard in Google Sheets — Track personal income, expenses, savings, and investments to manage your finances alongside freelancing earnings.
- Freelancer Business Dashboard in Power BI — For freelancers who need advanced drill-through analytics, DAX measures, and desktop-level data modeling.
- Freelancer Business Dashboard in HTML — A browser-based interactive dashboard version with modern SaaS-style design.
- Freelancer Business Dashboard in Excel — The Excel version for users who prefer offline access with pivot tables and advanced charting.
Frequently Asked Questions
👉 Click here to Purchase Freelancer Business Dashboard in Google Sheets
What is the best Google Sheets dashboard template for freelancers?
The Freelancer Business Dashboard in Google Sheets is one of the most comprehensive options available. It includes 13 KPI cards, 9 dynamic charts across 5 interactive pages, built-in slicers for instant filtering, and a dedicated search sheet — all designed specifically for freelancers who need to track revenue, expenses, projects, and client satisfaction in one place.
How do I track my freelancer revenue and expenses in Google Sheets?
With the Freelancer Business Dashboard in Google Sheets, you simply enter your project records in the Data sheet — including Revenue, Expenses, Hours Worked, Client Name, and Platform. The dashboard automatically calculates Total Revenue, Total Expenses, Total Profit, and displays trends across months, categories, and platforms on 5 analysis pages.
Can I use this dashboard to track multiple freelancing platforms like Upwork and Fiverr?
Yes. The Growth page includes a dedicated Revenue by Platform chart that breaks down your earnings by each platform you work on. Simply enter the platform name (Upwork, Fiverr, Toptal, Direct, etc.) in the Data sheet and the chart updates automatically.
Do I need any coding or Google Apps Script knowledge?
No. The Freelancer Business Dashboard in Google Sheets is a formula-driven template that requires zero coding. All charts, KPI cards, and analysis pages are powered by built-in Google Sheets formulas. Just replace the sample data with your own records and everything updates automatically.
How many KPIs does this freelancer dashboard track?
The dashboard tracks 13 key performance indicators on the Overview page: Sessions, Avg Hours, Total Revenue, Avg Rating, Open Projects, Unique Clients, Total Hours, Avg Rate, Total Expenses, Client Satisfaction, Completed Projects, Total Profit, and Audit Summary Completion Rate.
Can I customize the categories and add my own service types?
Absolutely. The categories, platforms, statuses, and priorities are all data-driven. You can modify them directly in the Data sheet to match your specific freelancing services, and all charts and slicers will reflect your custom data automatically.
Conclusion
The Freelancer Business Dashboard in Google Sheets is a must-have tool for any freelancer who wants to take control of their business analytics without spending hours on spreadsheet setup. With 13 KPI cards, 9 charts, 5 interactive pages, slicers, and a search sheet, it delivers enterprise-grade insights in a simple, cloud-based format that works on any device. Replace the sample data with your own and start making data-driven decisions about your freelancing career today.
👉 Click here to Purchase Freelancer Business Dashboard in Google Sheets
For more Google Sheets dashboard templates, visit NextGenTemplates Google Sheets Dashboard Collection.
🎥 Watch step-by-step tutorials on our YouTube channel: Youtube.com/@NeoTechNavigators