Restaurant Profit and Loss Dashboard in HTML is a powerful, interactive, and professionally designed browser-based dashboard template built specifically for restaurant owners, food service managers, multi-branch operators, finance teams, and hospitality consultants who need to monitor gross revenue, net revenue, operating profit, COGS, labor costs, waste, and branch-level performance from a single dynamic interface. This template includes 5 interactive dashboard pages — Overview, Branch Performance, Revenue Analysis, Cost Breakdown, and Data View — making it the most comprehensive HTML-based restaurant P&L analytics solution available today.
Click here to Purchase Restaurant Profit and Loss Dashboard in HTML
Whether you run a single restaurant or manage a chain of locations, this dashboard transforms your raw financial data into beautiful, actionable visual insights — all inside a single HTML file that runs directly in your browser. No installation, no plugins, no licenses — just unzip and open. If you have been searching for a modern, data-driven alternative to spreadsheets for tracking restaurant profitability, the Restaurant Profit and Loss Dashboard in HTML is the answer.
Key Features of Restaurant Profit and Loss Dashboard in HTML
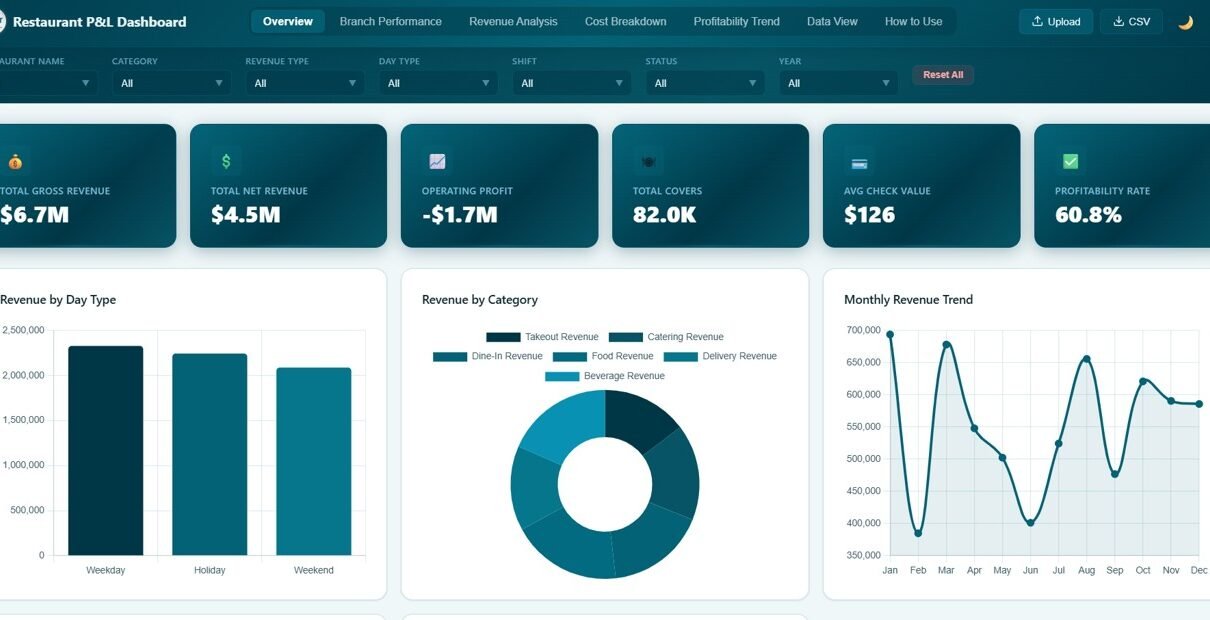
This dashboard is packed with features designed specifically for restaurant financial analytics. It includes 6 dynamic KPI cards on the overview page that display Total Gross Revenue, Total Net Revenue, Operating Profit, Total Covers, Avg Check Value, and Profitability Rate. These metrics give you an instant snapshot of your restaurant’s financial health at a glance.
The template provides 5 dedicated analysis pages, each focusing on a different dimension of your restaurant business. The interactive slicers and filters let you drill down by branch, category, shift, day type, and other dimensions. The comprehensive chart library covers 20+ visualizations spanning revenue trends, branch comparisons, cost breakdowns, and more. Because the dashboard is browser-based, it requires absolutely no software installation and features a SaaS-grade professional design with responsive layout, multi-tab navigation, and a data explorer with search, sort, pagination, and CSV export capabilities.
Dashboard Pages Explained
Overview Page
The Overview page serves as your main command center. At the top, 6 KPI cards display high-level metrics: Total Gross Revenue, Total Net Revenue, Operating Profit, Total Covers, Avg Check Value, and Profitability Rate. Below the cards, interactive charts show Gross Revenue by Restaurant comparing income across all your branches, Revenue by Category breaking down earnings by food, beverage, and other categories, Monthly Revenue Trend tracking your revenue trajectory over time, Status Distribution showing the proportion of different order statuses, and Revenue by Day Type analyzing how weekdays versus weekends impact your revenue. Multiple slicers allow you to instantly filter the entire dashboard by any dimension.
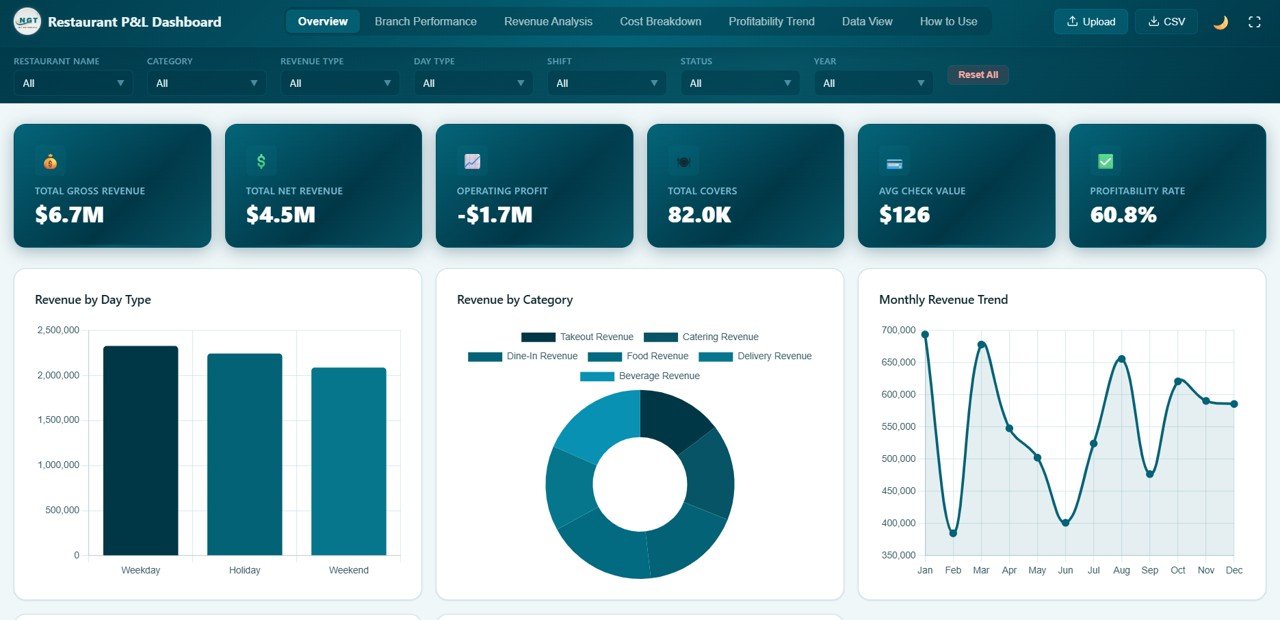
Overview Page
Branch Performance
The Branch Performance page provides a comprehensive side-by-side comparison of all your restaurant locations. It includes Total Revenue by Branch to identify which locations generate the most income, Operating Profit by Branch to compare profitability across locations, Labor Cost by Branch to monitor staffing expenses at each site, Waste Amount by Branch to highlight where food waste is highest, and Covers by Branch to track customer volume at each restaurant. This page is essential for multi-location restaurant operators who need to quickly identify top-performing and underperforming branches and take data-driven corrective action.
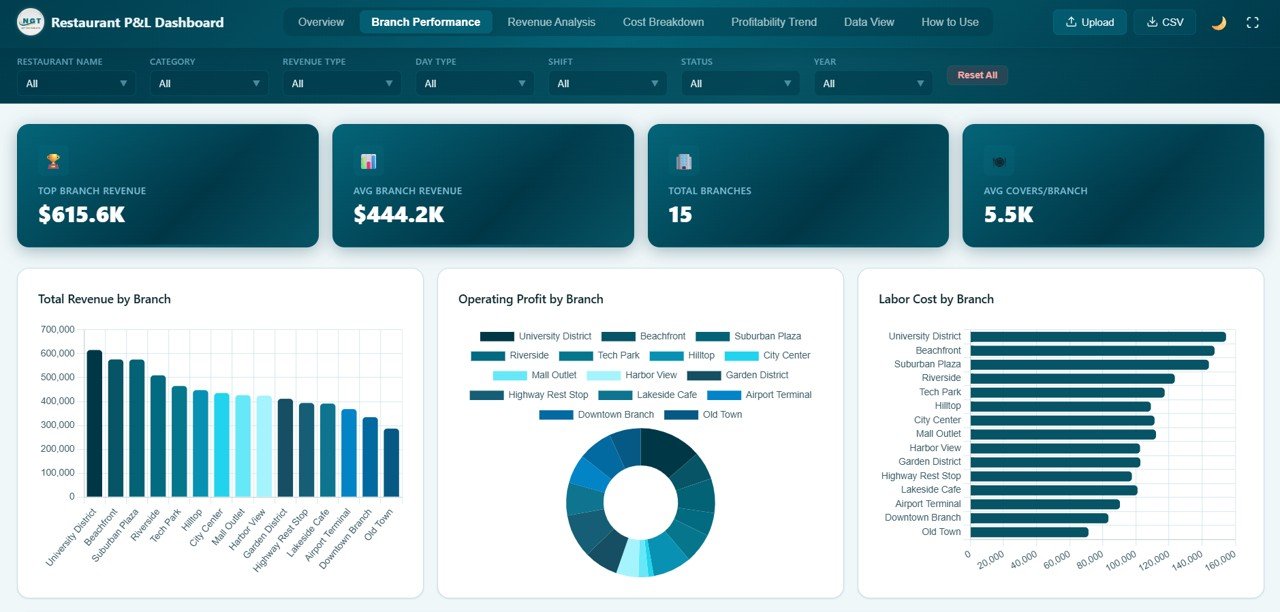
Branch Performance
Revenue Analysis
The Revenue Analysis page dives deep into your revenue streams to help you understand where your money is coming from. It features Revenue by Revenue Type comparing dine-in, takeaway, delivery, and other channels, Net Revenue by Category analyzing income after deductions across food and beverage categories, Revenue by Shift comparing earnings across breakfast, lunch, and dinner shifts, Gross vs Net Revenue by Month tracking the gap between gross and net revenue over time, and Revenue Type by Day Type cross-analyzing revenue channels with weekday and weekend patterns. These insights help restaurant managers optimize pricing, staffing, and menu strategies.
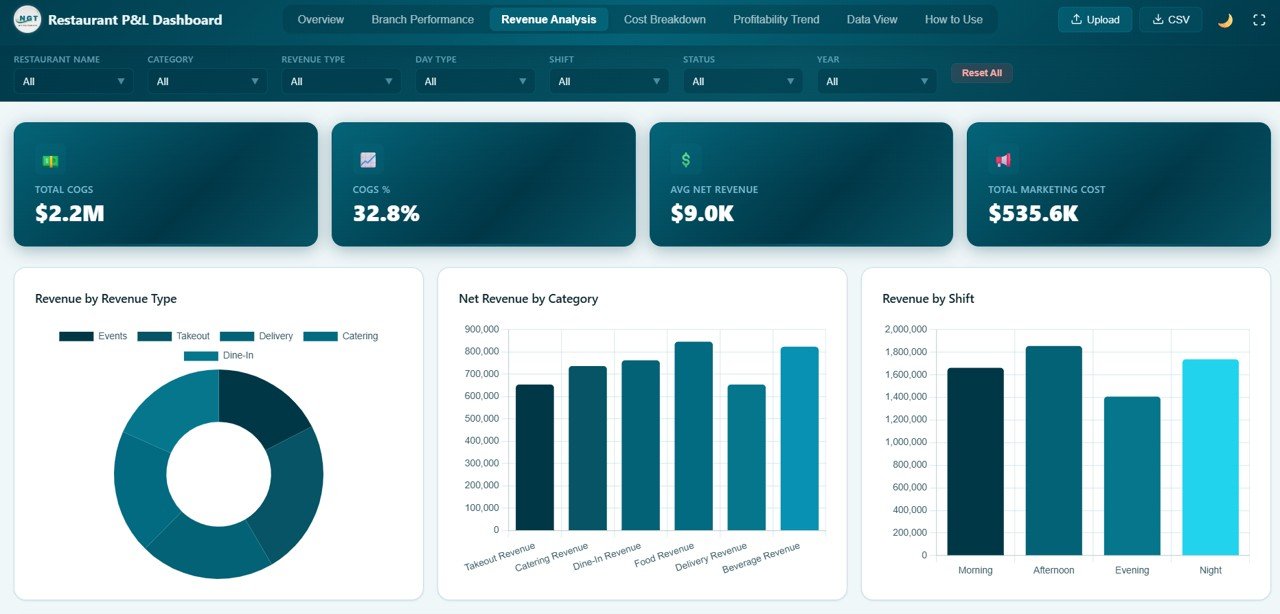
Revenue Analysis
Click here to Purchase Restaurant Profit and Loss Dashboard in HTML
Cost Breakdown
The Cost Breakdown page is your expense control center. It visualizes Cost Breakdown by Category showing how expenses are distributed across COGS, labor, utilities, rent, and other categories, Monthly COGS Trend tracking how cost of goods sold fluctuates month over month, Labor Cost by Shift revealing which shifts consume the most staffing budget, Waste by Category identifying which food and material categories generate the most waste, and Cost by Restaurant comparing total expenses across all your branches. This page empowers finance teams to spot cost leaks and optimize spending for better margins. If you enjoy this kind of financial analysis, you may also like the Personal Finance Dashboard in HTML or the Freelancer Business Dashboard in HTML for other financial tracking needs.
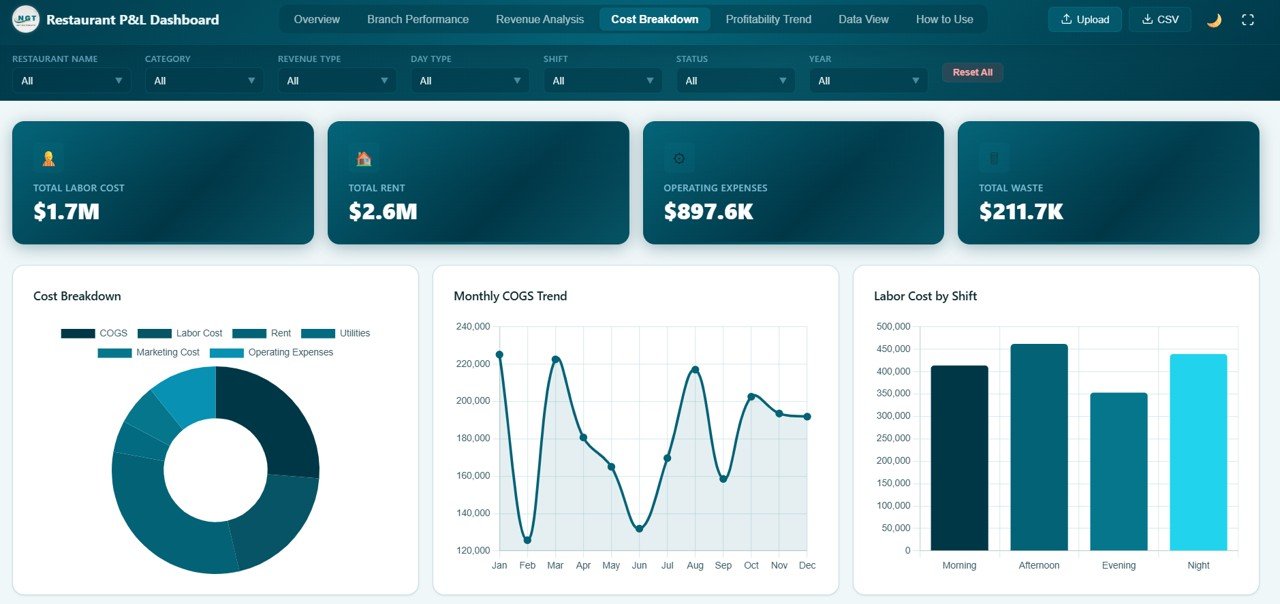
Cost Breakdown
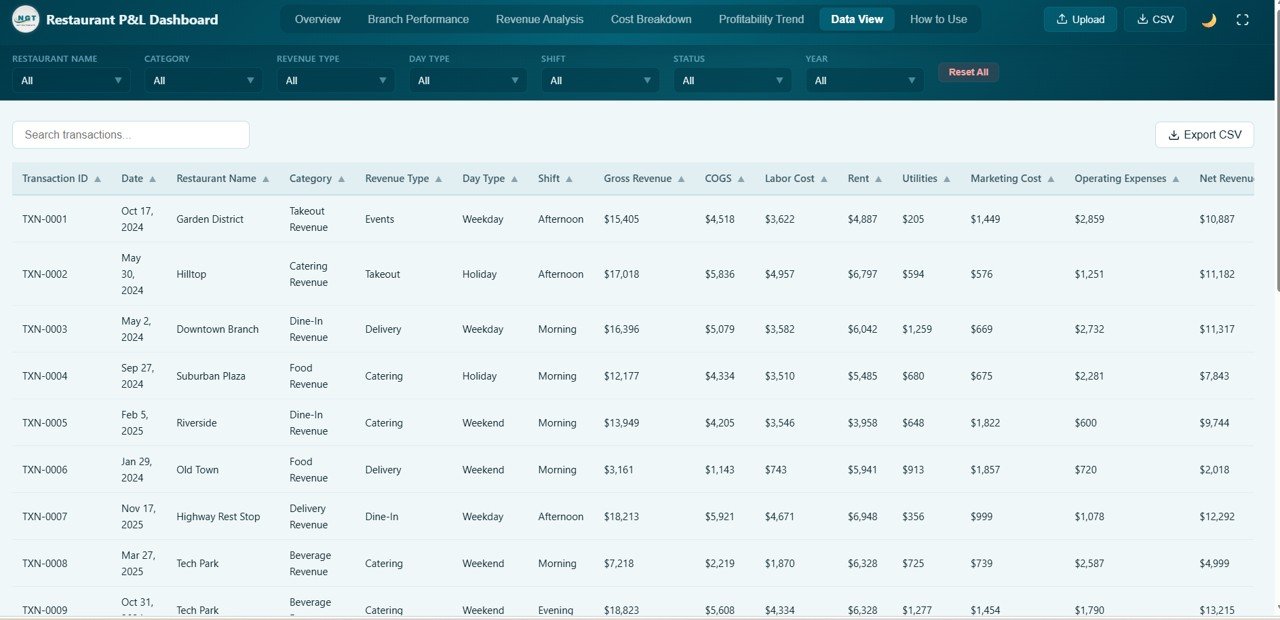
Data View
The Data View page is a detailed data table where you can see all your restaurant financial records in one place. It features search functionality to quickly find specific records, column sorting for organizing data by any field, pagination for easy navigation through large datasets, and CSV export capability so you can download filtered data for further analysis, accounting, or tax preparation. This page is particularly valuable for audits, compliance, and detailed financial record review.
Advantages of Restaurant Profit and Loss Dashboard in HTML
This dashboard eliminates the need for expensive BI software or complex spreadsheet management. Since it runs entirely in a web browser, it offers true zero-cost analytics with no recurring license fees. The interactive filters and charts provide real-time insights that static reports cannot match. The professional design is presentation-ready, making it suitable for sharing with investors, partners, or stakeholders. Because it covers 5 different analytical dimensions — overview, branch comparison, revenue deep-dive, cost analysis, and raw data exploration — it serves as a complete restaurant P&L analytics solution in one template. The dashboard is also fully customizable — replace the sample data with your own records and everything updates automatically.
Opportunities for Improvement
While this dashboard is comprehensive, there are areas where it could be enhanced further. Adding a dedicated Menu Performance page with item-level profitability analysis would provide granular menu engineering insights. Integration with POS systems or live data feeds could automate data refresh. Including forecast and trend projection capabilities for revenue and costs would support long-term planning. Additionally, adding a customer satisfaction or feedback analysis dimension could provide a more complete picture of restaurant performance beyond financial metrics.
Best Practices
To get the most out of this dashboard, keep your financial data up to date — ideally refreshing it weekly or monthly. Use the slicer filters strategically to compare performance across branches, shifts, and time periods. Review the Cost Breakdown page regularly to spot expense trends and optimize margins. Monitor the Branch Performance page to hold individual locations accountable to profitability targets. Export data from the Data View tab for presentations or to share with your accountant or financial advisor.
Explore Relevant Templates
If you are looking for similar dashboards in other platforms or industries, check out these related templates from NextGen Templates:
SaaS Metrics Dashboard in HTML – Track subscription revenue, customer health, and churn risk in a browser-based dashboard with 5 interactive pages.
Rental Property Investment Dashboard in HTML – Monitor rental portfolio value, ROI, occupancy, and financing risk with interactive visual analytics.
Personal Finance Dashboard in HTML – Track personal income, expenses, savings, and budgets in a browser-based HTML dashboard.
Food and Beverage Dashboard in Google Sheets – A Google Sheets alternative for food service analytics with dynamic charts and data tracking.
Catering Business KPI Dashboard in Google Sheets – Track catering KPIs including revenue, bookings, and customer satisfaction in Google Sheets.
Click here to Purchase Restaurant Profit and Loss Dashboard in HTML
Frequently Asked Questions
What is the best HTML dashboard template for tracking restaurant profit and loss?
The Restaurant Profit and Loss Dashboard in HTML from NextGen Templates is one of the best options available. It includes 5 interactive pages covering overview KPIs, branch performance, revenue analysis, cost breakdown, and a data explorer with CSV export — all in a professionally designed browser-based template that requires no software installation.
How many KPIs does the Restaurant Profit and Loss Dashboard in HTML track?
The dashboard tracks 6 key performance indicators on the Overview page: Total Gross Revenue, Total Net Revenue, Operating Profit, Total Covers, Avg Check Value, and Profitability Rate. It also includes 20+ analytical charts across revenue analysis, branch comparison, and cost breakdown pages.
Do I need any software to use this restaurant P&L dashboard?
No software is required. This dashboard runs entirely in your web browser. Simply unzip the downloaded file and open index.html in any modern browser like Chrome, Firefox, Edge, or Safari. There is no installation, plugins, or licenses needed.
Can I customize the data in this restaurant dashboard?
Yes. You can replace the sample data with your own restaurant financial records. Once updated, all charts, KPIs, filters, and the data table refresh automatically to reflect your actual business data.
Is this dashboard suitable for multi-branch restaurant chains?
Yes. The Branch Performance page is specifically designed for multi-location restaurant operators. It compares Total Revenue, Operating Profit, Labor Cost, Waste Amount, and Covers across all your restaurant branches side by side, making it easy to identify top and bottom performers.
Can I export data from this HTML dashboard?
Yes. The Data View tab includes a CSV export feature that lets you download filtered data for further analysis in Excel, Google Sheets, or any other spreadsheet application.
Conclusion
The Restaurant Profit and Loss Dashboard in HTML is a complete, professional, and interactive analytics solution for anyone managing restaurant finances. With 5 dedicated pages covering overview KPIs, branch performance comparison, revenue stream analysis, cost breakdown monitoring, and raw data exploration, it provides the clarity and depth that restaurant operators need to maximize profitability and control costs. The browser-based design means you can start analyzing immediately without any software costs or setup complexity.
Click here to Purchase Restaurant Profit and Loss Dashboard in HTML
Visit our YouTube channel for step-by-step video tutorials: Youtube.com/@NeoTechNavigators