Small Business CFO Dashboard in HTML is a browser-based interactive financial analytics template designed to help small business owners, CFOs, finance managers, and startup founders track Total Revenue, Total Expenses, Net Profit, Budget Variance, Accounts Receivable, and Accounts Payable from a centralized dashboard. This template includes 5 interactive dashboard pages covering Overview, Cash Flow Analysis, Department Spend, Payment and Vendor Analysis, and a detailed Data View tab — making it one of the most powerful HTML Dashboard Templates for small business financial management.Small Business CFO Dashboard in HTML
Whether you manage daily reconciliations, monthly reporting, or quarterly budgets, this dashboard transforms complex financial data into clear, visual, and actionable insights. Instead of juggling scattered spreadsheets, you get one centralized command center that monitors revenue trends, cash flow patterns, department spending, vendor payments, and budget variances — all in real time.
👉 Click here to Purchase Small Business CFO Dashboard in HTML
Key Features of Small Business CFO Dashboard in HTML
The Small Business CFO Dashboard in HTML includes 5 interactive dashboard pages, 6 KPI cards, 16 dynamic charts, multiple slicers, and a searchable data view with CSV export. It is a comprehensive financial monitoring solution that requires no software installation — just open it in any web browser.
- 6 KPI Cards — Total Revenue, Total Expenses, Net Profit, Budget Variance, Accounts Receivable, and Accounts Payable displayed prominently on the Overview page
- 5 Dashboard Pages — Overview, Cash Flow Analysis, Department Spend, Payment & Vendor Analysis, and Data View
- 16 Interactive Charts — Revenue trends, expense breakdowns, cash flow patterns, department comparisons, vendor analysis, and payment status insights
- Interactive Slicers — Filter by department, category, vendor, payment method, and time period across all pagesSmall Business CFO Dashboard in HTML
- Data View with Export — Search, sort, paginate, and export your complete financial dataset to CSV
- Browser-Based — No Excel, no Power BI, no installation — runs in Chrome, Firefox, or Edge instantly
Dashboard Pages Explained
1. Overview Page
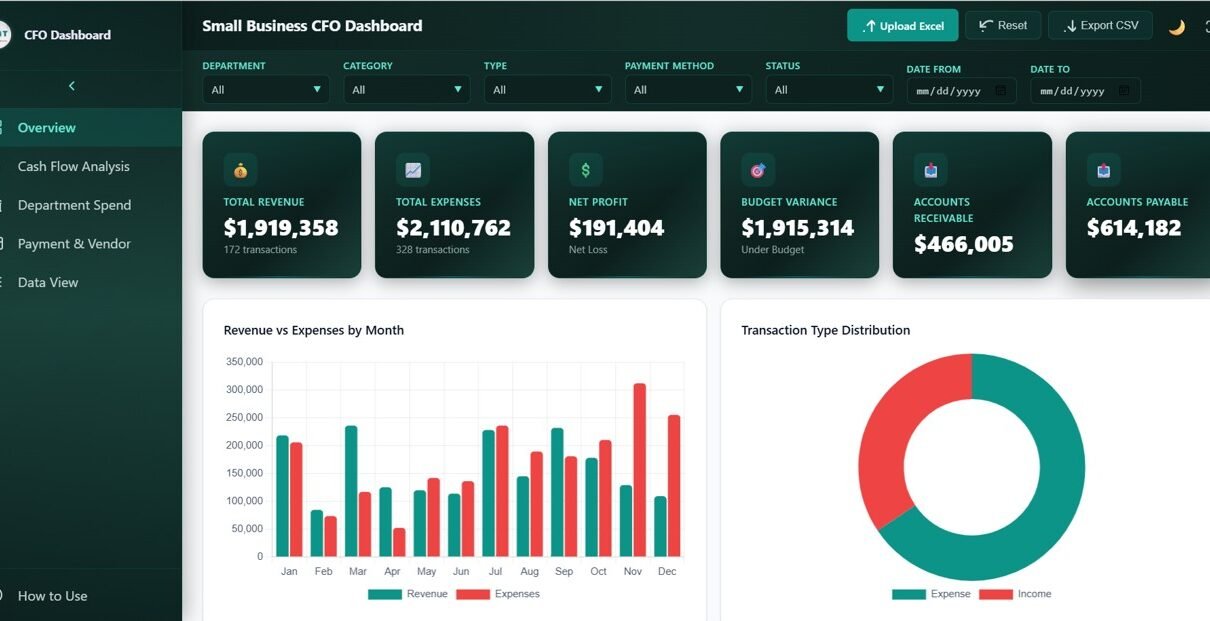
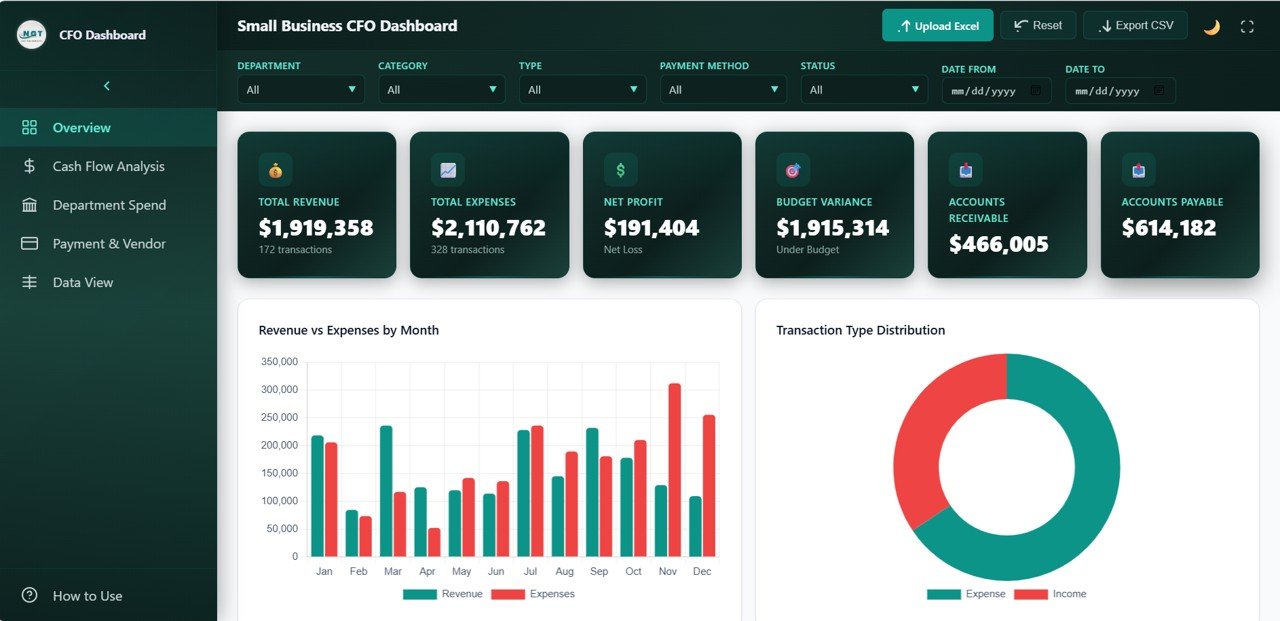
The Overview page serves as the financial command center. At the top, 6 KPI cards display Total Revenue, Total Expenses, Net Profit, Budget Variance, Accounts Receivable, and Accounts Payable. These cards give CFOs and business owners an instant snapshot of overall financial health.
Below the KPI cards, 4 interactive charts provide deeper analysis. The Revenue and Expenses by Month chart tracks income versus spending trends over time. The Transaction Type Distribution chart shows how transactions are categorized across the business. The Payment Status Breakdown chart reveals the proportion of completed, pending, and overdue payments. The Top Departments by Cost chart identifies which departments consume the most resources. Multiple slicers allow users to filter the entire dashboard by various dimensions for targeted analysis.
2. Cash Flow Analysis
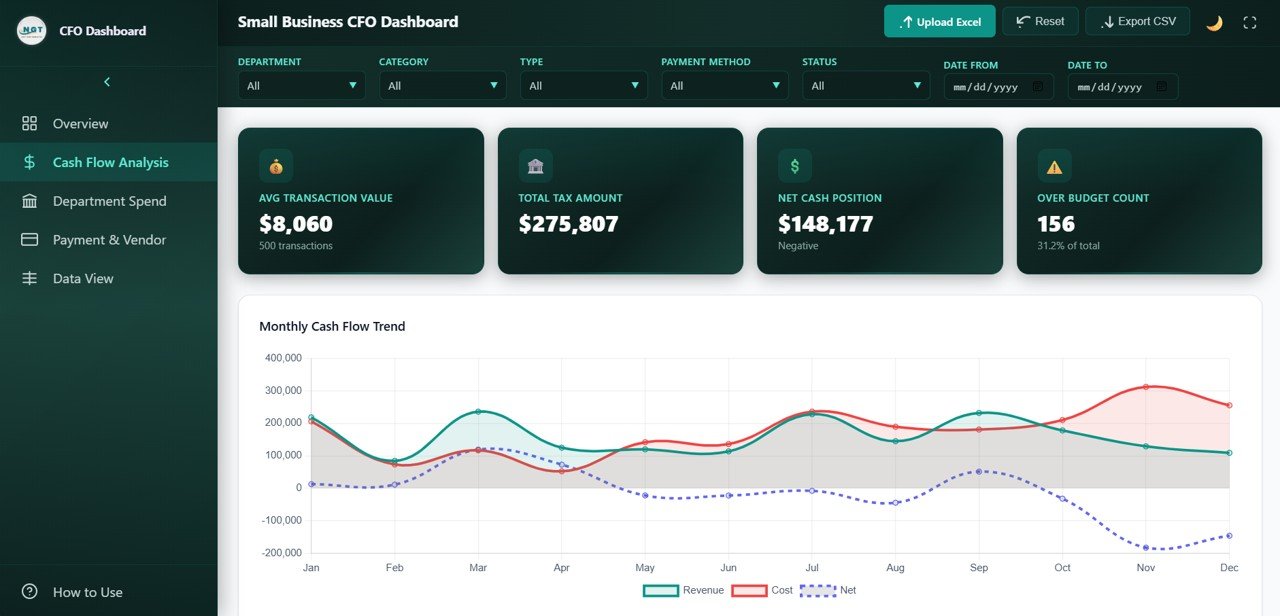
The Cash Flow Analysis page focuses entirely on money movement within the business. It features 4 targeted charts that help finance teams understand exactly how cash flows in and out. The Monthly Cash Flow Trend chart displays net cash flow patterns month by month, helping identify seasonal trends and potential liquidity issues. Revenue by Category breaks down income into distinct sources so managers can see which categories drive the most revenue. Cost by Category reveals where expenses concentrate, enabling targeted cost reduction. Accounts Receivable vs Payable by Month compares what customers owe you against what you owe vendors, providing critical working capital insights.
3. Department Spend
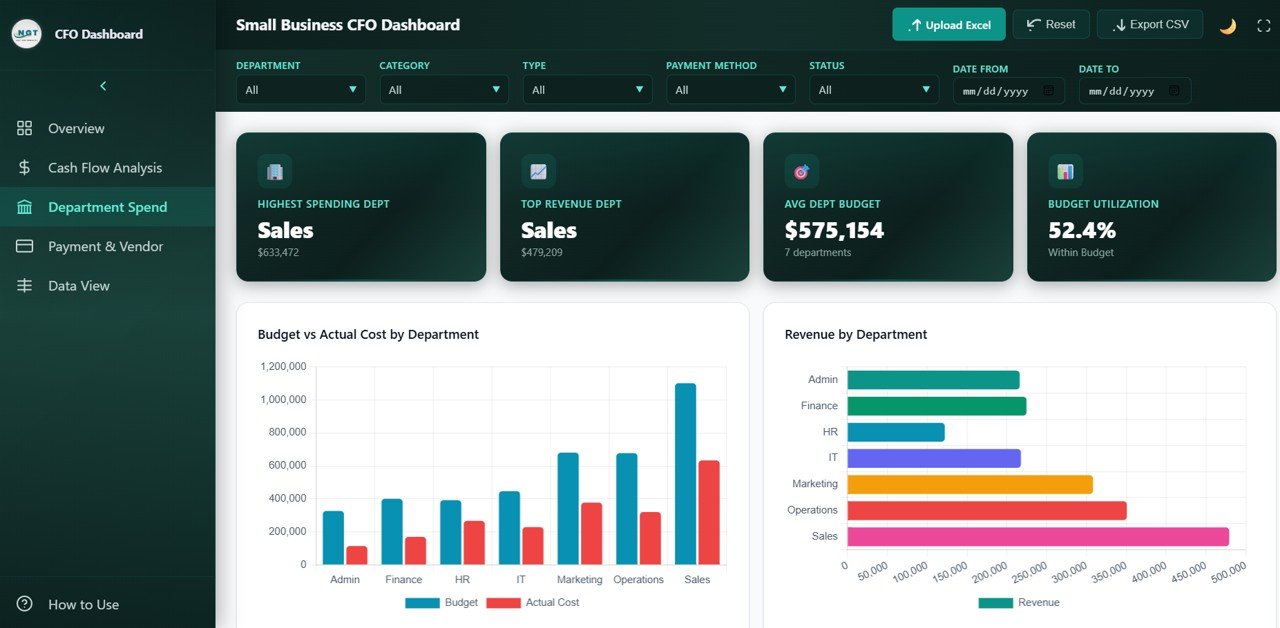
The Department Spend page breaks down financial performance at the departmental level through 4 insightful charts. Budget vs Actual Cost by Department compares planned spending against real expenditures for each department, instantly highlighting departments that are over or under budget. Revenue by Department shows which teams generate the most income. Transaction Count by Department reveals the volume of financial activity per department. Over Budget Rate by Department flags departments that consistently exceed their allocated budgets, enabling proactive cost management.
4. Payment and Vendor Analysis
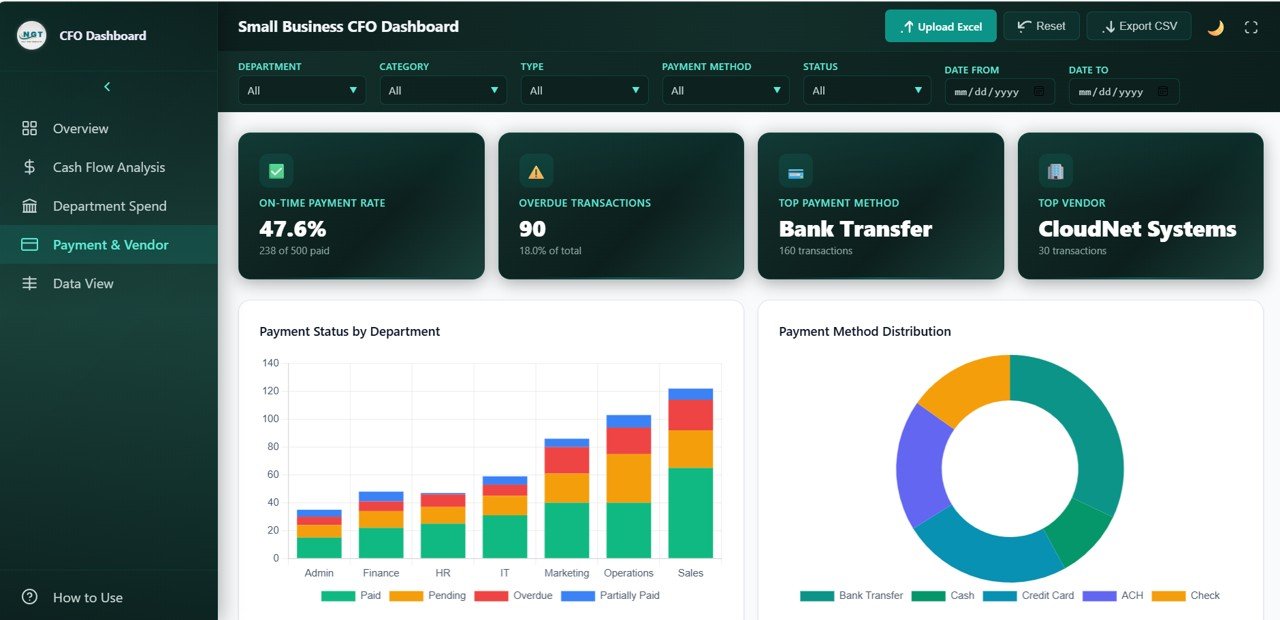
The Payment and Vendor Analysis page evaluates payment operations and vendor relationships through 4 key charts. Payment Status by Department shows the approval and completion rates of payments across teams. Payment Method Distribution analyzes how transactions are processed — by card, bank transfer, cash, or other methods. Top 10 Vendors by Transaction Volume identifies the most active vendors your business works with. Overdue Amounts by Department highlights which departments have the most delayed payments, helping finance teams prioritize collections and follow-ups.
5. Data View
The Data View tab is a detailed data table page where you can see all your financial records with search, sort, and pagination features. This is particularly useful for finance teams who need to drill down into individual transactions. The built-in CSV export functionality allows you to download filtered data for further analysis in Excel or other tools. This page essentially acts as your financial transaction ledger within the dashboard.
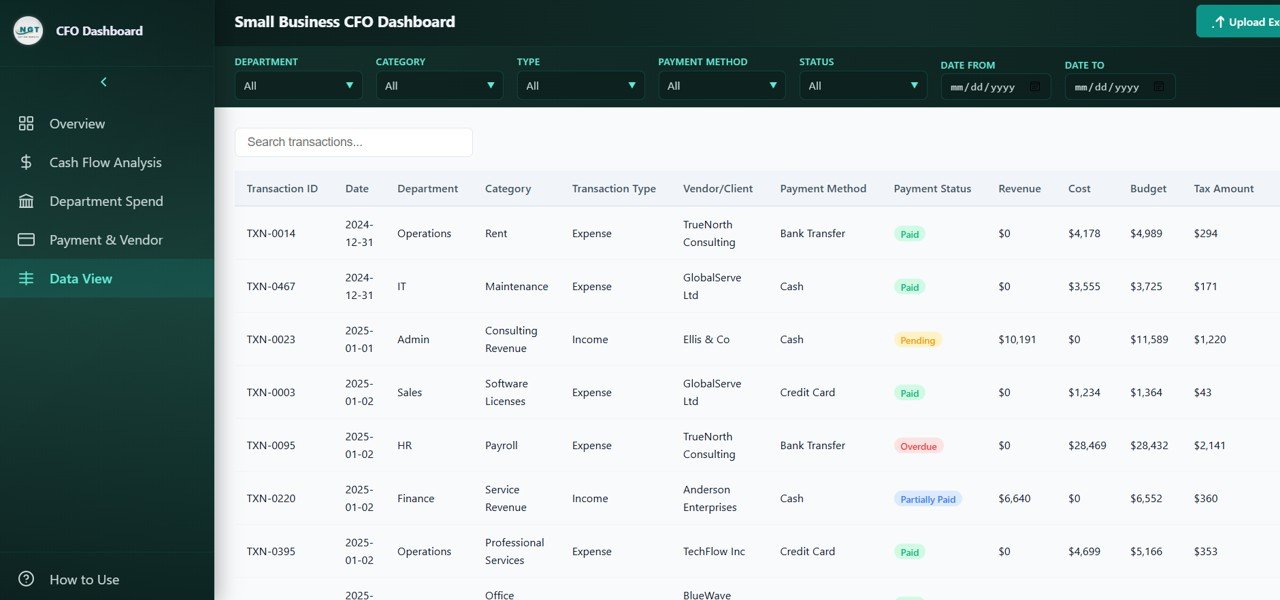
Data View Tab
Advantages of Small Business CFO Dashboard in HTML
- Zero Software Dependencies — Runs in any modern web browser without installing Excel, Power BI, or any other application
- Instant Financial Visibility — 6 KPI cards and 16 charts give you a complete financial picture within seconds of opening the dashboard
- Department-Level Accountability — Pinpoint exactly which departments are overspending, underperforming, or generating the most revenue
- Vendor Management — Track your top vendors, payment methods, and overdue amounts to strengthen supplier relationships
- Data Export — The Data View tab lets you search, sort, and export transaction records to CSV for further analysis
- Fully Customizable — Replace the sample data with your own business data and the entire dashboard updates automatically
Opportunities for Improvement
- Adding date range selectors on each page would enhance time-based filtering capabilities
- A forecasting module could help predict future cash flow trends based on historical data
- Integration with accounting software APIs could automate data refresh for real-time monitoring
- Adding a printable PDF export option would make it easier to share reports with stakeholders offline
Best Practices
- Update your data file at least weekly to maintain accurate and current financial insights
- Use the slicers on each page to focus analysis on specific departments, categories, or time periods
- Monitor the Budget Variance and Over Budget Rate charts regularly to catch overspending early
- Review the Accounts Receivable vs Payable chart monthly to ensure healthy working capital
- Export data from the Data View tab before quarterly reviews for detailed record-level analysis
- Compare this dashboard alongside the Excel version if your team prefers working within Microsoft Excel
- Click to buy Small Business CFO Dashboard in HTML
Explore Relevant Templates
- Small Business CFO Dashboard in Excel — The same CFO dashboard built in Excel with pivot tables, slicers, and automated charts
- Finance and Accounting Dashboard in Google Sheets — Cloud-based budget, forecast, and variance tracking
- Financial Transactions Dashboard in Google Sheets — Track revenue, expenses, approvals, and transaction trends
- Finance & Accounting Command Center Bundle — 8 premium finance templates in Excel, Power BI, and Google Sheets at 46% savings
- Fintech Dashboard in Power BI — Track lending, risk, revenue, and customer growth in an interactive Power BI dashboard
Frequently Asked Questions
What is the best HTML dashboard template for tracking small business finances?
The Small Business CFO Dashboard in HTML is one of the best options available. It includes 5 interactive pages covering overview KPIs, cash flow analysis, department spending, payment and vendor management, and a detailed data view with CSV export. It tracks 6 critical financial KPIs and runs in any web browser without requiring software installation.
How do I customize this HTML dashboard for my business?
Simply replace the sample data in the included data file with your own business financial data. The dashboard automatically updates all 5 pages, 6 KPI cards, and 16 charts based on the data you provide. You can modify department names, expense categories, vendor lists, and payment methods to match your business structure.
Can I use this dashboard on a Mac or Linux computer?
Yes. Since the dashboard is an HTML file that runs in a web browser, it works on any operating system including Windows, macOS, Linux, and ChromeOS. Just open the index.html file in Chrome, Firefox, Edge, or Safari.
What financial KPIs does this CFO dashboard track?
The dashboard tracks 6 primary KPIs on the Overview page: Total Revenue, Total Expenses, Net Profit, Budget Variance, Accounts Receivable, and Accounts Payable. Additional metrics are tracked across dedicated pages including cash flow trends, department spending analysis, vendor transaction volumes, and payment status breakdowns.
Is this dashboard suitable for startups and freelancers?
Absolutely. The Small Business CFO Dashboard in HTML is designed for any organization that needs to monitor financial health — from solo freelancers tracking income and expenses to growing startups managing department budgets and vendor payments. The plug-and-play data file makes setup quick and easy regardless of business size.
Conclusion
The Small Business CFO Dashboard in HTML is a powerful, browser-based financial analytics solution that gives small business owners, CFOs, and finance managers complete visibility into revenue, expenses, cash flow, department spending, vendor payments, and budget performance. With 5 interactive pages, 6 KPI cards, 16 dynamic charts, and a searchable data view with CSV export, it delivers enterprise-grade financial insights without requiring any software installation.
👉 Click here to Purchase Small Business CFO Dashboard in HTML
🎥 Visit our YouTube channel for step-by-step tutorials: Youtube.com/@NeoTechNavigators