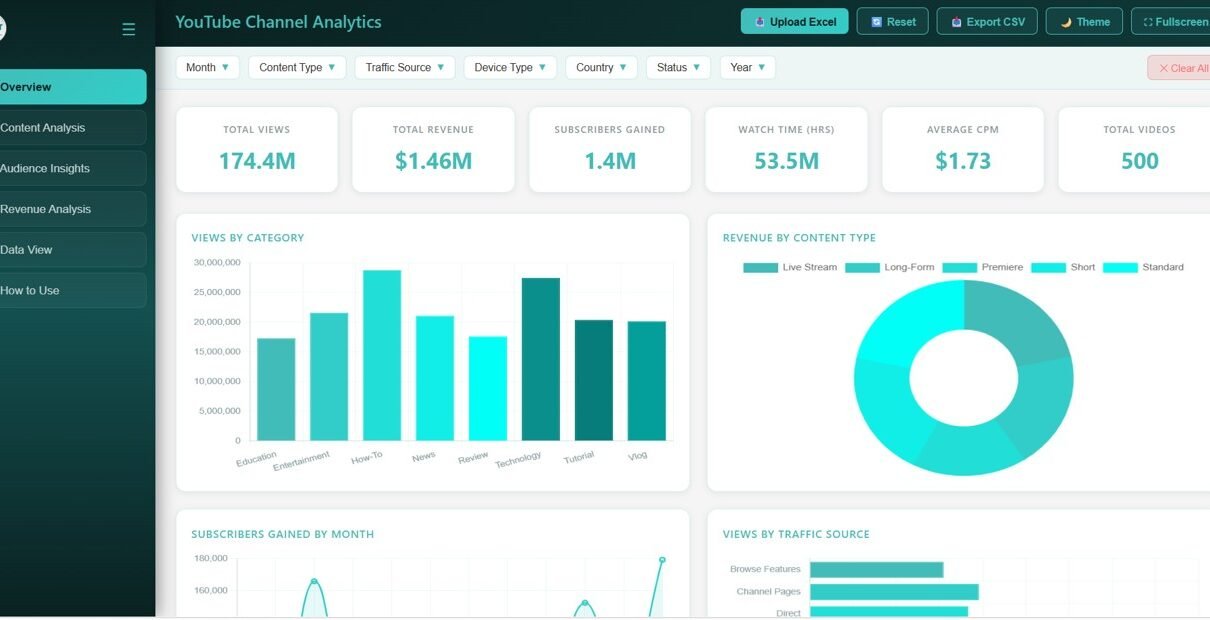
The YouTube Channel Analytics Dashboard in HTML turns an export of your video data into a five-page report on views, subscribers, engagement, audience and revenue. It is made for YouTube creators, social media managers and agencies who want one clear view of channel performance that they can filter, share and export, without jumping between screens in YouTube Studio.
The dashboard runs as an index.html file in any modern browser, with nothing to install. It has five pages (Overview, Content Analysis, Audience Insights, Revenue Analysis and Data View), KPI cards at the top of each analysis page, about 20 charts, seven global filters and a searchable video table with CSV export.
🎥 Watch the Video Tutorial
Get the YouTube Channel Analytics Dashboard
Why Build Your Own YouTube Analytics Dashboard?
YouTube Studio is good at telling you how one video or one week performed. It is less helpful when you want to compare content types, see which categories earn the best CPM, or hand a client a single report that covers views, audience and revenue together. Most creators end up exporting data and building charts by hand.
This dashboard removes that step. Each row in the data is one video with its category, content type, views, likes, comments, shares, subscribers and revenue fields. The template rolls them up into cards and charts that you can filter by month, content type, traffic source, device, country, status and year.
Key Metrics in the YouTube Channel Analytics Dashboard in HTML
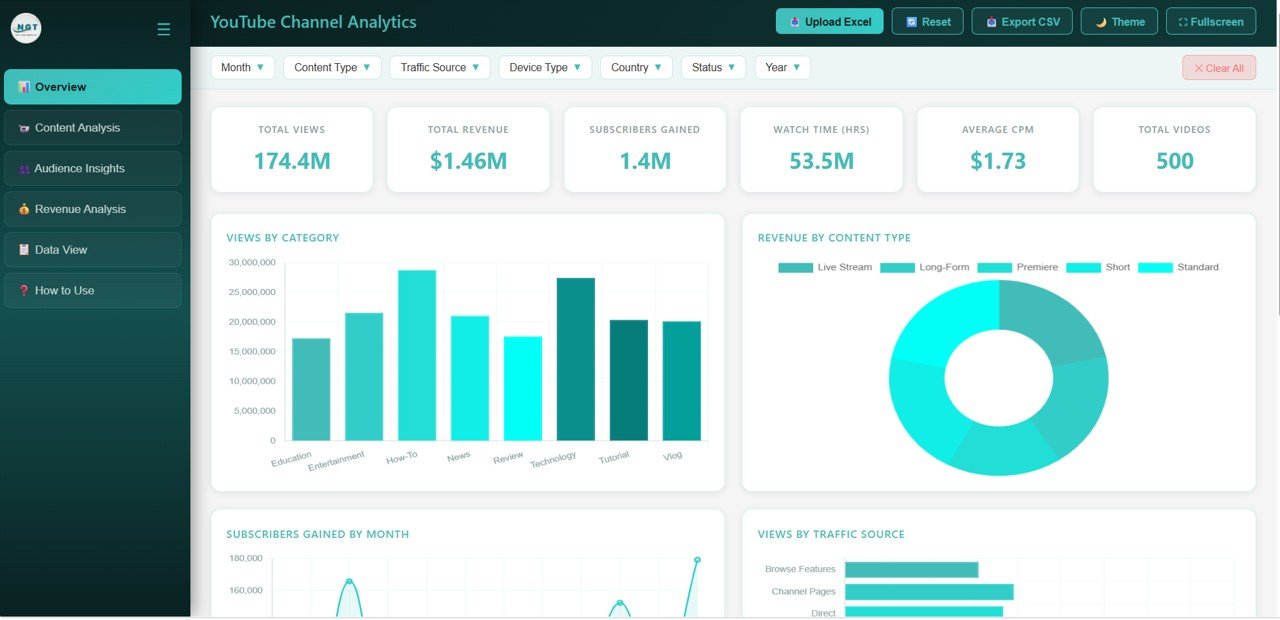
The values below come from the included sample data of 500 videos, with no filters applied.
| Page | KPI card | Sample value | What it tells you |
|---|---|---|---|
| Overview | Total Views | 174.4M | All views across the videos in view |
| Overview | Total Revenue | $1.46M | Total earnings recorded for those videos |
| Overview | Subscribers Gained | 1.4M | New subscribers attributed to the videos |
| Overview | Watch Time (Hrs) | 53.5M | Total hours watched |
| Overview | Average CPM | $1.73 | Average revenue per thousand impressions |
| Overview | Total Videos | 500 | Number of videos in the data |
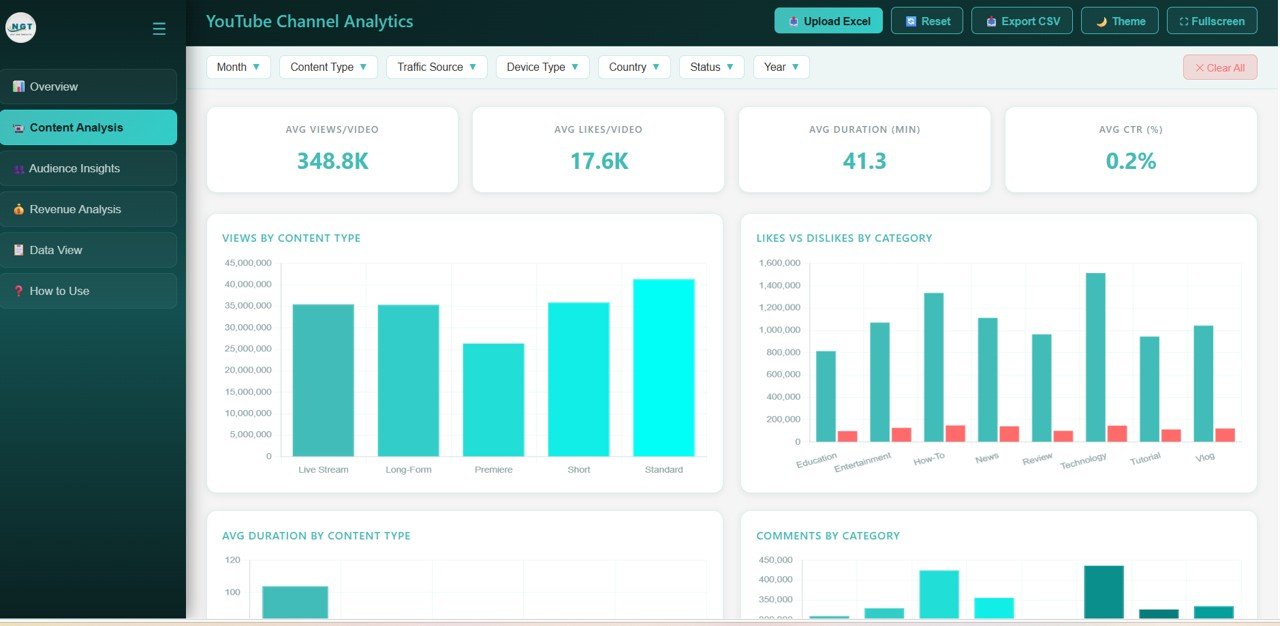
| Content Analysis | Avg Views/Video | 348.8K | Total Views ÷ Total Videos (174.4M ÷ 500) |
| Content Analysis | Avg Likes/Video, Avg Duration (Min), Avg CTR (%) | 17.6K, 41.3, 0.2% | Typical engagement and length per video |
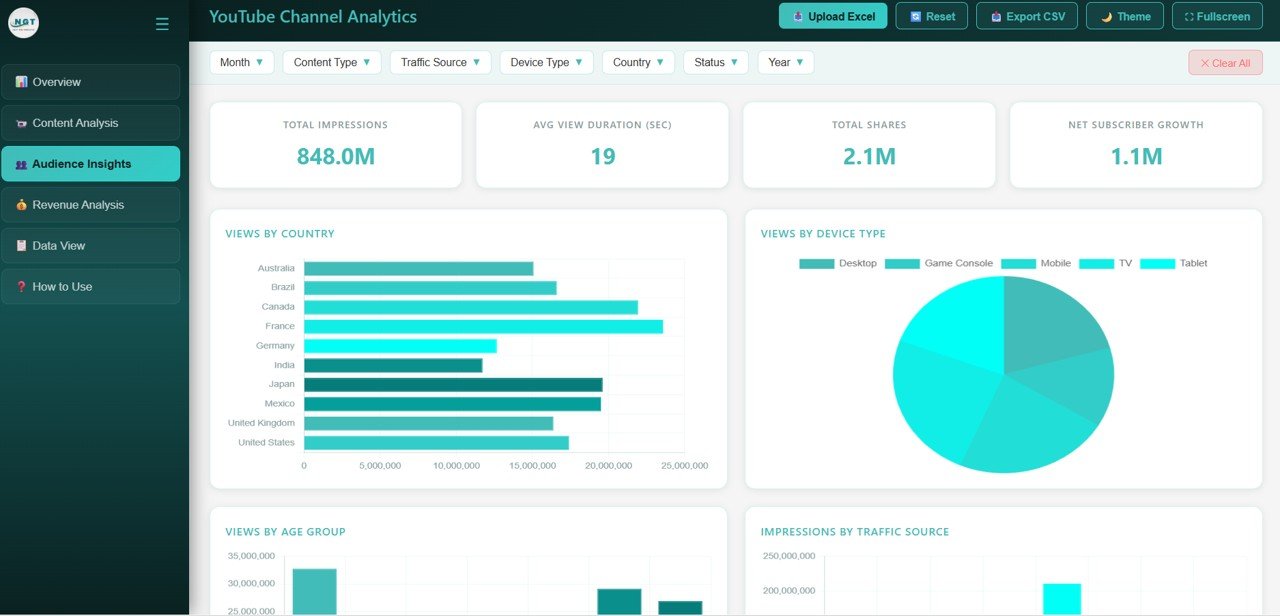
| Audience Insights | Total Impressions, Avg View Duration (Sec), Total Shares, Net Subscriber Growth | 848.0M, 19, 2.1M, 1.1M | Reach, attention, sharing and real subscriber growth |
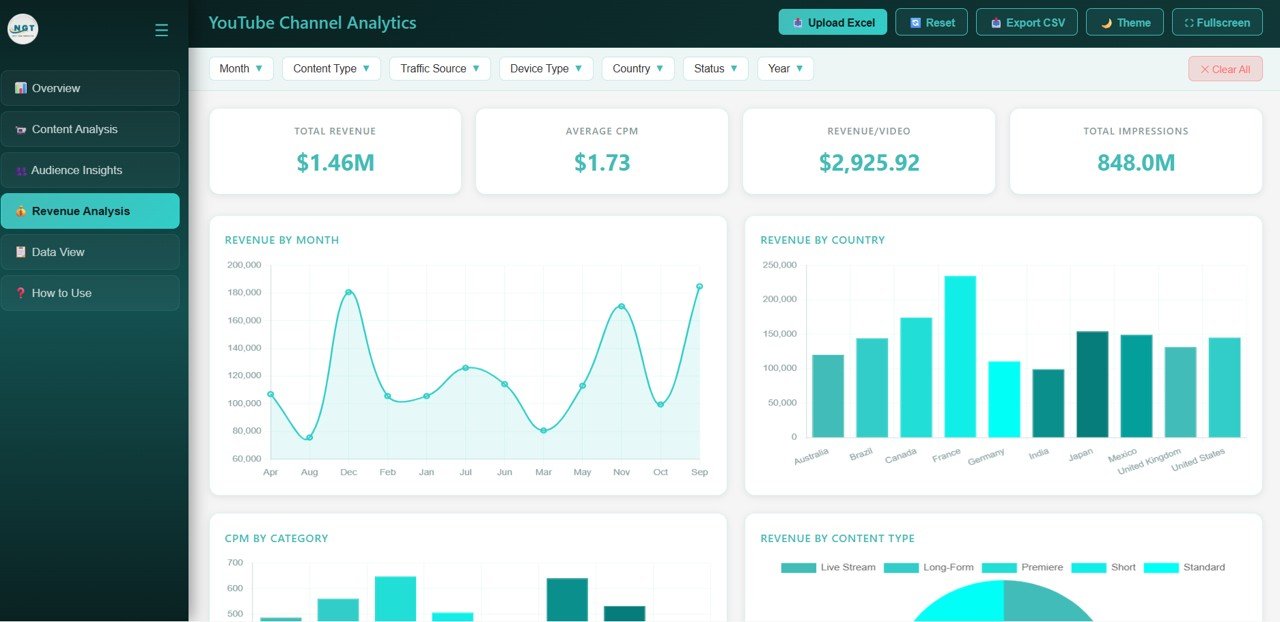
| Revenue Analysis | Revenue/Video | $2,925.92 | Total Revenue ÷ Total Videos |
Two of the cards are simple ratios you can check yourself: 174.4M views ÷ 500 videos gives the 348.8K Avg Views/Video, and $1.46M ÷ 500 gives roughly the $2,925.92 Revenue/Video.
Filters and Toolbar
Seven dropdown filters run across the top of every page: Month, Content Type, Traffic Source, Device Type, Country, Status and Year, plus a Clear All button. The header has Upload Excel, Reset, Export CSV, Theme and Fullscreen buttons, and the side menu includes a How to Use page.
Dashboard Pages Explained
1. Overview
After the six KPI cards, the Overview shows Views by Category across Education, Entertainment, How-To, News, Review, Technology, Tutorial and Vlog, and a Revenue by Content Type donut for Live Stream, Long-Form, Premiere, Short and Standard videos. Below are Subscribers Gained by Month, Views by Traffic Source and a Status Distribution chart. In the sample, How-To and Technology are the most-viewed categories.
2. Content Analysis
This page shows what kind of content works. Views by Content Type compares the five formats, with Standard videos leading in the sample. Likes vs Dislikes by Category shows audience reaction for each category, with Technology drawing the most likes. The page also includes Avg Duration by Content Type, Comments by Category and Revenue by Category.
3. Audience Insights
Here you see who is watching and how they find you. Views by Country covers Australia, Brazil, Canada, France, Germany, India, Japan, Mexico, the United Kingdom and the United States, with France highest in the sample. Views by Device Type splits viewing across Desktop, Game Console, Mobile, TV and Tablet. Further down are Views by Age Group, Impressions by Traffic Source and Shares by Country.
4. Revenue Analysis
The revenue page opens with Total Revenue, Average CPM, Revenue/Video and Total Impressions. Revenue by Month shows the earnings curve across the year; in the sample, December and September are the strongest months and August the weakest. Revenue by Country again puts France on top. The page also has CPM by Category, Revenue by Content Type and Revenue by Year.
5. Data View
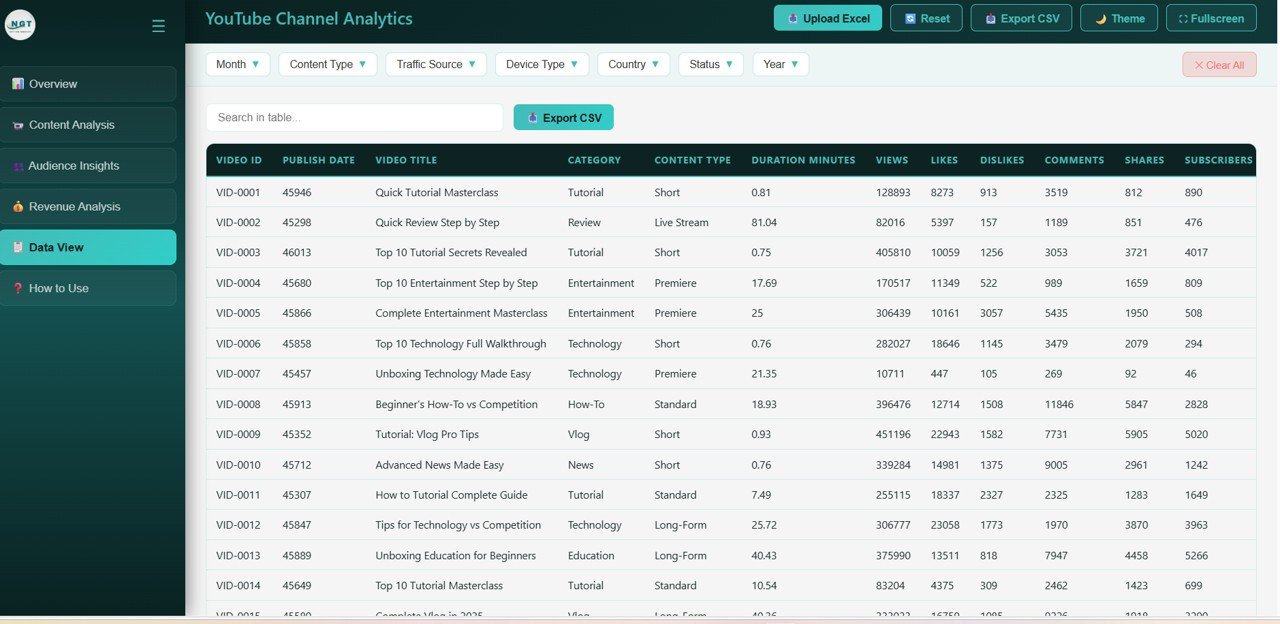
The Data View lists every video with a Search in table box and its own Export CSV button. Visible columns include Video ID, Publish Date, Video Title, Category, Content Type, Duration Minutes, Views, Likes, Dislikes, Comments, Shares and Subscribers. Use it to find the exact videos behind a spike in a chart.
How to Use It with Your Own Channel Data
- Unzip the download and open index.html in Chrome, Edge, Firefox or Safari. The sample data loads first.
- In YouTube Studio, go to Analytics > Advanced mode, choose your date range and export the video-level table.
- Arrange your export to match the template’s columns (see the Data View list above and the included sample file). Add your own category and content-type labels if YouTube does not provide them.
- Load the file with Upload Excel, or replace the sample data file, as explained on the dashboard’s How to Use page.
- Check that Total Videos and Total Views match YouTube Studio for the same period.
- Use the filters to compare months, formats or countries, and click Clear All to go back to the full view.
- Use Export CSV when you need the video-level numbers in a spreadsheet for a sponsor or client report.
If you want to build similar summaries yourself in a spreadsheet, the Excel Pivot Tables and Dashboards course on NextGenTemplates Academy teaches the same grouping and charting ideas step by step.
Real-World Use Cases
- Solo creator planning content: filter to the last six months, compare views and revenue by content type, and decide whether to make more Shorts or more long-form videos.
- Agency reporting to clients: load each client’s export, filter to the reporting month and share the CSV and screenshots in a monthly report.
- Sponsorship pitch: use the Audience Insights page to show a brand where your viewers are and which devices they use, backed by the country and device charts.
Best Practices
- Export the same fields every time. Consistent columns keep the charts comparable from month to month.
- Label categories yourself. A clear, short list of categories (for example Tutorial, Review, Vlog) makes the category charts far more useful.
- Look at revenue per video, not just total revenue. One viral video can hide a weak month.
- Compare CPM with views. A category with fewer views but higher CPM may deserve more of your time.
- Refresh monthly. A regular export rhythm turns the dashboard into a running history of your channel.
Limitations: Who Should Not Use It
The dashboard does not connect to the YouTube API, so it does not update itself. You load a fresh export when you want new numbers. It reports on the data you give it and cannot see YouTube metrics you do not export. Very small channels with a handful of videos may get just as much from YouTube Studio itself. Networks managing hundreds of channels with automated feeds will be better served by a tool with an API connection or by Power BI.
Related Dashboards and Guides
For KPI tracking against targets, see the Content Creator KPI Dashboard in Google Sheets. To report across several platforms, try the Social Media Performance Dashboard in Google Sheets. If you work with brands, the Influencer Marketing KPI Dashboard is useful, and for paid campaigns there is the Digital Marketing Campaign Dashboard in HTML. To plan what to publish next, pair it with a content planning calendar in Google Sheets.
Related templates: if you prefer another tool, there is also a YouTube Channel Analytics Dashboard in Power BI and a YouTube Channel Analytics Dashboard in Excel.
Frequently Asked Questions
Do I need any software to use the YouTube Channel Analytics Dashboard in HTML?
No. Open index.html in a modern browser. There is nothing to install and no login.
Does it connect directly to my YouTube account?
No. You export your data from YouTube Studio and load it into the dashboard. That means there is no API key or account connection to set up.
Which filters can I use?
Month, Content Type, Traffic Source, Device Type, Country, Status and Year. They apply across the pages, and Clear All resets them.
How is Revenue/Video calculated?
It divides total revenue by the number of videos in view. In the sample, $1.46M across 500 videos gives about $2,925.92 per video.
Can agencies use it for several channels?
Yes. Load one channel’s export at a time, or add a channel label to your data if you want to combine them, then use filters and CSV export to build client reports.
Is my channel data uploaded anywhere?
The dashboard is a set of files you open locally in your browser; it does not need a server, a login or a connection to your YouTube account. Keep your copy and any exported files somewhere secure if they contain revenue figures.
Wrapping Up
The YouTube Channel Analytics Dashboard in HTML gives you one place to see what your channel earns, who watches and which content works. Export your data each month, load it into the dashboard and use the Content Analysis and Revenue Analysis pages to decide what to make next.
Get the YouTube Channel Analytics Dashboard
📅 Last updated: October 2026