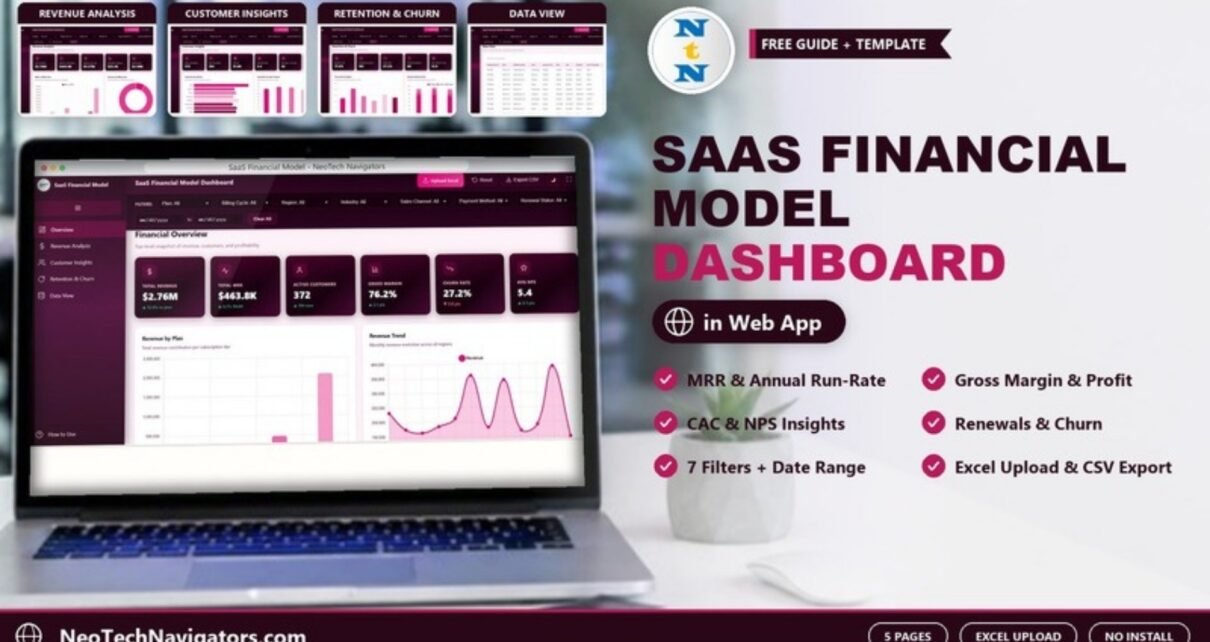
The SaaS Financial Model Dashboard in HTML is a browser-based dashboard that turns your subscription transactions into the numbers SaaS founders, CFOs and investors ask for: total revenue, MRR, annual run-rate, gross margin, customer acquisition cost, NPS, renewals and churn. It opens in Chrome, Edge, Firefox or Safari, with nothing to install.
It is built for SaaS founders, finance leads, RevOps and customer success managers who need a clear monthly or board-ready view without building a BI model. Inside you get five pages (Overview, Revenue Analysis, Customer Insights, Retention & Churn and Data View), seven drop-down filters plus a date range, an Upload Excel button for your own data, Export CSV, Reset, a dark-mode toggle and a full-screen button.
🎥 Watch the Video Tutorial
Get the SaaS Financial Model Dashboard
What Problem Does a SaaS Financial Dashboard Solve?
Subscription businesses produce a lot of rows: every invoice, plan change, renewal and cancellation. Billing tools show transactions, but they rarely answer the questions a founder or board asks in one view. How much recurring revenue do we have? Which plan carries the business? Are we keeping customers? What does it cost to win one?
This dashboard reads a transaction-level table and summarises it across plans, billing cycles, regions, industries, sales channels, payment methods and renewal status. Change any filter and every card and chart on every page recalculates.
Filters and Controls
The filter bar at the top contains Plan, Billing Cycle, Region, Industry, Sales Channel, Payment Method and Renewal Status, plus a from/to date range and a Clear All button. The sample data uses four plans (Starter, Professional, Business and Enterprise) and two billing cycles (Monthly and Annual).
The Five Dashboard Pages Explained
1. Overview (Financial Overview)
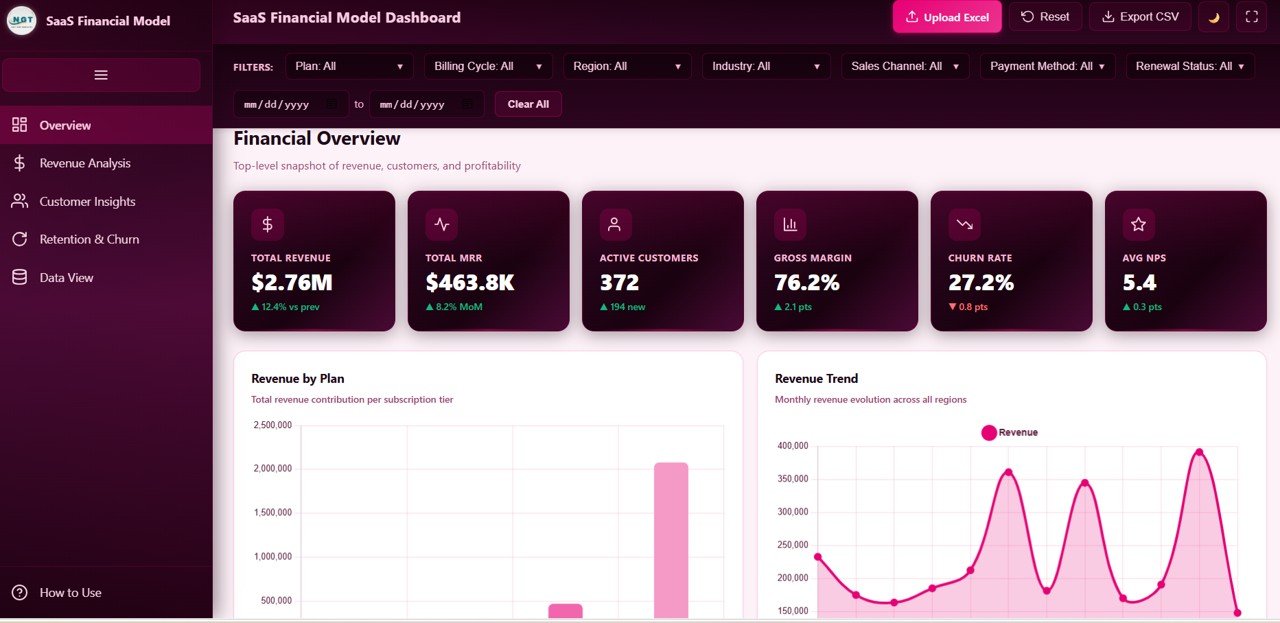
The Overview page gives a top-level snapshot. Its six cards show, in the sample data, Total Revenue $2.76M (12.4% vs previous period), Total MRR $463.8K (8.2% month on month), Active Customers 372 (194 new), Gross Margin 76.2%, Churn Rate 27.2% and Avg NPS 5.4. Below them, Revenue by Plan shows the contribution of each subscription tier and Revenue Trend tracks monthly revenue.
2. Revenue Analysis
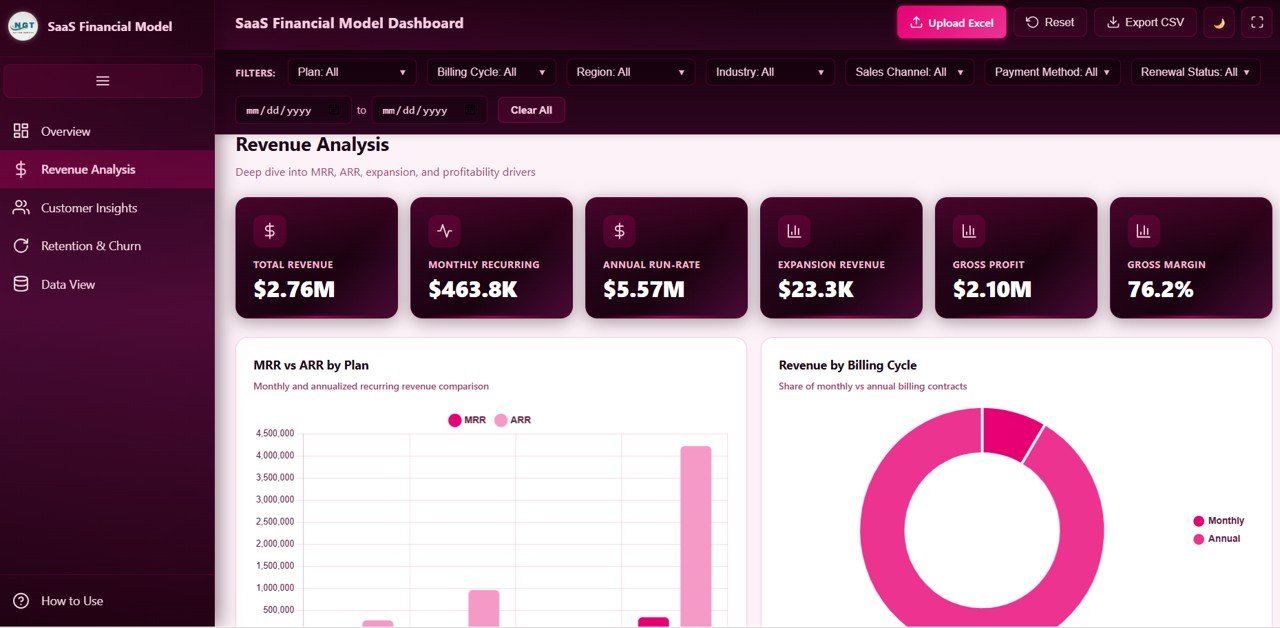
This page digs into MRR, ARR, expansion and profitability. Cards show Total Revenue $2.76M, Monthly Recurring $463.8K, Annual Run-Rate $5.57M, Expansion Revenue $23.3K, Gross Profit $2.10M and Gross Margin 76.2%. Charts include MRR vs ARR by Plan and Revenue by Billing Cycle, which in the sample is dominated by annual contracts.
3. Customer Insights
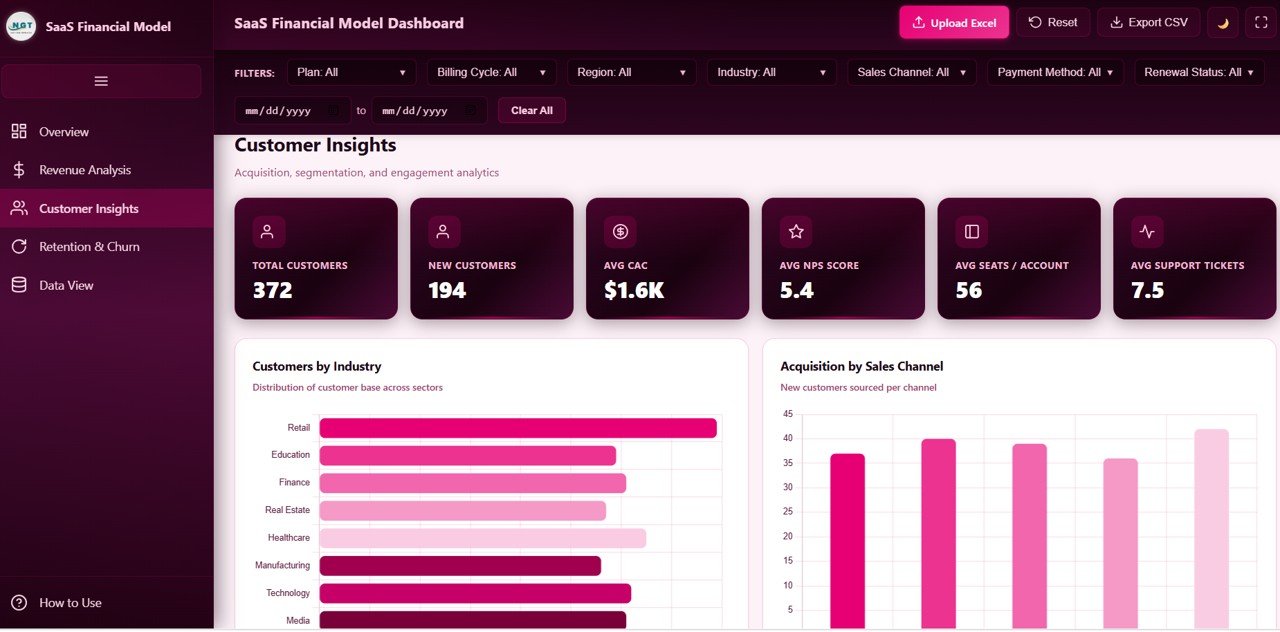
Customer Insights covers acquisition and engagement. Cards show Total Customers 372, New Customers 194, Avg CAC $1.6K, Avg NPS Score 5.4, Avg Seats / Account 56 and Avg Support Tickets 7.5. Customers by Industry compares Retail, Education, Finance, Real Estate, Healthcare, Manufacturing, Technology and Media, and Acquisition by Sales Channel shows new customers per channel.
4. Retention & Churn
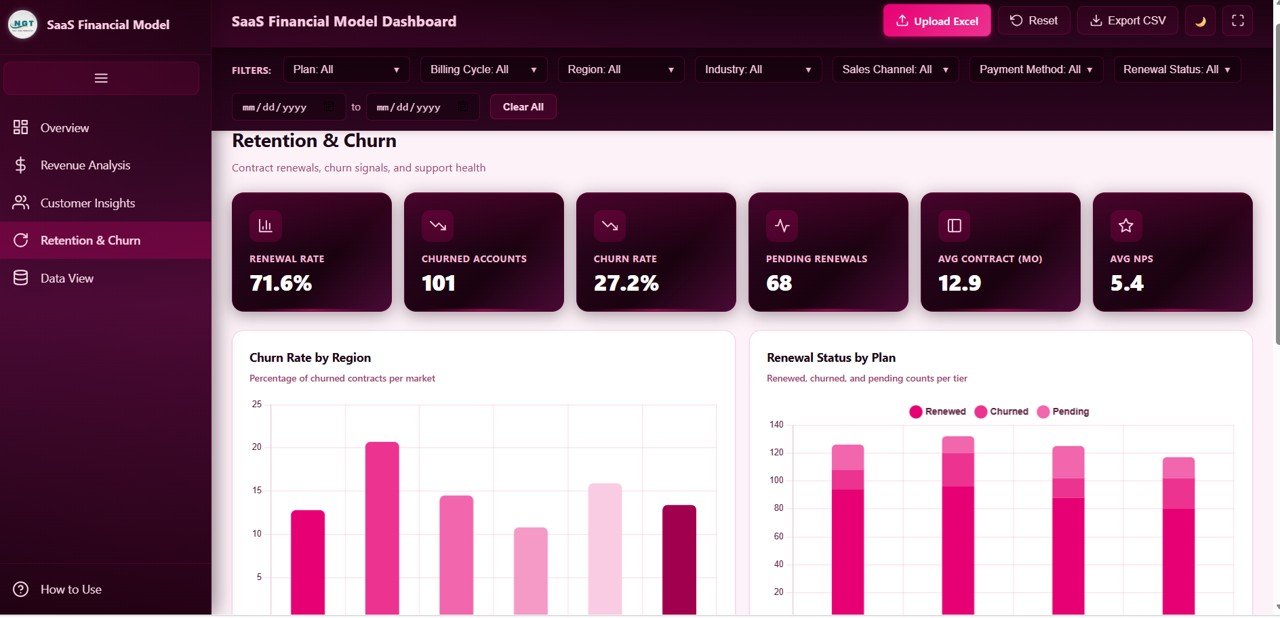
The retention page tracks contract renewals, churn and support health. Cards show Renewal Rate 71.6%, Churned Accounts 101, Churn Rate 27.2%, Pending Renewals 68, Avg Contract (Mo) 12.9 and Avg NPS 5.4. Churn Rate by Region compares churn across markets, and Renewal Status by Plan stacks Renewed, Churned and Pending counts for each tier.
5. Data View
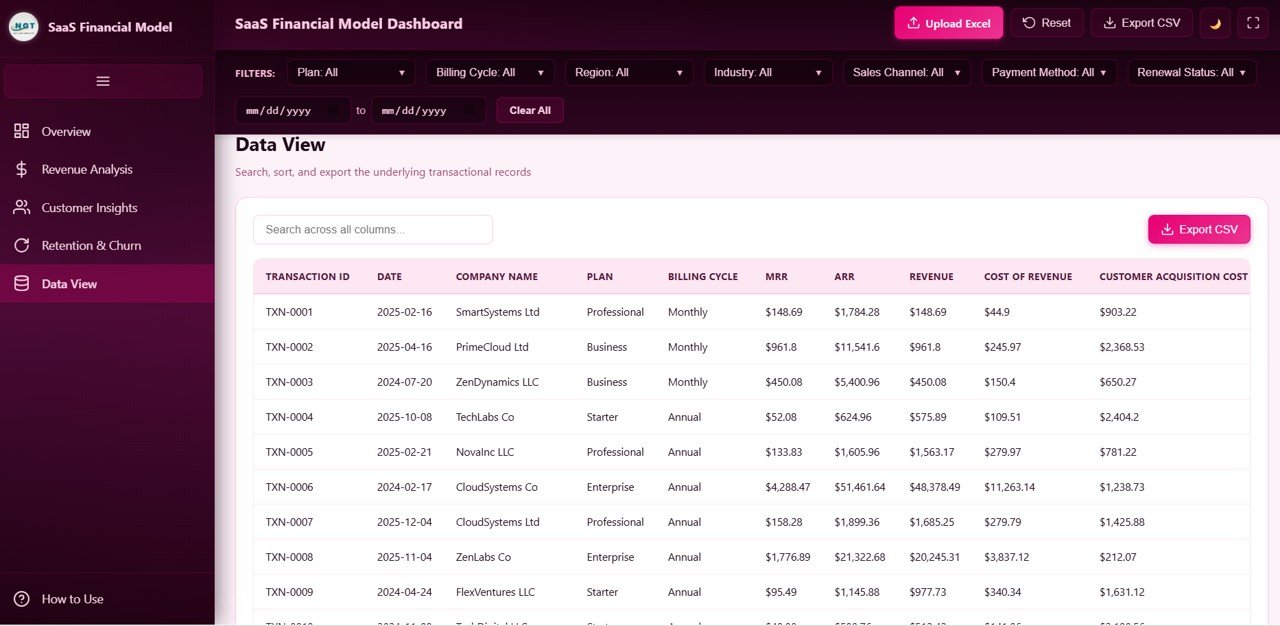
The Data View page lists the underlying transactions with a Search across all columns box and an Export CSV button. Visible columns include Transaction ID, Date, Company Name, Plan, Billing Cycle, MRR, ARR, Revenue, Cost of Revenue and Customer Acquisition Cost, so every number on the other pages can be traced back to its rows.
SaaS Financial Model KPIs at a Glance
The table lists the main KPI cards, what each measures, how it relates to the data, and which direction is better. Calculations that can be checked against the sample numbers are shown; others are described in words.
| KPI | What it measures | How it is worked out | Sample | Better when |
|---|---|---|---|---|
| Total Revenue | All revenue in the selected period | Sum of the Revenue column | $2.76M | Higher |
| Total MRR | Monthly recurring revenue | Sum of the MRR column | $463.8K | Higher |
| Annual Run-Rate | Recurring revenue on a yearly basis | MRR × 12 | $5.57M | Higher |
| Gross Profit | Revenue left after cost of revenue | Revenue − Cost of Revenue | $2.10M | Higher |
| Gross Margin | Profitability of each revenue dollar | Gross Profit ÷ Total Revenue | 76.2% | Higher |
| Expansion Revenue | Extra revenue from existing customers | Sum of expansion revenue | $23.3K | Higher |
| Avg CAC | Cost to acquire a customer | Average of Customer Acquisition Cost | $1.6K | Lower |
| Avg Seats / Account | Depth of adoption | Average seats per account | 56 | Higher |
| Avg Support Tickets | Support load per account | Average tickets per account | 7.5 | Lower |
| Renewal Rate | Share of contracts that renew | Based on the Renewal Status field | 71.6% | Higher |
| Churn Rate | Share of customers lost | Churned Accounts ÷ Active Customers | 27.2% | Lower |
| Avg NPS | Customer sentiment score | Average of the NPS score field | 5.4 | Higher |
Three of these can be checked directly from the sample cards (the cards are rounded, so a hand calculation can differ by a tenth of a point):
Annual Run-Rate = 463.8K × 12      = 5,565.6K ≈ $5.57M
Gross Margin    = 2.10M ÷ 2.76M     ≈ 76% (card shows 76.2% from unrounded totals)
Churn Rate      = 101 ÷ 372         = 27.2%
The same MRR × 12 relationship holds row by row in the Data View: TXN-0001 has MRR of $148.69 and ARR of $1,784.28.
Other SaaS metrics worth tracking
Many SaaS teams also follow LTV, LTV:CAC ratio, CAC payback months, net revenue retention and cohort retention curves. These are general industry metrics and are not cards in this template; you can calculate them separately from the exported CSV.
How to Use It With Your Own Data
- Unzip and open. Extract the download and open the HTML file in a modern browser.
- Study the sample. Open Data View to see the column layout, and read How to Use in the sidebar.
- Prepare your Excel file. Export transactions from your billing or accounting system and arrange them in the same columns (transaction ID, date, company, plan, billing cycle, MRR, ARR, revenue, cost of revenue, CAC and the other fields in the sample).
- Click Upload Excel and pick your file. All pages recalculate.
- Filter. Narrow by plan, region, channel or date range, and press Clear All to reset the filters.
- Export. Use Export CSV to take the records into a spreadsheet for deeper modelling.
- Present. Use the full-screen button for board or investor meetings.
Three Real-World Use Cases
Monthly founder review
A founder uploads last month’s transactions and checks MRR, gross margin and churn on the Overview. If churn rises, the Retention & Churn page shows which region and plan are responsible.
Board and investor updates
A finance lead filters to the last quarter, opens Revenue Analysis for MRR, ARR and expansion revenue, and presents in full-screen mode instead of building slides from scratch.
Pricing and packaging decisions
A product manager compares Revenue by Plan, MRR vs ARR by Plan and Avg Seats / Account to see whether the Business tier is pulling its weight or customers are jumping straight to Enterprise.
Best Practices
- Upload data on the same day each month so trends are comparable.
- Keep plan, region and channel labels identical across months.
- Read churn together with pending renewals; a large pending group can change the picture next month.
- Compare CAC with MRR per customer to judge payback speed.
- Keep each month’s Excel file so you can reload any earlier period.
Limitations and Who Should Not Use It
The dashboard reads the file you upload; it does not connect live to Stripe, Chargebee or your accounting system. It is a reporting view, not a forecasting model, so it does not project future MRR or calculate LTV or cohort curves. Note also that the Avg NPS card averages the score field in your data; if you want a classic Net Promoter Score (promoters minus detractors), calculate it separately. Larger SaaS companies with complex revenue recognition will need a dedicated finance stack, but early-stage and growing teams get a fast, presentable view.
Related Dashboards and Guides
For a lighter metrics view, see the SaaS Metrics Dashboard in HTML. If your team works in spreadsheets, compare the SaaS Financial Model Dashboard in Google Sheets, the SaaS MRR & Churn Tracker in Google Sheets and the SaaS Renewal KPI Dashboard. For wider revenue reporting, pair it with the Sales and Revenue Command Center Dashboard in HTML.
Related templates on NextGenTemplates: the SaaS Financial Model Dashboard in Excel and the SaaS Financial Model Dashboard in Power BI.
If you want to build reporting dashboards like this yourself, the Excel Pivot Tables & Dashboards course on NextGenTemplates Academy covers summarising transaction data and charting it step by step.
Frequently Asked Questions
What KPIs does the SaaS Financial Model Dashboard in HTML track?
Total Revenue, MRR, Annual Run-Rate, Expansion Revenue, Gross Profit, Gross Margin, Active and New Customers, Avg CAC, Avg NPS, Avg Seats per Account, Avg Support Tickets, Renewal Rate, Churned Accounts, Churn Rate, Pending Renewals and Avg Contract length in months.
Do I need Excel or Power BI to use it?
No. It runs in a web browser. You only need Excel (or any tool that saves .xlsx files) to prepare your own data for upload.
How do I load my own SaaS data?
Click Upload Excel and choose a file laid out like the sample data. The cards and charts on all five pages recalculate from your rows.
How is ARR calculated?
Annual Run-Rate is MRR multiplied by 12. In the sample, $463.8K MRR gives $5.57M.
Which filters are available?
Plan, Billing Cycle, Region, Industry, Sales Channel, Payment Method and Renewal Status, plus a date range and Clear All.
Can I export the data?
Yes. Export CSV is available in the header and on the Data View page.
Wrapping Up
The SaaS Financial Model Dashboard in HTML puts revenue, MRR, margin, acquisition and retention on five clean pages that open in any browser. Export last quarter’s transactions, upload them, and start with the Overview and Retention & Churn pages to see where growth and losses really come from.
Get the SaaS Financial Model Dashboard in HTML
📅 Last updated: October 2026