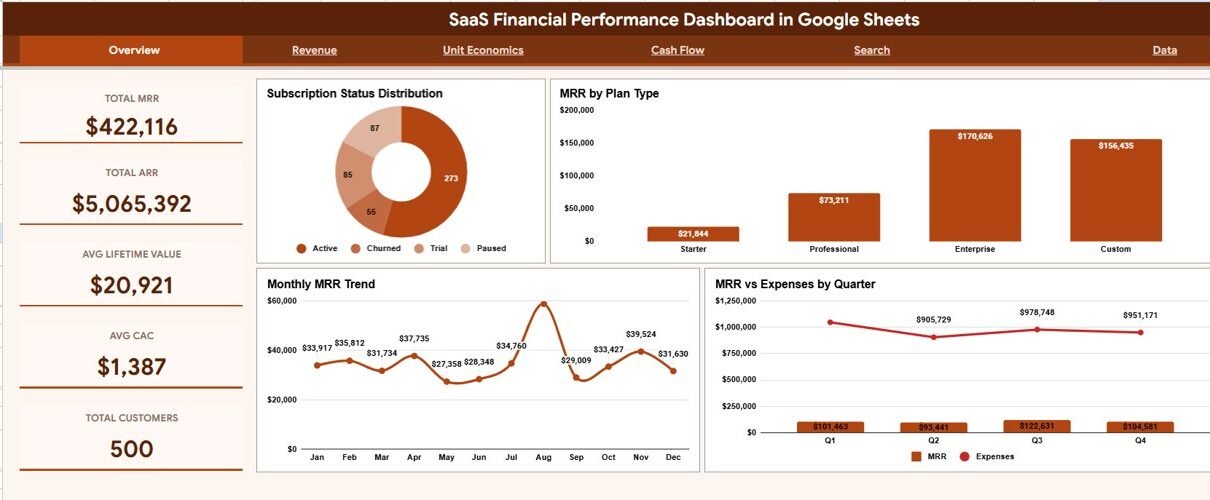
Track MRR, ARR, LTV, CAC and cash flow in one Google Sheets file. This guide walks through the dashboard’s 6 tabs, 14 charts, Search lookup and who it suits.
Online Tutorial for Data Analysis and Automation
Track MRR, ARR, LTV, CAC and cash flow in one Google Sheets file. This guide walks through the dashboard’s 6 tabs, 14 charts, Search lookup and who it suits.
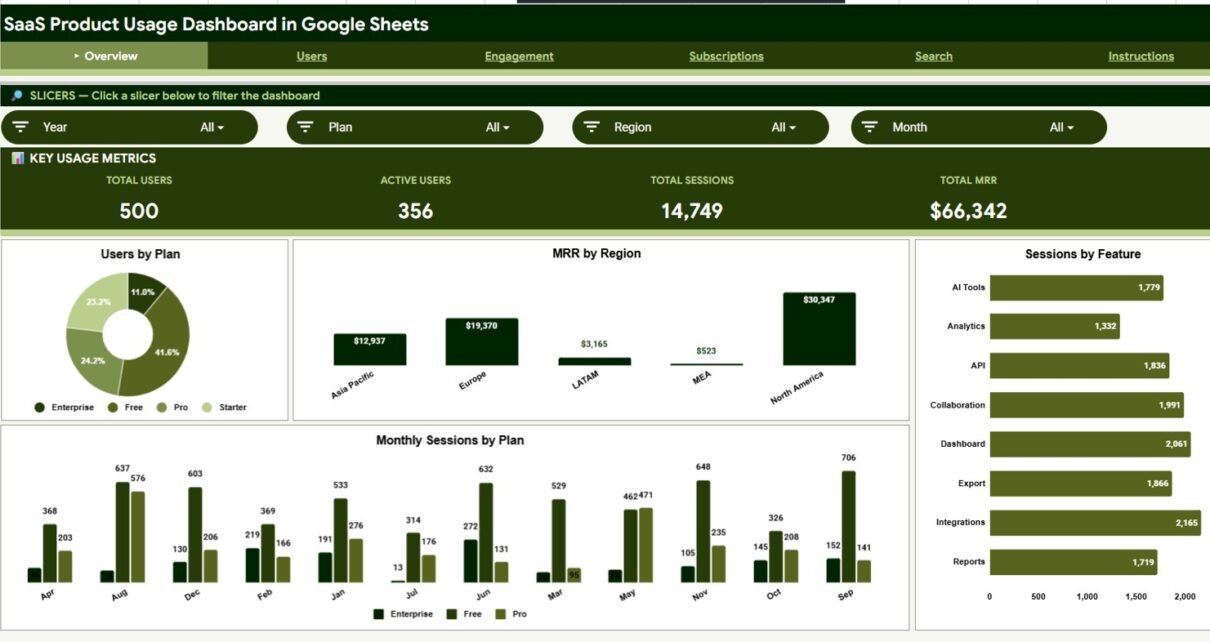
The SaaS Product Usage Dashboard in Google Sheets tracks 4 KPIs across 6 sheets with 16 charts, slicer filters, and a built-in User ID search. A $9.99 one-time alternative to Mixpanel, Amplitude, and Pendo for early-stage SaaS teams.
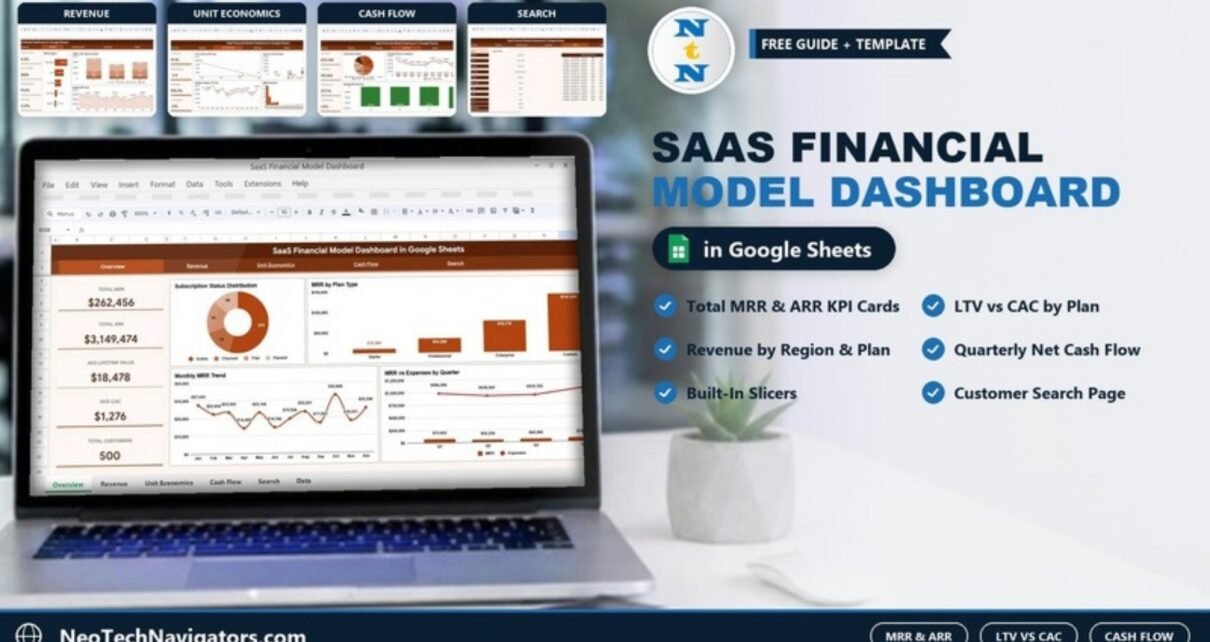
How the SaaS Financial Model Dashboard in Google Sheets tracks MRR, ARR, LTV, CAC, churn and cash flow across four analysis pages, with a worked LTV:CAC example from the sample data and steps to load your own subscription records.
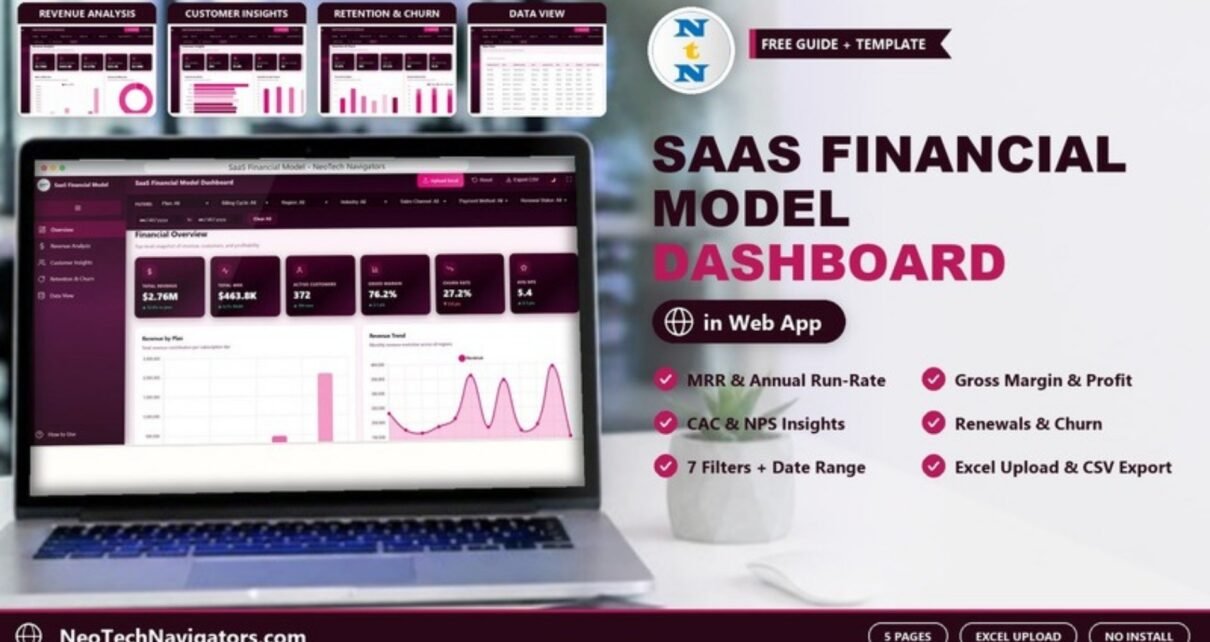
A browser-based SaaS financial dashboard with Overview, Revenue Analysis, Customer Insights, Retention & Churn and Data View pages, tracking revenue, MRR, ARR, gross margin, CAC, NPS, renewals and churn, with Excel upload and CSV export.
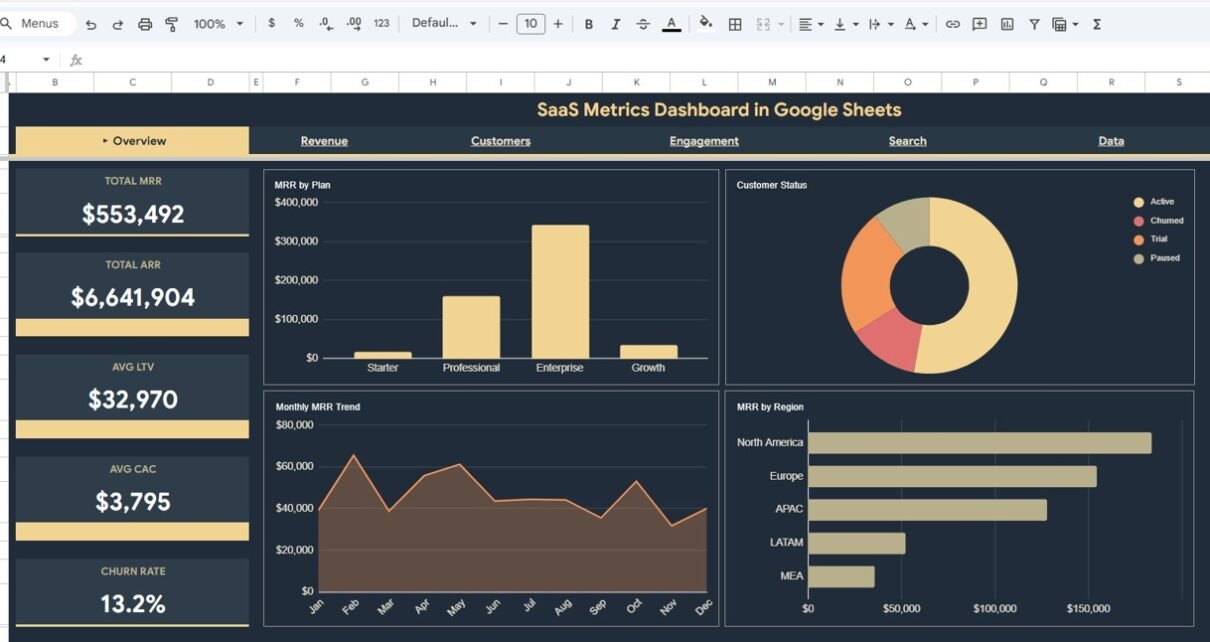
Track MRR, ARR, churn rate, LTV, CAC, and customer engagement with this interactive SaaS Metrics Dashboard in Google Sheets. 6 pages with charts and slicers.
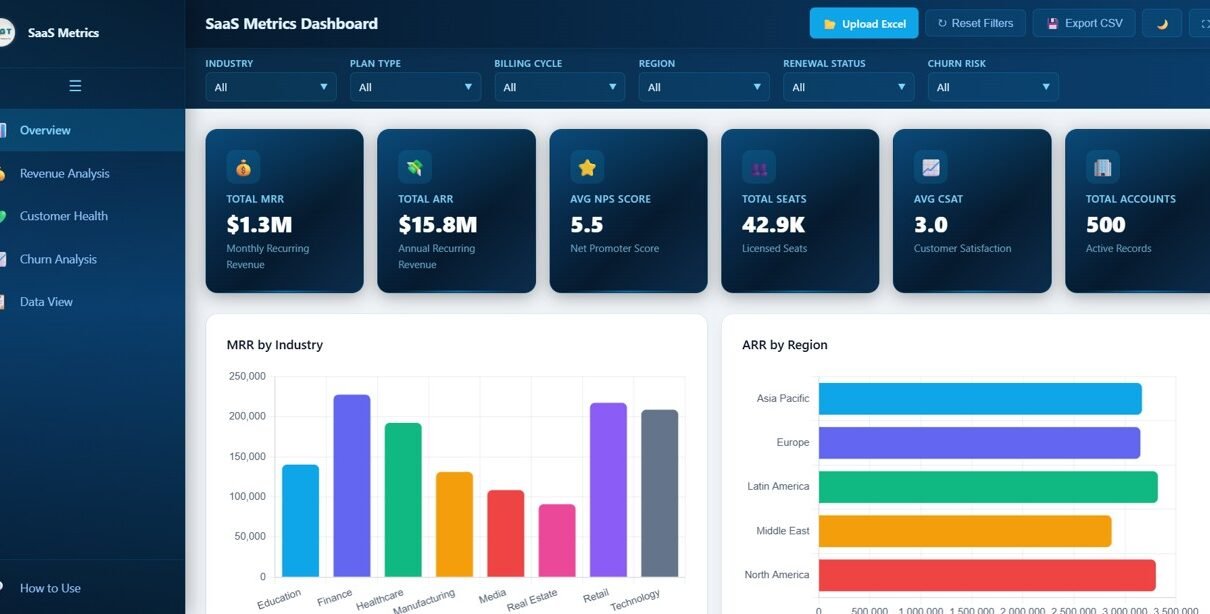
SaaS Metrics Dashboard in HTML with 5 interactive pages tracking MRR, ARR, NPS, CSAT, churn risk, and renewal status. Browser-based, zero installation required.
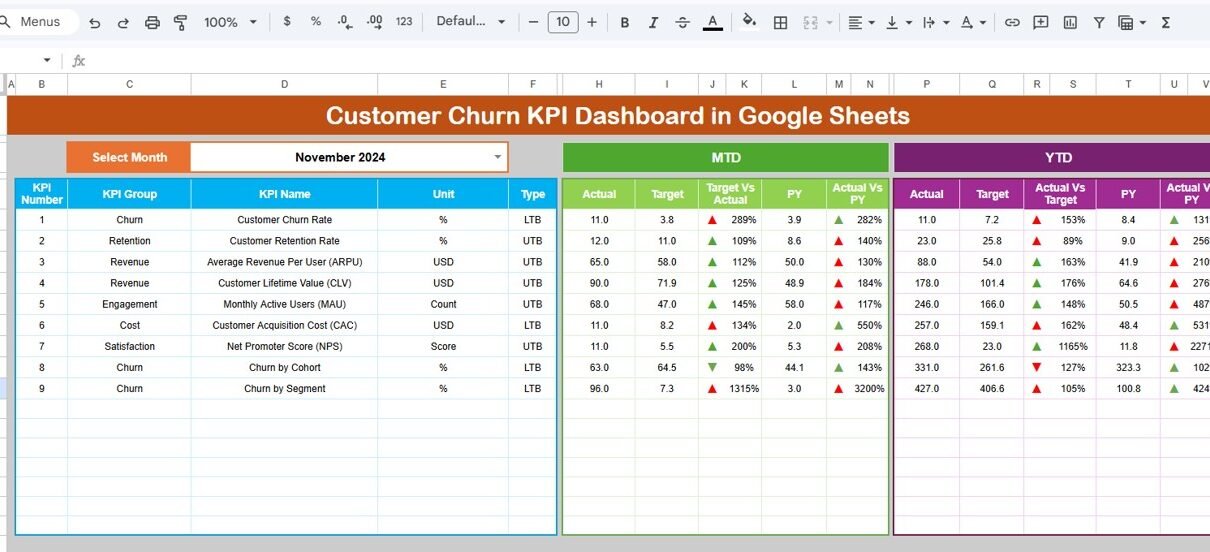
Introduction Customer churn is a critical metric for businesses aiming to retain customers and grow sustainably. Monitoring churn rates effectively can guide strategic decisions and operational improvements. This article presents a detailed overview of a Customer Churn KPI Dashboard in Google Sheets, a ready-to-use template designed to help businesses track and analyze their churn metrics […]