The Digital Marketing Campaign Dashboard in HTML is a comprehensive, browser-based analytics template built for marketing professionals who need a centralized view of their campaign performance. This interactive dashboard tracks 6 critical KPIs — Total Spend, Total Revenue, Total Profit, Total Clicks, Total Leads, and Average Bounce Rate — across 5 beautifully designed pages. Whether you run campaigns on Google Ads, Facebook, Instagram, LinkedIn, or any other platform, this HTML dashboard template delivers real-time visual insights without requiring any software installation.
Built entirely with HTML, CSS, and JavaScript, the dashboard opens in any modern browser and features dynamic slicers, interactive charts, and a full data table with export capability. It is part of our growing collection of HTML Dashboard Templates designed for professionals across industries.
Key Features of the Digital Marketing Campaign Dashboard in HTML
👉 Click here to Purchase the Digital Marketing Campaign Dashboard in HTML
This template stands out for its depth of analysis and ease of use. Here are the core features that make it one of the best digital marketing dashboard templates available:
- 5 Interactive Dashboard Pages – Overview, Platform Analysis, Campaign Performance, ROI and Trend Analysis, and Data View provide comprehensive multi-angle analysis of your marketing efforts.
- 6 KPI Summary Cards – Total Spend, Total Revenue, Total Profit, Total Clicks, Total Leads, and Average Bounce Rate are displayed at the top of the Overview page for instant health assessment.
- Dynamic Slicers and Filters – Filter the entire dashboard by platform, campaign type, region, time period, and more to quickly drill into the data that matters most.
- Interactive Charts and Visualizations – Professional charts power every analysis page, making it easy to spot trends, compare performance, and identify opportunities.
- Data Table with CSV Export – The Data View page provides a searchable, sortable, paginated table with one-click CSV export for offline reporting.
- No Software Required – Simply open index.html in Chrome, Edge, Firefox, or Safari and start analyzing immediately. Zero installation, zero subscriptions.
- Easy Data Replacement – Swap out the sample data file with your own marketing campaign data and every chart, card, and table updates automatically.
Dashboard Pages Explained
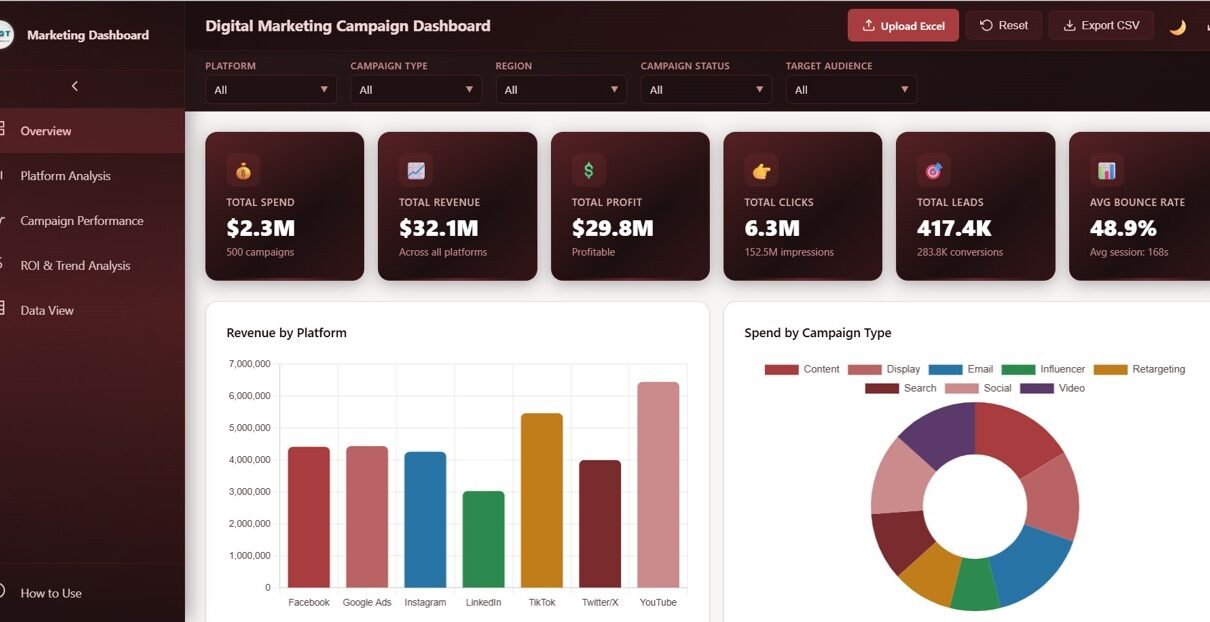
1. Overview Page
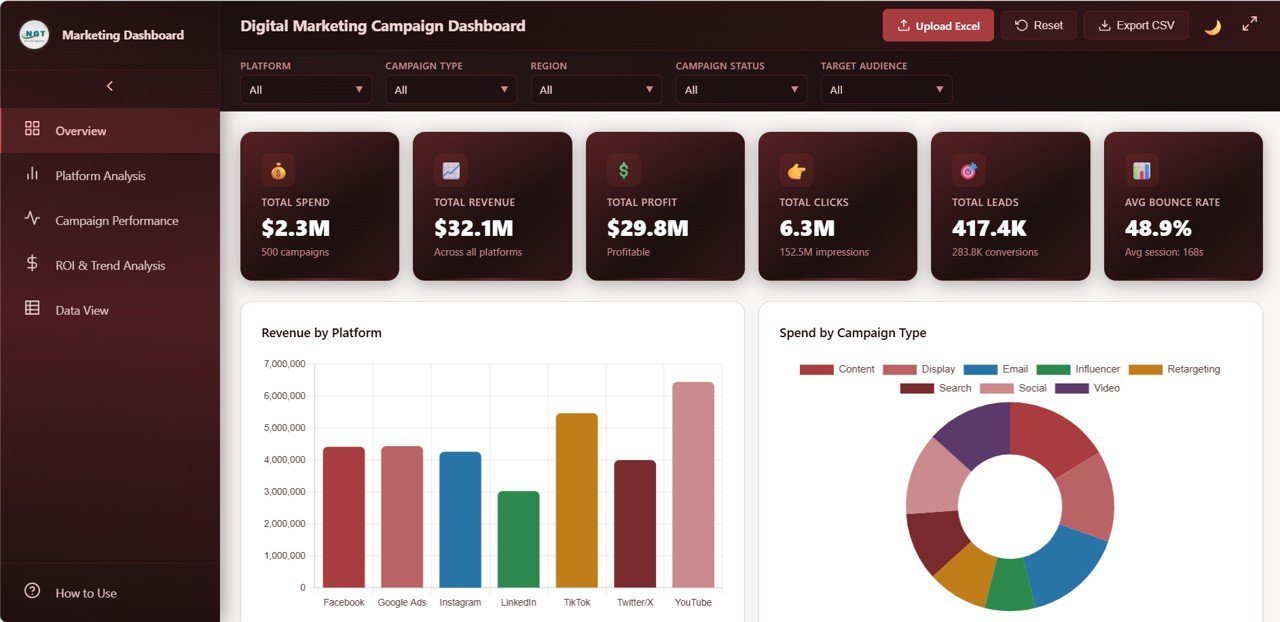
The Overview page serves as the command center for your digital marketing campaigns. At the top, 6 KPI cards display Total Spend, Total Revenue, Total Profit, Total Clicks, Total Leads, and Average Bounce Rate for an instant snapshot of campaign health. Below the cards, interactive charts show Revenue by Platform, Spend by Campaign Type, Leads by Region, Campaign Status Distribution, and Monthly Revenue Trend. Multiple slicers allow you to filter the entire dashboard by platform, region, campaign type, and date range for quick drill-down analysis.
Digital Marketing Campaign Dashboard – Overview
2. Platform Analysis
The Platform Analysis page provides a deep dive into how each advertising platform performs. This page includes 5 dedicated charts: Revenue by Platform shows which channels generate the most income, Spend by Platform reveals where your budget is going, Clicks by Platform tracks engagement levels, Conversions by Platform measures which platforms drive the most actions, and Profit by Platform highlights the most profitable channels. This side-by-side comparison makes it easy to reallocate budget to your highest-performing platforms.
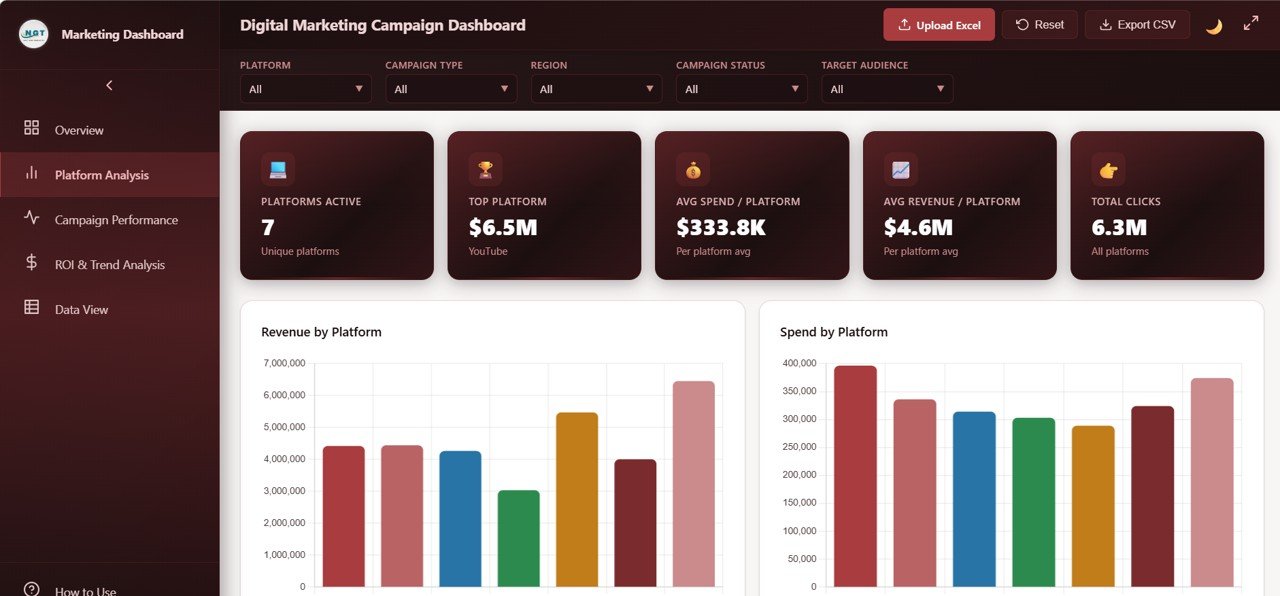
Digital Marketing Campaign Dashboard – Platform Analysis
3. Campaign Performance
The Campaign Performance page analyzes the effectiveness of your campaigns across multiple dimensions. It features Revenue by Campaign Type to compare brand awareness versus lead generation versus retargeting campaigns, Conversions by Target Audience to identify which audience segments convert best, Leads by Ad Format to evaluate creative effectiveness, Revenue by Manager for team accountability, and Spend by Target Audience to ensure budget alignment with high-converting segments. For more marketing analytics tools, check out the Marketing Funnel and Conversion Dashboard in Google Sheets.
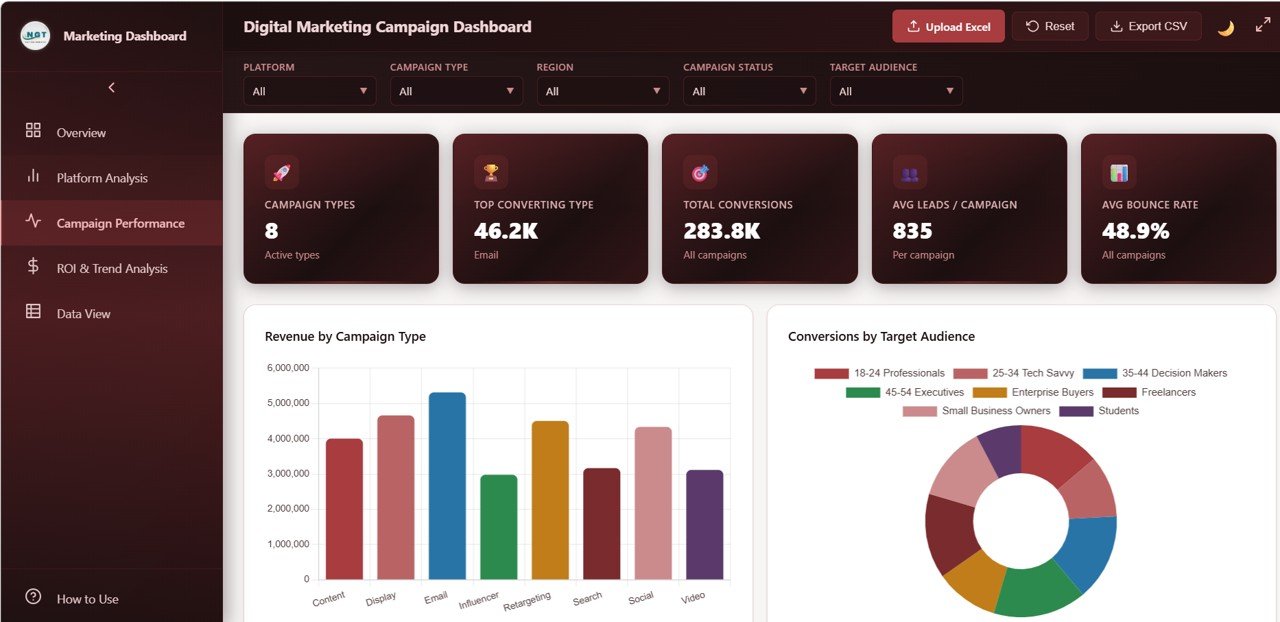
Digital Marketing Campaign Dashboard – Campaign Performance
4. ROI and Trend Analysis
The ROI and Trend Analysis page focuses on the financial health of your marketing efforts over time. Monthly Revenue vs Spend Trend shows how your investment and returns evolve month by month. Profit by Region identifies your most and least profitable markets. Budget vs Spend by Platform highlights over- and under-spending across channels. ROI by Campaign Type quantifies return for each strategy, and Cost Per Lead by Platform reveals which channels deliver leads most efficiently. This page is essential for optimizing your marketing budget allocation.
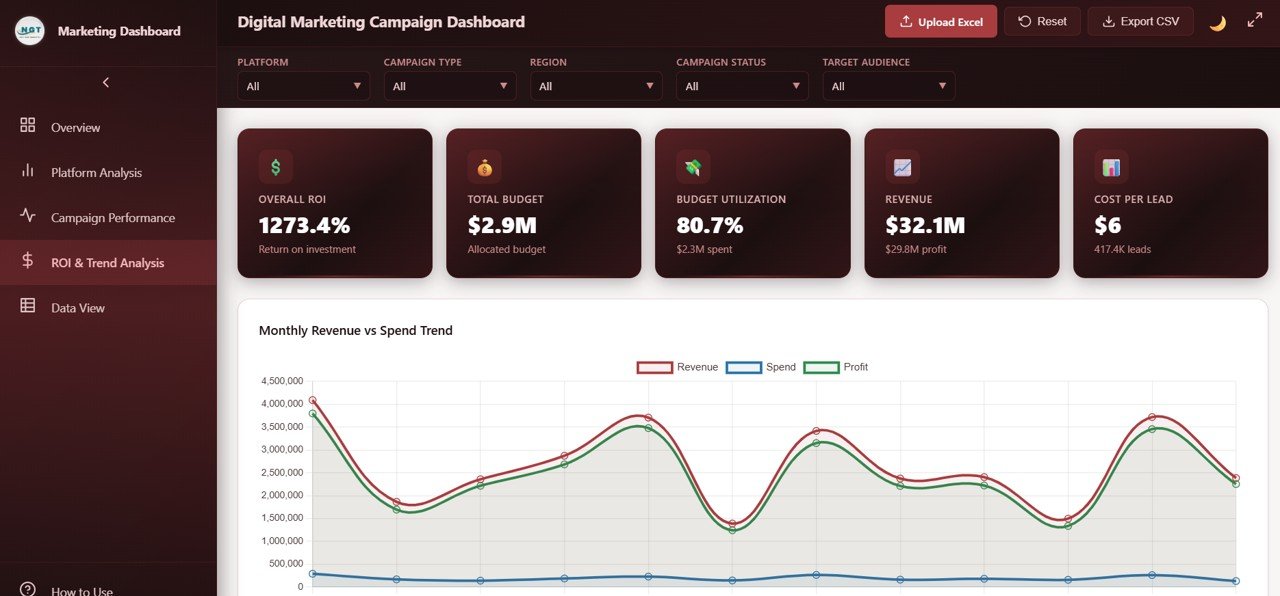
Digital Marketing Campaign Dashboard – ROI and Trend Analysis
5. Data View
The Data View page is a detailed data table showing all campaign records in a structured, sortable grid. You can search for specific campaigns, sort by any column, navigate through pages using pagination, and export the filtered dataset to CSV for offline analysis or sharing with stakeholders. This feature makes the dashboard not just a visualization tool but also a complete data management interface. See our Marketing Dashboard in HTML for another powerful HTML-based marketing analytics tool.
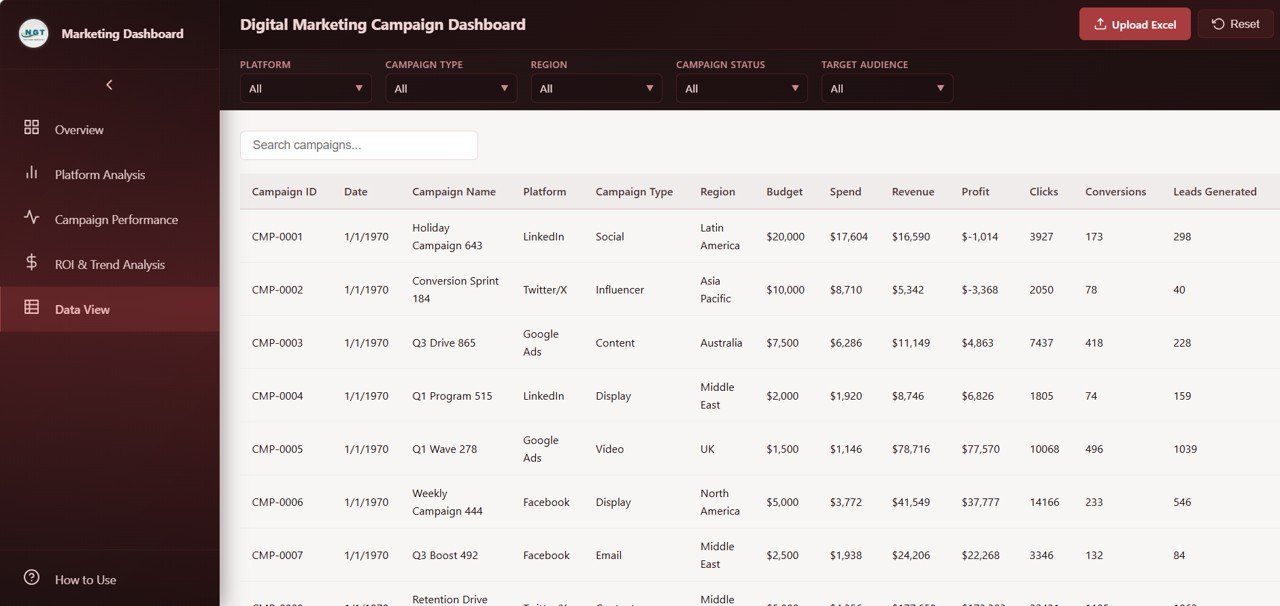
Digital Marketing Campaign Dashboard – Data View
Advantages of the Digital Marketing Campaign Dashboard in HTML
- Zero Installation Required – Unlike Excel or Power BI dashboards, this template runs directly in your browser. No licenses, no desktop apps, no plugins.
- Platform-Agnostic – Works on Windows, Mac, Linux, and even tablets. Any device with a modern browser can display the dashboard.
- Fast and Lightweight – HTML dashboards load almost instantly and handle large datasets smoothly without the overhead of spreadsheet applications.
- Professional Presentation – The dark-themed, modern UI makes this dashboard ideal for client presentations, stakeholder meetings, and management reports.
- Complete Campaign Visibility – From high-level KPIs to granular data records, this dashboard covers every layer of campaign analysis in one unified interface.
- Multi-Platform Comparison – Compare Google Ads, Facebook, Instagram, LinkedIn, and other platforms side by side to make data-driven budget decisions.
Opportunities for Improvement
- Live API Integration – Currently, data is loaded from a static file. Advanced users could connect it to Google Ads or Facebook Ads APIs for real-time data feeds.
- Date Range Picker – Adding a custom date range selector would allow even more granular time-based analysis beyond the existing monthly filters.
- Email Scheduling – Integrating automated email reports would enable stakeholders to receive dashboard snapshots on a recurring basis without opening the file.
- Multi-Currency Support – For global campaigns, adding currency conversion would make the dashboard even more useful for international marketing teams.
Best Practices for Using This Dashboard
- Update Data Weekly – Refresh your campaign data at least weekly to keep the dashboard current and actionable.
- Use Filters Strategically – Start with the Overview page for a high-level snapshot, then use slicers to drill into specific platforms or campaign types for deeper analysis.
- Compare Platforms Regularly – Use the Platform Analysis page to identify underperforming channels and reallocate budget to higher-ROI platforms.
- Track ROI Trends Monthly – The ROI and Trend Analysis page reveals whether your marketing efficiency is improving or declining over time — use it to justify budget increases or strategy changes.
- Export and Share – Use the CSV export feature to share filtered data with team members or clients who prefer working in spreadsheets.
Explore Relevant Templates
If you find the Digital Marketing Campaign Dashboard in HTML useful, you may also want to explore these related templates:
- Digital Marketing Campaign Dashboard in Excel – The same powerful marketing campaign analytics with Excel pivot tables and charts.
- Digital Marketing Campaign Dashboard in Power BI – Interactive Power BI version with advanced drill-through and DAX measures.
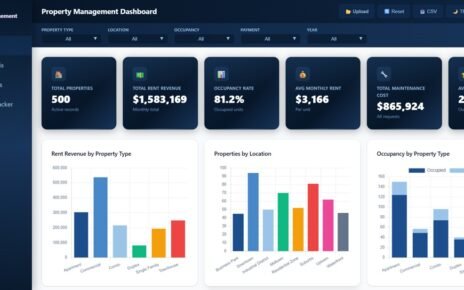
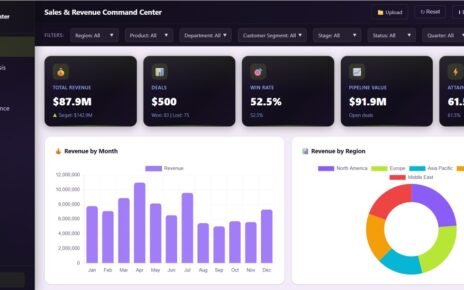
- Sales and Revenue Command Center Dashboard in HTML – Track your complete sales pipeline and revenue performance in the browser.
- Amazon FBA Seller Dashboard in HTML – Comprehensive Amazon seller analytics in an interactive HTML dashboard.
- PPC Campaign KPI Dashboard in Google Sheets – Track pay-per-click campaign KPIs in Google Sheets with automated calculations.
Frequently Asked Questions
What is the best HTML dashboard template for tracking digital marketing
campaigns?
👉 Click here to Purchase the Digital Marketing Campaign Dashboard in HTML
The Digital Marketing Campaign Dashboard in HTML from NextGenTemplates is one of the best available options. It includes 5 interactive pages covering campaign overview, platform comparison, campaign performance, ROI trend analysis, and a full data view with CSV export — all running directly in your browser with no software installation required.
How do I track marketing campaign ROI using an HTML dashboard?
The ROI and Trend Analysis page in this dashboard shows Monthly Revenue vs Spend Trend, ROI by Campaign Type, Cost Per Lead by Platform, Budget vs Spend comparison, and Profit by Region. Simply replace the sample data with your own campaign data and the dashboard calculates and visualizes your ROI automatically.
Can I use this HTML dashboard to compare performance across Google Ads, Facebook, and Instagram?
Yes. The Platform Analysis page provides side-by-side comparison of Revenue, Spend, Clicks, Conversions, and Profit across all your advertising platforms including Google Ads, Facebook, Instagram, LinkedIn, and any custom platforms you add to your data.
Do I need coding skills to use this digital marketing dashboard?
No coding skills are needed. Download the file, unzip it, open index.html in your browser, and start analyzing. To use your own data, simply replace the records in the data file following the same column structure as the sample data.
Is this dashboard available in Excel, Google Sheets, or Power BI?
Yes. NextGenTemplates offers the Digital Marketing Campaign Dashboard in four platforms: HTML, Excel, Power BI, and Google Sheets. Choose the platform that best fits your workflow.
What KPIs and metrics does this digital marketing campaign dashboard track?
The dashboard tracks 6 primary KPIs: Total Spend, Total Revenue, Total Profit, Total Clicks, Total Leads, and Average Bounce Rate. Beyond these, it provides detailed breakdowns by platform, campaign type, region, ad format, target audience, and campaign manager across 5 interactive pages.
Conclusion
The Digital Marketing Campaign Dashboard in HTML is a must-have tool for any marketing professional who wants to consolidate campaign data into a single, interactive, and visually appealing dashboard. With 5 dedicated pages covering everything from high-level KPIs to granular data records, this template empowers you to make smarter budget decisions, compare platform performance, and track ROI trends — all without installing any software.
👉 Click here to Purchase the Digital Marketing Campaign Dashboard in HTML
For more HTML dashboard templates, visit our HTML Dashboard collection. And don’t forget to subscribe to our YouTube channel for step-by-step video tutorials:
👉 Youtube.com/@NeoTechNavigators