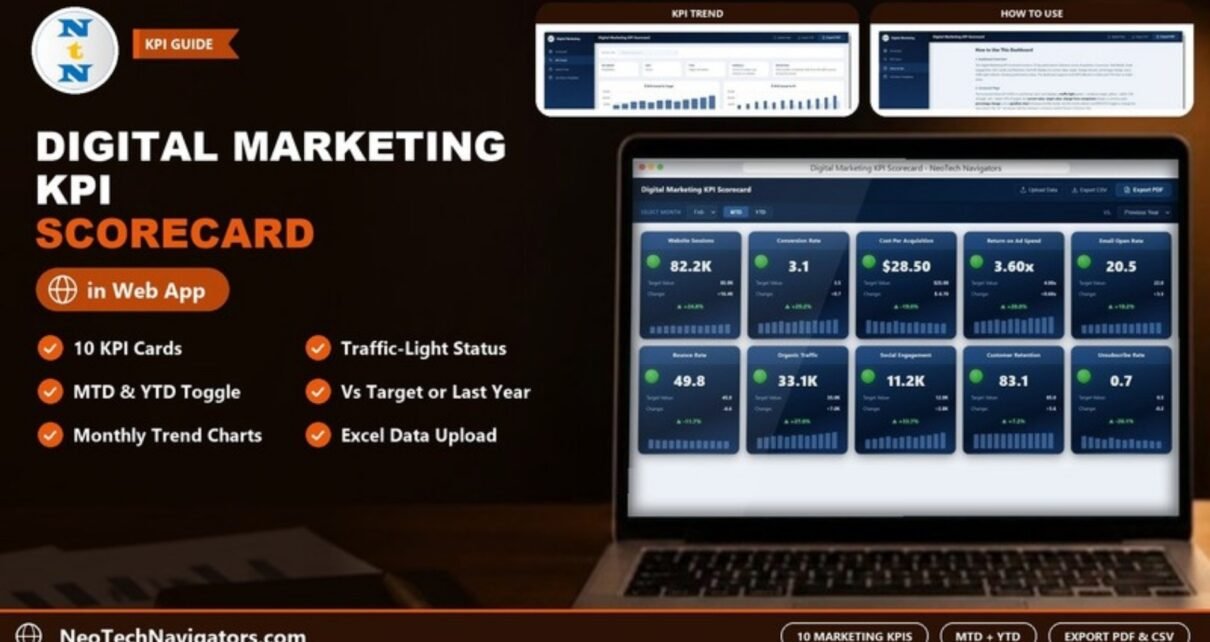
How the Digital Marketing KPI Scorecard in HTML works: ten KPI cards with traffic lights, MTD/YTD and target or previous-year comparison, a KPI Trend page, and an Excel upload for your own numbers.
Online Tutorial for Data Analysis and Automation
How the Digital Marketing KPI Scorecard in HTML works: ten KPI cards with traffic lights, MTD/YTD and target or previous-year comparison, a KPI Trend page, and an Excel upload for your own numbers.
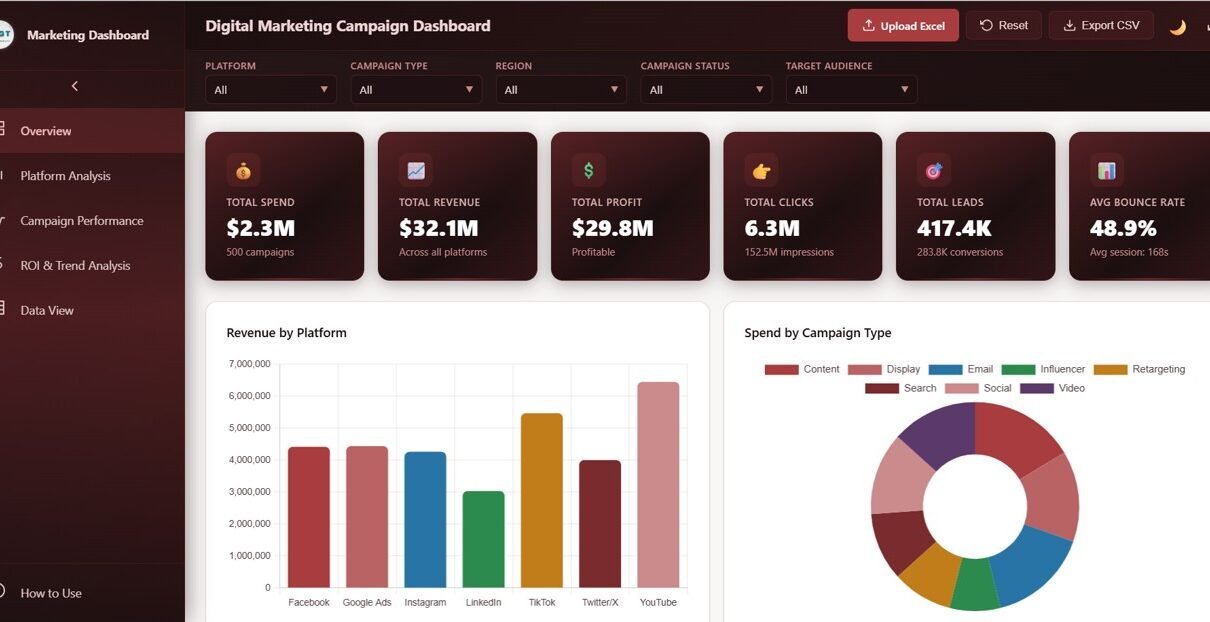
Explore the Digital Marketing Campaign Dashboard in HTML with 5 interactive pages tracking Total Spend, Revenue, Profit, Clicks, Leads, and Bounce Rate across all marketing platforms.
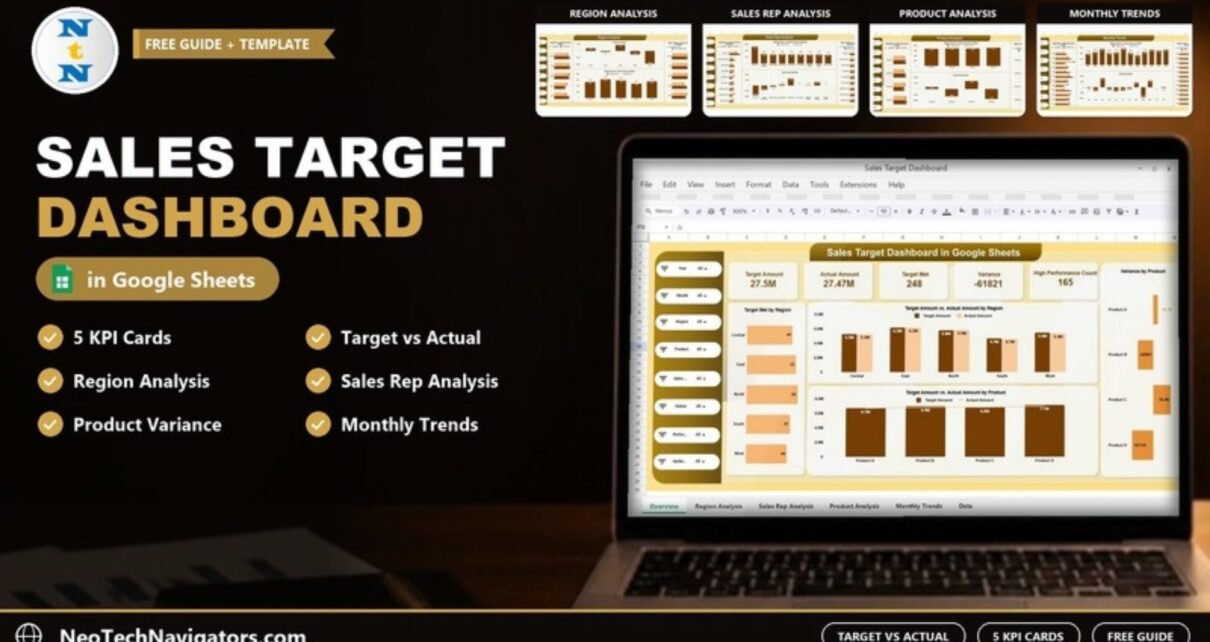
A walkthrough of the Sales Target Dashboard in Google Sheets: five KPI cards, region, sales rep, product and monthly analysis pages, the target vs actual formulas behind them, and how to load your own sales data.
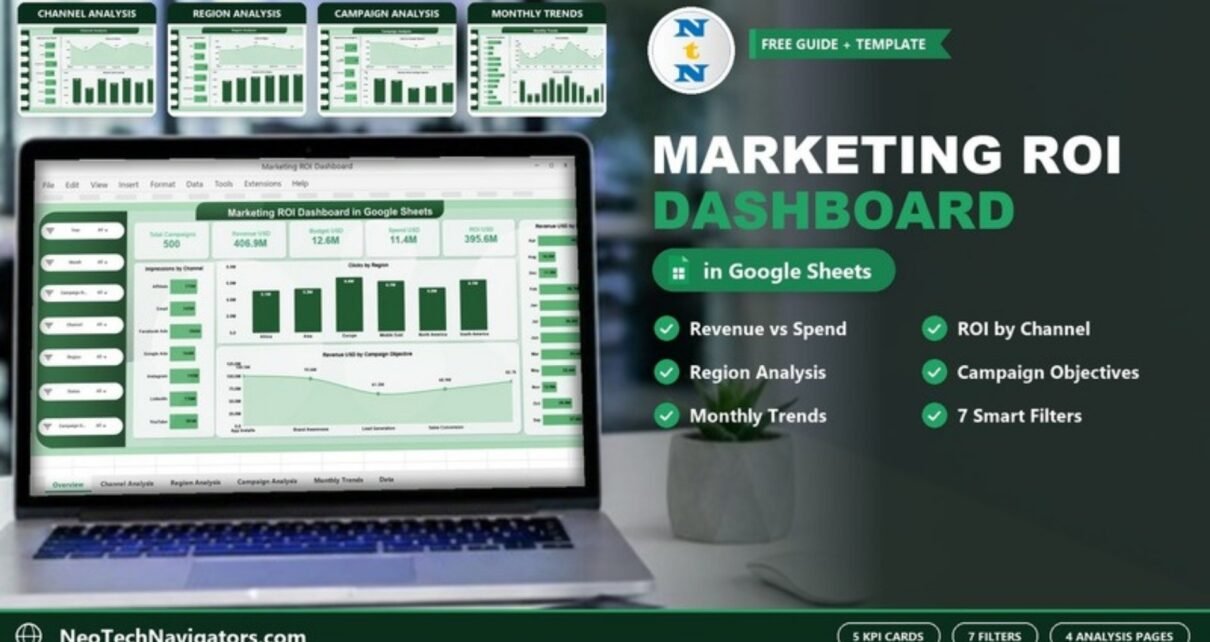
A practical guide to the Marketing ROI Dashboard in Google Sheets: five KPI cards, channel, region, campaign objective and monthly analysis pages, seven filters, and how to load your own campaign data.
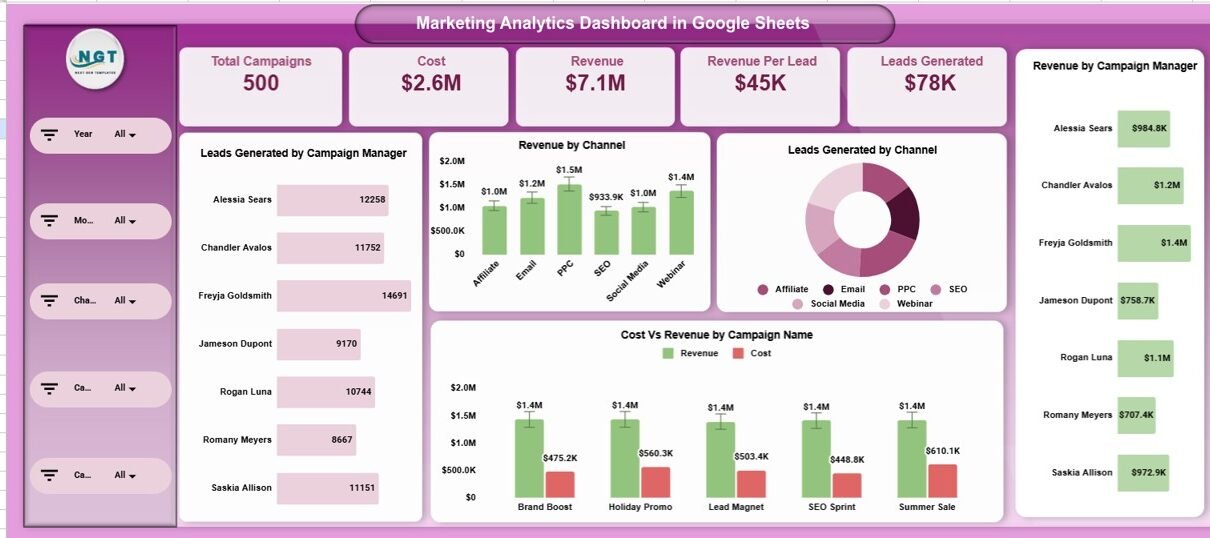
Marketing teams generate large volumes of data every day. Campaign costs, leads, channels, revenue, and performance metrics keep changing continuously. However, without a structured reporting system, teams struggle to understand what works and what does not. That is exactly why a Marketing Analytics Dashboard in Google Sheets becomes essential.Marketing Analytics Dashboard in Google Sheets This […]