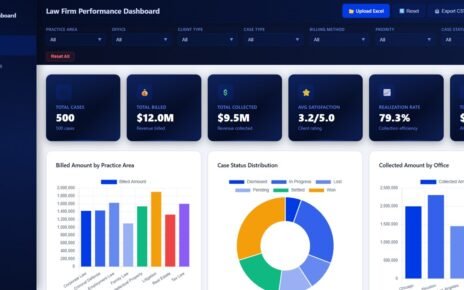
Agriculture and Farm Dashboard in HTML is a modern interactive dashboard template designed for farm owners, agronomists, and agribusiness managers who want to track revenue, yield, area cultivated, pricing, and seasonal performance across multiple farms, regions, and crops in a single unified view. Whether you manage a small family farm or oversee large-scale commercial operations, this HTML dashboard consolidates all your critical agricultural data into beautifully designed interactive pages that run entirely in a web browser with no installation or software required.Agriculture and Farm Dashboard in HTML
The Agriculture and Farm Dashboard in HTML includes five interactive pages covering Overview, Crop Analysis, Regional View, Season Trends, and a complete Data View. Each page is packed with KPI cards and visual charts that update dynamically as you apply filters. The dashboard supports multi-select checkbox filters, light and dark theme toggle, collapsible sidebar navigation, Excel and CSV upload so users can load their own data, CSV export for downloading filtered records, fullscreen mode, and a fully responsive design that works on desktop, tablet, and mobile browsers.
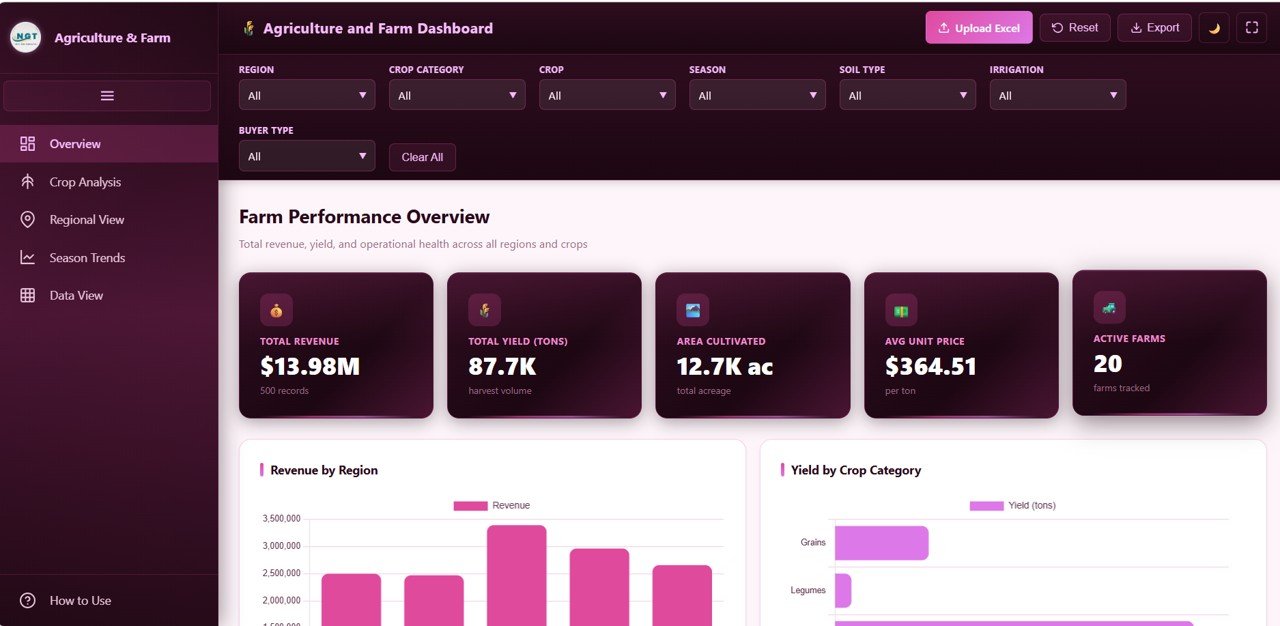
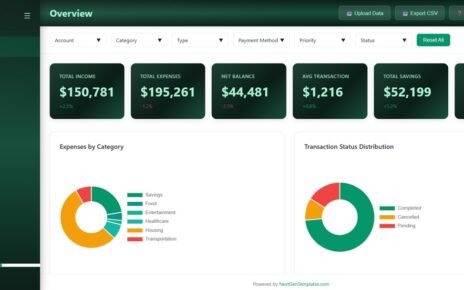
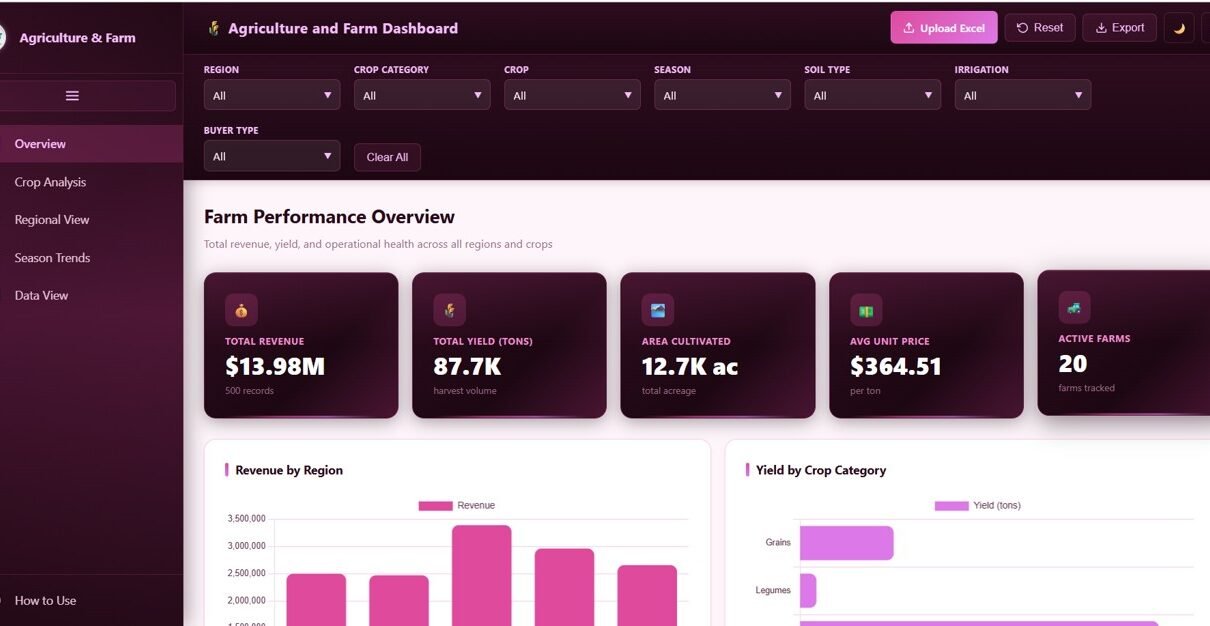
Overview Page
Overview Page of the Agriculture and Farm DashboardThe Overview page serves as the central command center of the Agriculture and Farm Dashboard. At the top of the page, five KPI cards display Total Revenue, Total Yield Tons, Area Cultivated, Avg Unit Price, and Active Farms, giving users an instant snapshot of their entire farming operation. Below the KPI cards, the page features five powerful visuals that break down the data from different angles. Revenue by Region shows how income is distributed across geographic areas, helping managers identify which regions contribute the most to the bottom line. Yield by Crop Category reveals the total production volume grouped by crop type, making it easy to spot which categories dominate the harvest. Revenue Distribution by Season highlights how earnings shift across planting and harvesting cycles throughout the year. Top 8 Crops by Revenue ranks the highest-earning crops, allowing decision-makers to focus resources on the most profitable products. Finally, the Monthly Revenue Trend visualizes income patterns over time so users can identify growth periods, seasonal dips, and long-term financial trajectories.Agriculture and Farm Dashboard in HTML
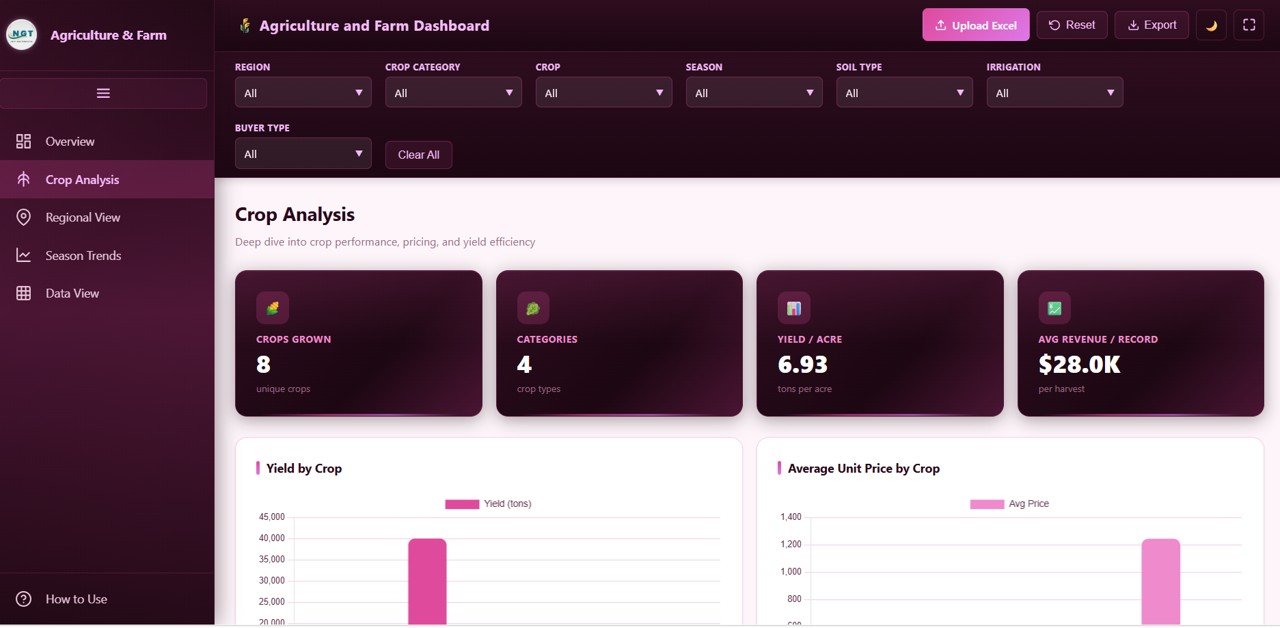
Crop Analysis Page
 Crop Analysis Page of the Agriculture and Farm Dashboard
The Crop Analysis page dives deep into individual crop performance across the entire dataset. The KPI cards on this page display Crops Grown, Categories, Yield per Acre, and Avg Revenue per Record, providing a quick summary of crop diversity and productivity. The visual section features four detailed charts. Yield by Crop breaks down production volume for each individual crop, so users can compare which crops produce the most tonnage. Average Unit Price by Crop reveals the pricing landscape and helps identify crops that command premium market rates. Revenue by Crop Category groups earnings by broader crop classifications to highlight the most profitable segments. Area and Revenue by Crop provides a dual-axis comparison of how much land each crop occupies versus how much revenue it generates, making it straightforward to evaluate land use efficiency. Together, these visuals empower agronomists and farm managers to make data-driven decisions about which crops to expand, which to reduce, and where to invest for maximum return.Agriculture and Farm Dashboard in HTML
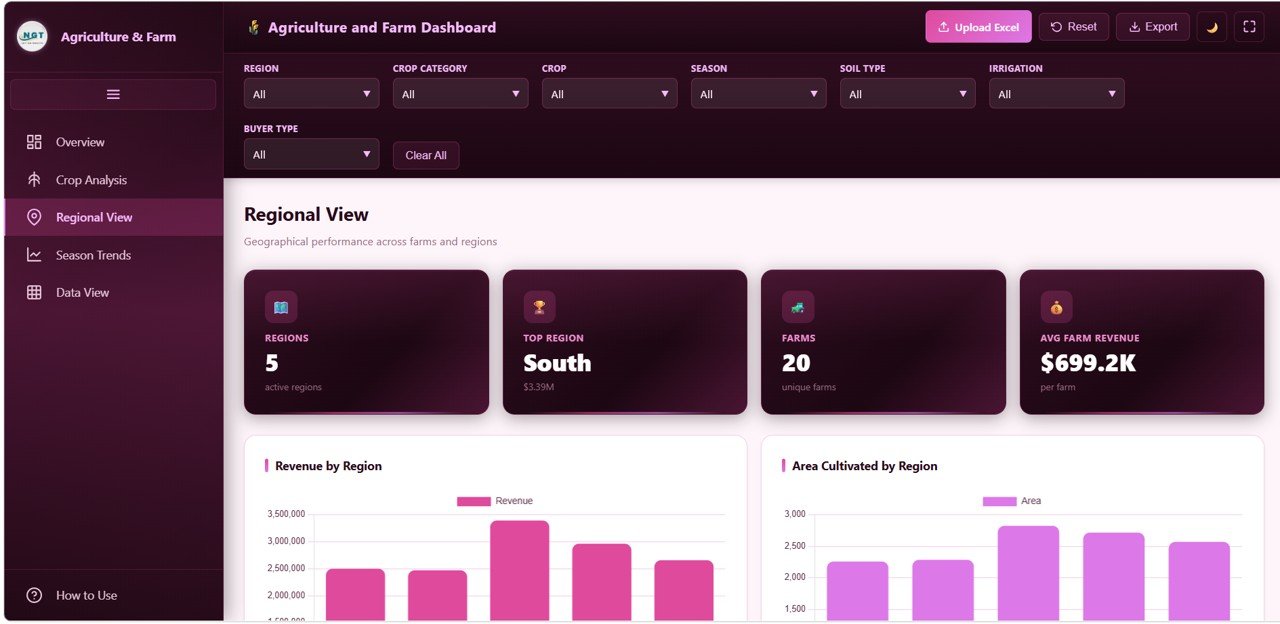
Regional View Page
 Regional View Page of the Agriculture and Farm Dashboard
The Regional View page focuses on geographic and farm-level performance comparisons. The KPI cards here show Active Regions, Top Region, Farms, and Average Farm Revenue to give users a high-level understanding of how their operations are distributed. The visuals on this page include Revenue by Region, which compares total income across different geographic areas side by side. Area by Region shows how cultivated land is spread across regions, helping managers assess whether certain areas are underutilized. Top 10 Farms by Revenue highlights the most productive individual farms in the entire portfolio, making it easy to recognize standout performers and study what makes them successful. Records by Irrigation Method breaks down the dataset by irrigation type, giving users valuable insight into how different watering techniques correlate with farming activity. This page is particularly useful for agribusiness managers overseeing operations across multiple states or countries, as it brings geographic performance differences into sharp focus and supports strategic resource allocation decisions.Agriculture and Farm Dashboard in HTML
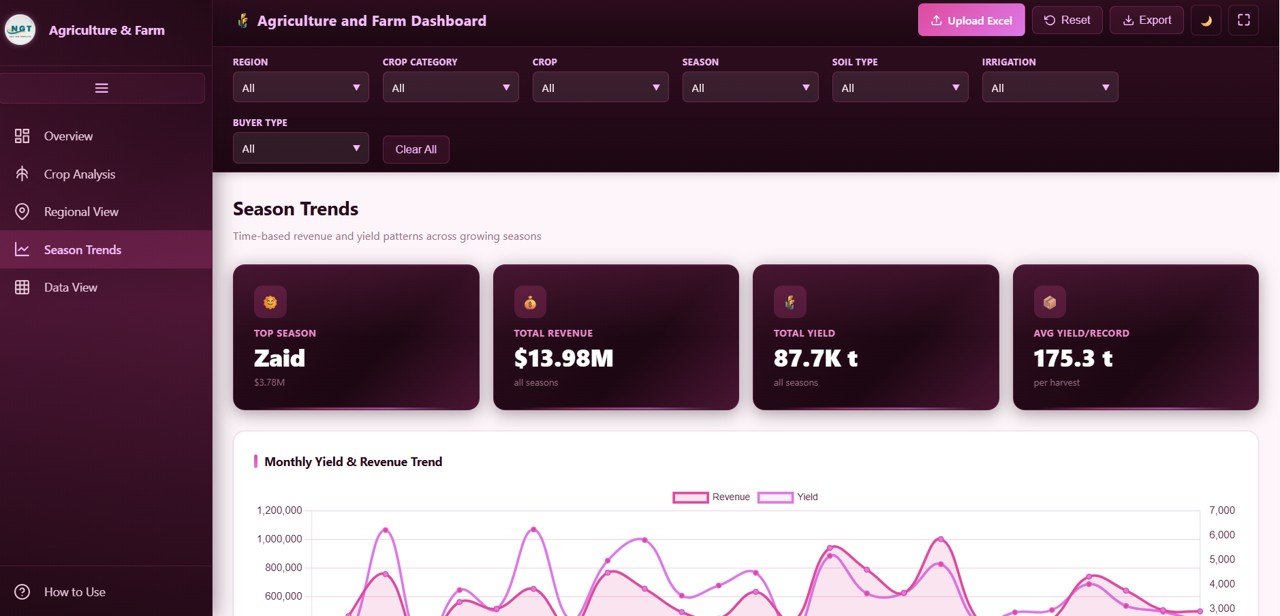
Season Trends Page
 Season Trends Page of the Agriculture and Farm Dashboard
The Season Trends page is all about understanding how time, weather patterns, and buyer behavior affect farming outcomes. The KPI cards display Top Season, Total Revenue, Total Yield, and Avg Yield per Record, summarizing the seasonal story at a glance. The visuals include Revenue and Yield by Month, which plots both financial performance and production volume on a monthly timeline to reveal how harvests translate into earnings over the calendar year. Revenue by Season groups the data into seasonal buckets so users can instantly see which planting or harvesting season generates the most income. Yield by Soil Type connects production output to soil conditions, providing actionable intelligence for land preparation and crop selection. Revenue by Buyer Type shows how earnings are distributed across different purchasing channels, whether wholesale, retail, export, or direct-to-consumer. Together, these seasonal and buyer insights help farm owners plan ahead, optimize planting schedules, negotiate better deals with buyers, and allocate budgets for peak and off-peak periods more effectively.Agriculture and Farm Dashboard in HTML
Data View Page
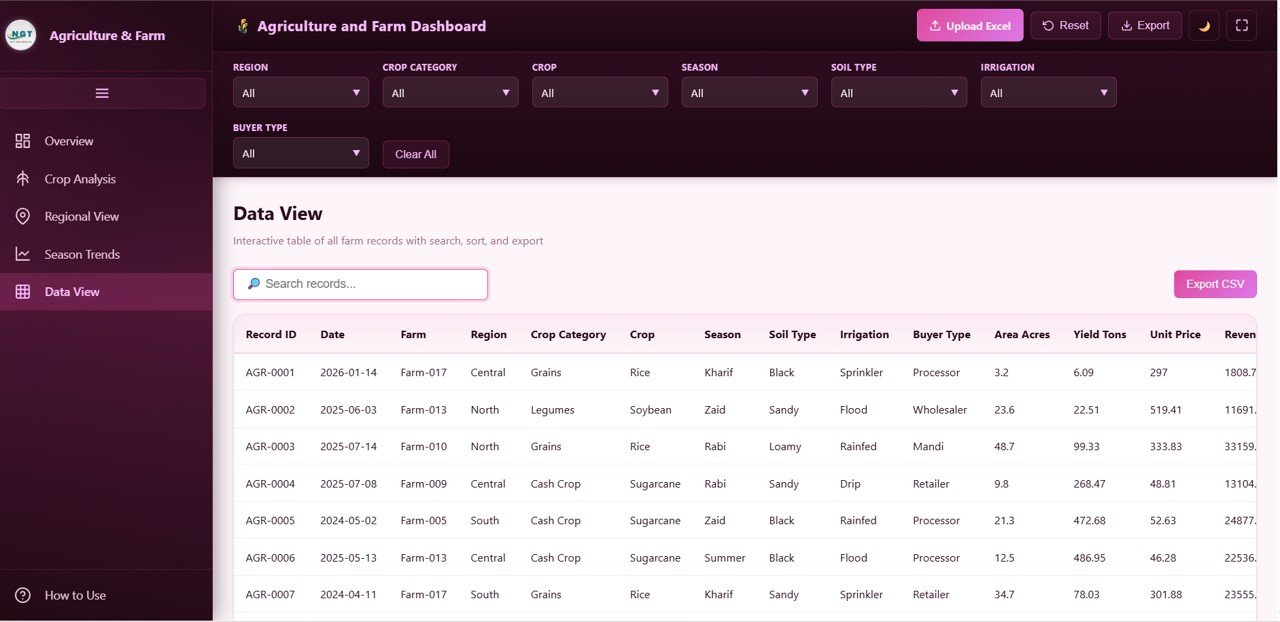 Data View Page of the Agriculture and Farm Dashboard
The Data View page displays the complete farm dataset in a fully interactive table format. Users can search across all fields using a built-in search bar, click any column header to sort records in ascending or descending order, and navigate through large datasets using pagination controls. A CSV export button allows users to download the currently filtered data to a local file, making it easy to share raw records with accountants, consultants, or government agencies. This page is essential for anyone who needs granular access to the underlying data beyond what the visual charts show, and it ensures complete transparency and auditability of every farming record in the system.Agriculture and Farm Dashboard in HTML
Click to buy Agriculture and Farm Dashboard in HTML
Key Features of the Agriculture and Farm Dashboard in HTML
This HTML dashboard template is packed with features that make it a professional-grade analytical tool. It features a clean modern interface with intuitive navigation and a light and dark theme toggle for comfortable viewing in any setting. The collapsible sidebar keeps the layout organized while providing quick access to every page. Multi-select checkbox filters apply across every page simultaneously, allowing users to drill into specific regions, crops, seasons, farms, and more without switching contexts. The Excel and CSV upload feature means users are not locked into sample data and can instantly load their own farming records to see real insights. CSV export lets users download filtered data for external use. Fullscreen mode maximizes the viewing area for presentations and deep analysis sessions. And the fully responsive design ensures the dashboard works flawlessly on desktop computers, tablets, and mobile phones, so farm managers can check their data from anywhere.
Advantages of the Agriculture and Farm Dashboard in HTML
One of the biggest advantages of this dashboard is its zero-dependency architecture. It runs entirely in a web browser, which means there is no need to install Excel, Power BI, or any other software. This makes it ideal for teams with mixed technology environments or limited IT support. The five-page structure covers every major dimension of farm analytics, from high-level financial summaries to granular crop and regional breakdowns. The interactive filters allow users to create custom views in seconds without any technical knowledge. The ability to upload custom data means this template adapts to any farming operation regardless of size, crop type, or geography. Additionally, the Farm Production and Profitability Dashboard in Google Sheets is a great complementary option for users who prefer cloud-based spreadsheets.
Opportunities for Improvement
While the Agriculture and Farm Dashboard in HTML covers a broad range of metrics, there are a few areas where users might want to extend functionality. Adding weather data integration could help correlate climate conditions with yield performance more directly. A forecasting module that projects future revenue and yield based on historical trends would add predictive value. Users managing organic versus conventional farming operations might benefit from a certification tracking page. Finally, integrating GPS or mapping visuals could enhance the regional analysis by displaying farm locations on an actual geographic map rather than chart-based comparisons alone.
Best Practices for Using This Dashboard
To get the most out of the Agriculture and Farm Dashboard, start by preparing your data file in a clean tabular format with consistent column headers matching the template structure. Upload your data using the Excel or CSV upload feature and allow the dashboard to refresh all visuals automatically. Use the multi-select filters to focus on one region or crop at a time before expanding to broader comparisons. Review the Season Trends page at the start of each planting cycle to identify patterns from previous years. Export filtered data regularly for record-keeping and tax preparation. Share the dashboard with your team by distributing the HTML file, which they can open in any browser without needing special tools. If you are also managing data in spreadsheets, consider pairing this template with the Agriculture Dashboard in Google Sheets for a comprehensive cross-platform analytics setup.
Explore Relevant Templates
If you are looking for more agriculture and farming analytics solutions, explore these related templates from NextGenTemplates.com. The Vertical Farming Dashboard in Power BI is designed for indoor farming businesses tracking operational costs, revenue, and yield across multiple growth systems. The Agriculture Dashboard in Power BI provides interactive slicer-based analytics for traditional farming operations. And the Aquaculture Dashboard in Power BI covers fish and seafood farming analytics. You can also browse the full collection of HTML Dashboard Templates on our website.
Frequently Asked Questions
What is the Agriculture and Farm Dashboard in HTML?
The Agriculture and Farm Dashboard in HTML is a ready-to-use interactive dashboard template that helps farm owners and agribusiness managers track revenue, yield, area cultivated, crop performance, regional comparisons, and seasonal trends across 5 analytical pages directly in a web browser.
Can I use my own farm data with this dashboard?
Yes. The dashboard includes an Excel and CSV upload feature that lets you replace the sample data with your own records. All KPI cards, charts, and filters update automatically to reflect your data.
Do I need to install any software to use this HTML dashboard?
No. The Agriculture and Farm Dashboard in HTML runs entirely in any modern web browser such as Chrome, Firefox, Edge, or Safari. There is no software to install, no plugins needed, and no server required.
What is the best dashboard template for tracking farm revenue and crop yield?
The Agriculture and Farm Dashboard in HTML from NextGenTemplates.com is an excellent choice. It tracks Total Revenue, Total Yield, Area Cultivated, Average Unit Price, Active Farms, and more across 5 interactive pages with multi-select filters and data export capabilities.
Is this dashboard responsive for mobile devices?
Yes. The dashboard is fully responsive and adapts to desktop, tablet, and mobile screen sizes, making it convenient to check your farm analytics from anywhere.
Conclusion
The Agriculture and Farm Dashboard in HTML is a powerful, ready-to-use analytical tool that brings together revenue tracking, crop analysis, regional performance, seasonal trends, and raw data exploration in one interactive template. It is perfect for farm owners, agronomists, and agribusiness managers who want professional-grade analytics without the complexity of enterprise software. Download the Agriculture and Farm Dashboard in HTML today from NextGenTemplates.com and start making smarter, data-driven decisions for your farming operations. It is fully interactive, works entirely in a web browser, and requires no installation at all.
Visit our YouTube channel for step-by-step video tutorials and more dashboard walkthroughs: Youtube.com/@NeoTechNavigators