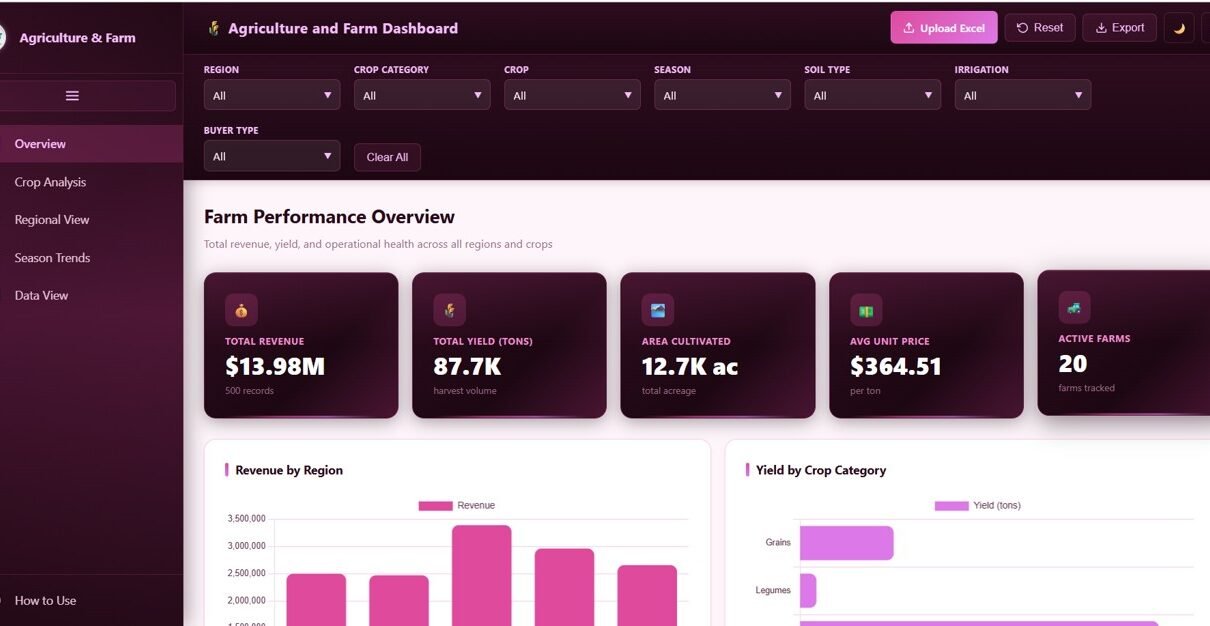
Explore the Agriculture and Farm Dashboard in HTML, a modern interactive template with 5 pages covering revenue, yield, crops, regions, and seasonal trends for farm owners and agribusiness managers.
Online Tutorial for Data Analysis and Automation
Explore the Agriculture and Farm Dashboard in HTML, a modern interactive template with 5 pages covering revenue, yield, crops, regions, and seasonal trends for farm owners and agribusiness managers.
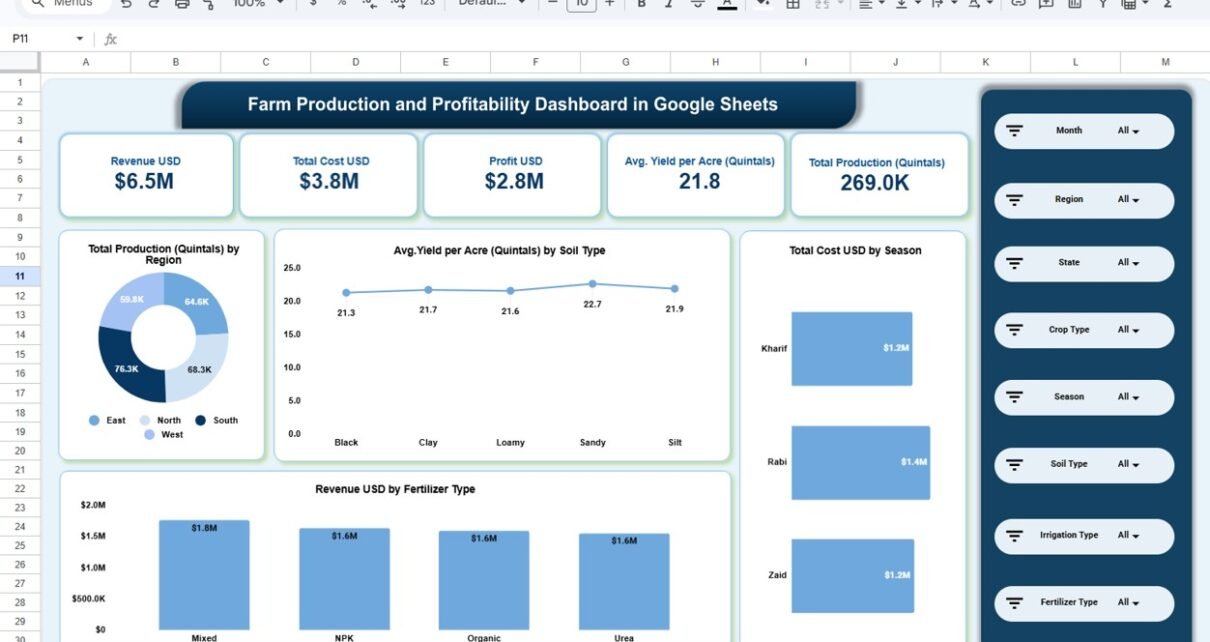
In today’s modern agriculture industry, farmers and agribusinesses generate massive amounts of data. However, managing farm production, costs, revenue, yield, and profitability manually becomes difficult.Farm Production and Profitability Dashboard in Google Sheets Because of that, many farms still rely on scattered spreadsheets. As a result, they miss important insights and struggle to make timely decisions.Farm […]
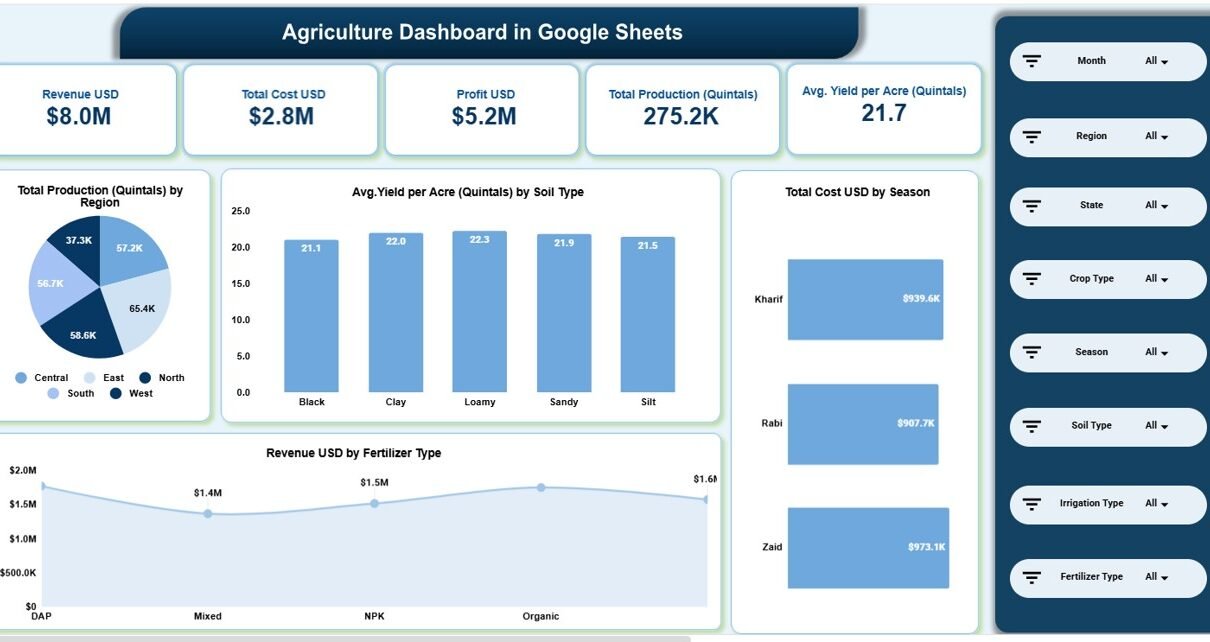
The agriculture industry depends on data more than ever before. Farmers track yield per acre. Agribusinesses monitor cost and revenue. Moreover, managers analyze soil performance, fertilizer impact, and seasonal trends. However, many agricultural businesses still use scattered spreadsheets. As a result, decision-making becomes slow. Therefore, performance tracking lacks clarity. In this article, we will explain […]