Subscription Business Dashboard in HTML is a powerful, browser-based analytics template built for SaaS founders, subscription box operators, and recurring revenue businesses that need a comprehensive view of their subscription health. With 5 interactive dashboard pages, 6 executive KPI cards, and over 15 dynamic charts, this template lets you monitor monthly recurring revenue, churn rate, subscriber growth, customer lifetime value, and much more — all without installing any software. Just open the HTML file in your browser and you are ready to analyze your subscription business performance instantly.
Whether you are a startup founder tracking your first 100 subscribers or a finance team managing thousands of recurring accounts, this dashboard gives you the visual intelligence to make data-driven decisions. If you prefer working in spreadsheets, check out the Subscription Business Dashboard in Excel or the Google Sheets version for collaborative teams.
Key Features of Subscription Business Dashboard in HTML
- 5 Interactive Dashboard Pages — Executive Overview, Revenue Analytics, Customer Analytics, Churn Analysis, and Growth Forecasting provide a 360-degree view of your subscription business
- 6 Executive KPI Cards — Monthly Recurring Revenue (MRR), Annual Recurring Revenue (ARR), Active Subscribers, Churn Rate, ARPU, and Customer Lifetime Value (LTV) displayed prominently for quick decision-making
- 15+ Dynamic Charts — Revenue trends, subscriber segmentation, churn breakdown, cohort retention, plan migration, and growth projections powered by interactive visualizations
- Zero Software Installation — Runs in any modern browser including Chrome, Firefox, Edge, and Safari with no plugins or extensions required
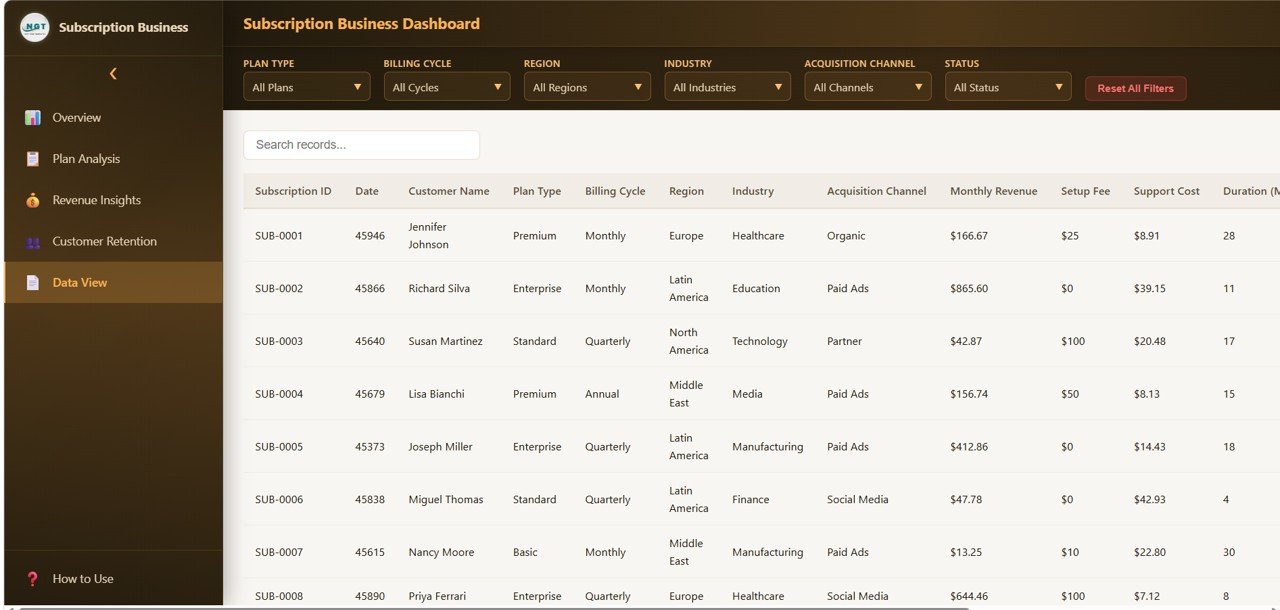
- Easy Data Replacement — Replace the included sample data with your own subscription metrics and all charts, KPI cards, and filters update automatically
- Interactive Filters — Slice data by time period, subscription plan, region, and customer segment for targeted analysis
- Fully Customizable — Edit colors, fonts, logos, and layout using any text or code editor to match your brand
- Print and Export Ready — Screenshot or print any page directly from the browser for board presentations and investor reports
Dashboard Pages Explained
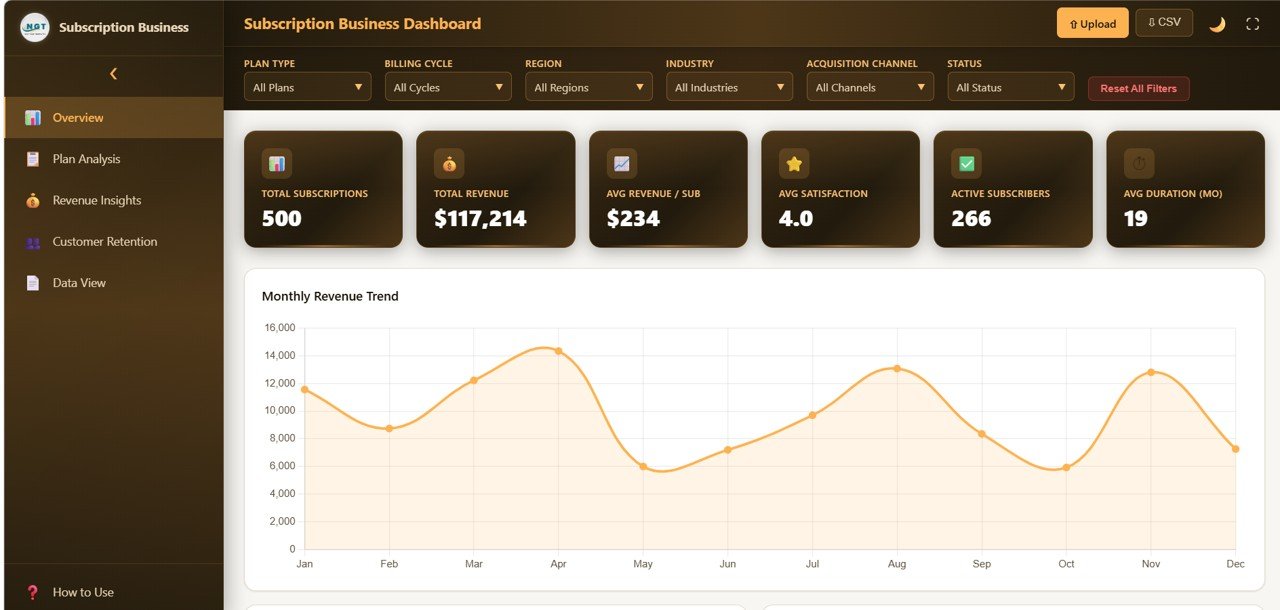
Page 1: Executive Overview
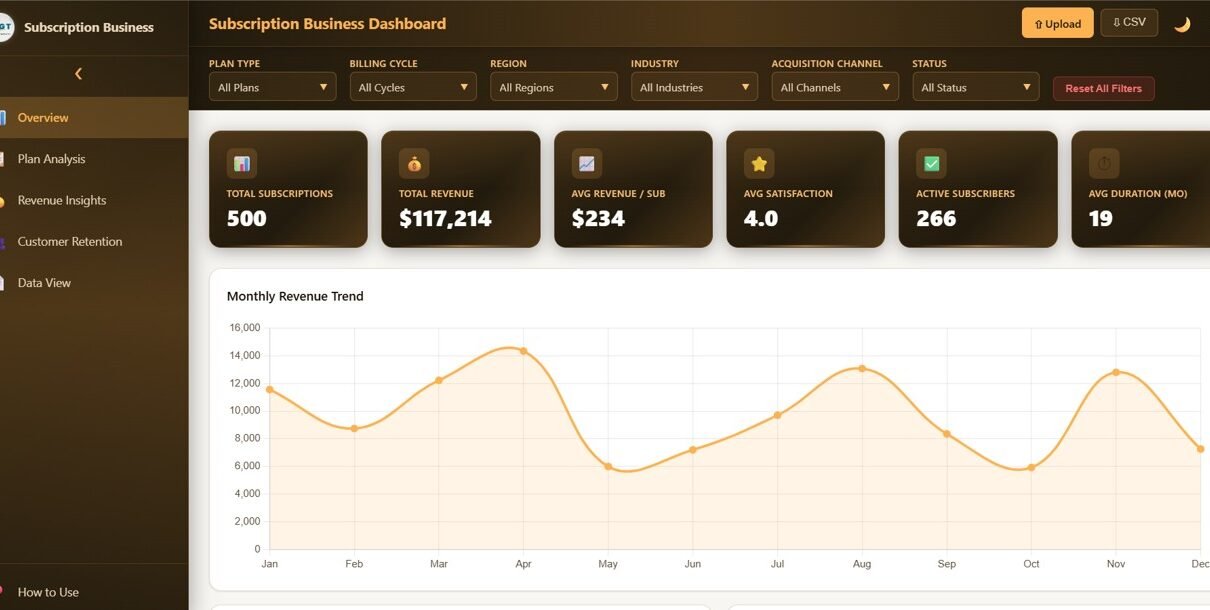
Subscription Business Dashboard in HTML Executive Overview Page — KPI Cards and Top-Level Trends
The Executive Overview page is your subscription business command center. At the top, 6 KPI cards display MRR, ARR, Active Subscribers, Churn Rate, ARPU, and Customer Lifetime Value — the metrics that matter most to founders, CFOs, and board members. Below the cards, trend charts visualize MRR Growth over time and Subscribers by Plan Tier, giving you an immediate pulse check on business health and trajectory.
Page 2: Revenue Analytics
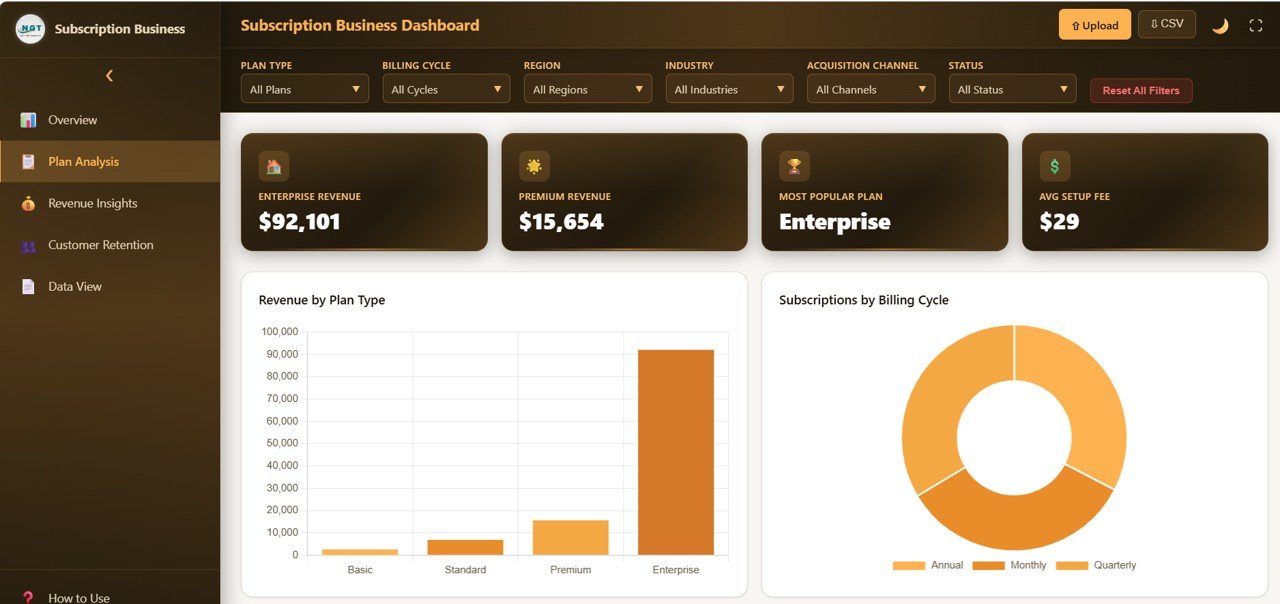
Revenue Analytics Page — Revenue Breakdown and MRR Trends
The Revenue Analytics page dives deep into where your subscription revenue comes from and how it is trending. Charts include Revenue by Subscription Plan, MRR Trend Analysis, Expansion and Contraction Revenue, ARPU Trend, and Revenue by Region. This page helps finance teams and founders understand revenue composition, identify upsell opportunities, and spot early warning signs of revenue contraction.
Page 3: Customer Analytics
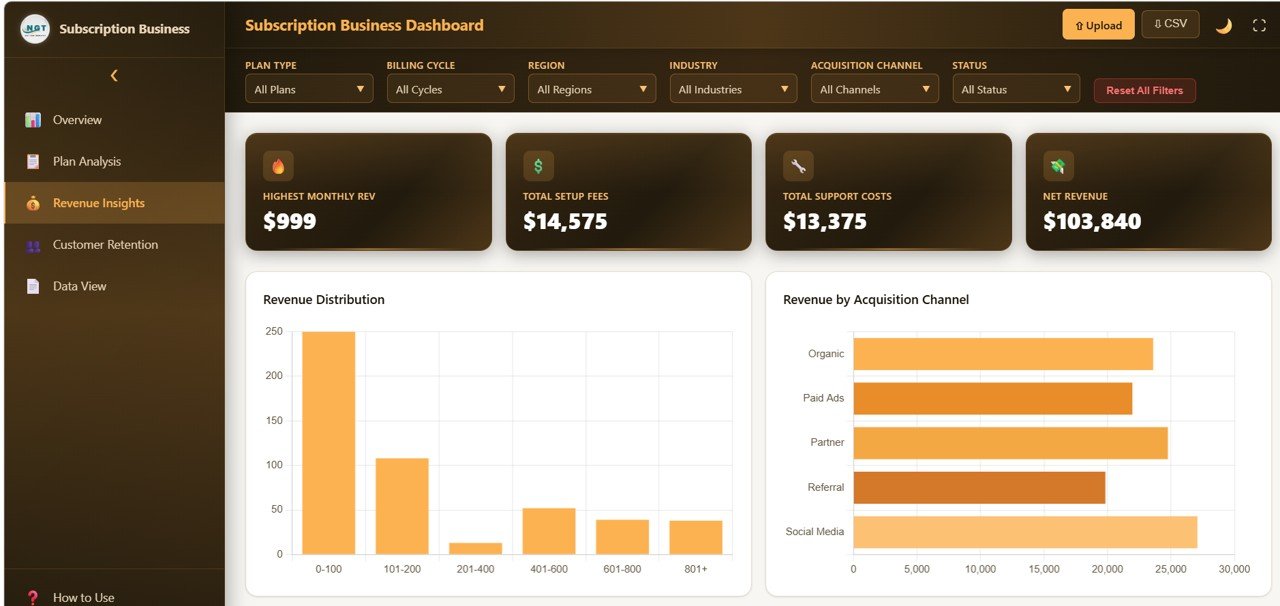
Customer Analytics Page — Subscriber Behavior and Retention
The Customer Analytics page visualizes subscriber behavior across your entire customer base. Key charts include New Subscribers vs Churned Subscribers, Net Subscriber Growth, Retention Rate by Cohort, Customer Segmentation by Plan, and Average Subscription Duration. Product managers and growth teams use this page to understand acquisition patterns, segment high-value customers, and measure engagement across different subscription tiers.
Page 4: Churn Analysis
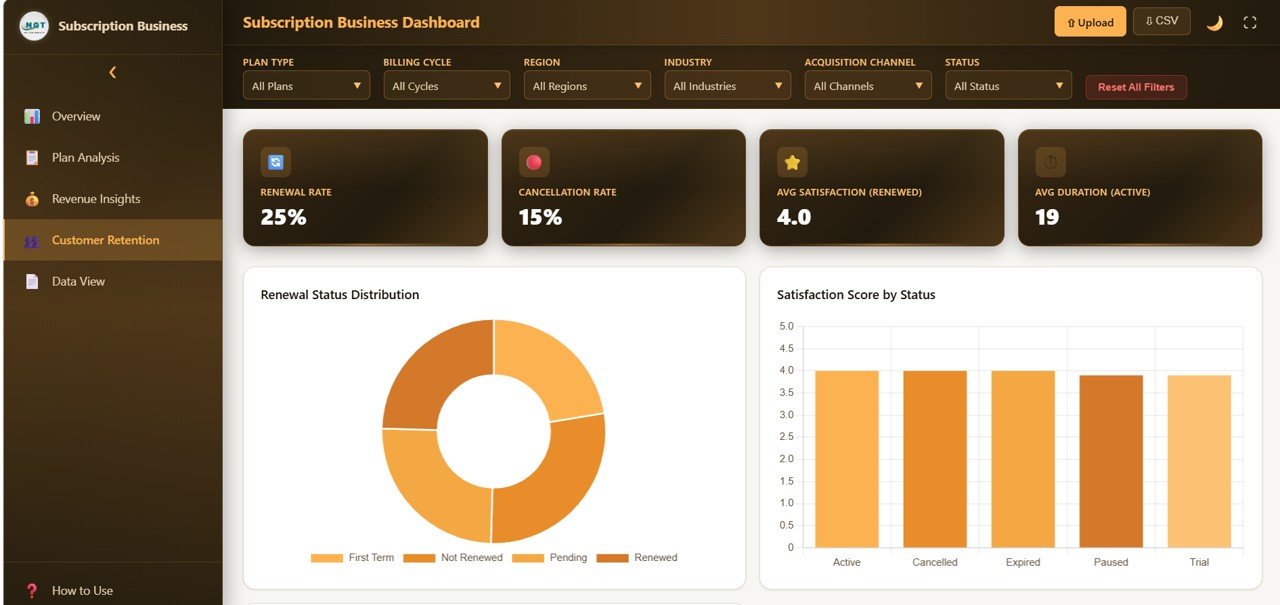
Churn Analysis Page — Attrition Metrics and At-Risk Identification
The Churn Analysis page is dedicated entirely to understanding and reducing customer attrition. It features Churn Rate Trend, Revenue Churn vs Logo Churn comparison, Churn Reasons Breakdown, At-Risk Subscriber Identification, and Churn by Plan Tier. For any subscription business, reducing churn by even a small percentage has a massive compounding impact on revenue — this page gives you the data to make that happen.
Page 5: Growth and Forecasting
Growth and Forecasting Page — Projections and CAC vs LTV
The Growth and Forecasting page provides forward-looking analytics including Subscriber Growth Projection, Revenue Forecast, Plan Migration Flow, Monthly Cohort Analysis, and Customer Acquisition Cost vs LTV Ratio. This is the page you bring to investor meetings and board reviews — it shows where your business is heading and whether your unit economics are sustainable.
Advantages of Subscription Business Dashboard in HTML
The biggest advantage of this template is its zero-dependency design. Unlike Excel or Power BI dashboards that require specific software, this HTML dashboard works on any device with a browser — Windows, Mac, Linux, even tablets. It loads instantly, handles data updates seamlessly, and produces professional-quality visuals that rival expensive BI tools.
The dedicated churn analysis page is a standout feature that many competing templates lack. Understanding why subscribers leave and identifying at-risk accounts before they cancel is critical for sustainable growth, and this dashboard gives you a structured framework to do exactly that.
With 5 pages covering the full subscription lifecycle — from acquisition to revenue to retention to growth — this template eliminates the need to juggle multiple spreadsheets or reports. Everything your team needs is in one file. For similar analytics in other formats, explore our HTML Dashboard Templates collection.
Opportunities for Improvement
While the dashboard covers all major subscription KPIs, businesses with complex pricing models (usage-based, hybrid, or multi-currency) may need to customize the data structure to accommodate additional pricing dimensions. The template currently focuses on plan-based subscription models.
Teams that need real-time data feeds from payment processors like Stripe, Chargebee, or Recurly would need to implement a custom data pipeline — the template works with static data files that you update manually or via export.
Adding custom cohort definitions beyond the standard monthly cohorts would require minor modifications to the JavaScript code, though this is straightforward for developers familiar with HTML and JS.
Best Practices for Using This Dashboard
- Update data weekly or monthly — Consistent data refreshes ensure your KPIs reflect current business reality and trend charts remain meaningful
- Focus on leading indicators — Use the Churn Analysis page to identify at-risk subscribers before they cancel rather than reacting after the fact
- Compare Revenue Churn vs Logo Churn — A low logo churn rate with high revenue churn signals that your highest-paying customers are leaving, which requires immediate attention
- Use cohort analysis for retention — The Customer Analytics page helps you compare retention across different signup cohorts to measure the impact of product changes and onboarding improvements
- Track CAC vs LTV ratio monthly — The Growth page makes it easy to monitor whether your acquisition spending is sustainable relative to customer lifetime value
- Share with stakeholders — Use the print function to create PDF snapshots for board decks, investor updates, and team meetings
Explore Relevant Templates
If you are looking for more subscription and SaaS analytics tools, check out these related templates from NextGenTemplates:
- SaaS Financial Model Dashboard in HTML — Financial modeling for SaaS companies with revenue projections, burn rate tracking, and investor metrics
- Startup Burn Rate Dashboard in HTML — Cash runway, expense tracking, and funding milestone visualization for startups
- Subscription Business Dashboard in Google Sheets — Cloud-based version for collaborative teams working in Google Workspace
- Subscription Business Dashboard in Power BI — Enterprise-grade analytics with Power BI’s native filtering and drill-down capabilities
- SaaS Metrics Dashboard in Google Sheets — Track SaaS metrics like MRR, ARR, and churn in a shareable Google Sheets format
Frequently Asked Questions
What KPIs does the Subscription Business Dashboard in HTML track?
The Subscription Business Dashboard in HTML tracks 6 core KPIs: Monthly Recurring Revenue (MRR), Annual Recurring Revenue (ARR), Active Subscribers, Churn Rate, Average Revenue Per User (ARPU), and Customer Lifetime Value (LTV). It also includes over 15 interactive charts covering revenue trends, subscriber segmentation, churn reasons, cohort retention, and growth forecasting across 5 dedicated dashboard pages.
Click here to Purchase Subscription Business Dashboard in HTML
Do I need coding or technical skills to use this dashboard?
No. Simply download the zip file, extract it, and open index.html in any web browser. The dashboard is fully built and functional. Replace the sample data in the data file with your own subscription metrics and all charts and KPI cards update automatically. No coding, no formulas, no technical setup required.
Can I customize this dashboard to match my company branding?
Yes. Since it is a standard HTML, CSS, and JavaScript file, you can modify colors, fonts, logos, and layout using any text editor. Basic CSS knowledge is helpful but not mandatory for simple brand customizations like changing the color scheme or adding your company logo.
What is the best HTML dashboard template for subscription businesses?
The Subscription Business Dashboard in HTML from NextGenTemplates is one of the most comprehensive options available. It includes 5 purpose-built pages covering executive metrics, revenue analytics, customer behavior, churn analysis, and growth forecasting with over 15 dynamic charts and 6 KPI cards — all in a zero-install browser-based format.
How often should I update the data in this dashboard?
For most subscription businesses, a weekly or monthly data refresh is ideal. Export your subscription metrics from your payment processor or CRM, update the data file, and all dashboard visualizations will reflect the latest numbers automatically.
Is this template compatible with mobile devices?
The dashboard is optimized for desktop and laptop browsers where it provides the best viewing experience for data-heavy analytics. It will open on mobile devices but the detailed charts and multi-page layout are best viewed on larger screens.
Conclusion
The Subscription Business Dashboard in HTML is the ultimate analytics companion for any business running on recurring revenue. With 5 interactive pages, 6 executive KPIs, and over 15 dynamic charts, it gives you complete visibility into revenue performance, customer behavior, churn patterns, and growth trajectory — all in a lightweight browser-based format that requires zero software installation.
Whether you are a solo SaaS founder, a finance team at a subscription box company, or an investor evaluating recurring revenue businesses, this template puts the data you need right at your fingertips.
Click here to Purchase Subscription Business Dashboard in HTML
Visit our YouTube channel for step-by-step tutorials: Youtube.com/@NeoTechNavigators