Gym Fitness Business Dashboard in HTML is a professional, browser-based analytics template designed for gym owners, fitness center managers, and personal training studios who want to monitor their entire business from a single interactive dashboard. This HTML dashboard includes 5 dedicated pages — Overview, Membership Analysis, Revenue Breakdown, Member Engagement, and Data View — giving you a comprehensive 360-degree view of your fitness operations without installing any software.
Whether you operate a single-location gym or manage a multi-branch fitness chain, this template empowers you with real-time insights into membership trends, revenue performance, class attendance, trainer effectiveness, and member satisfaction. Simply open the HTML file in any modern browser and start analyzing your gym’s performance instantly. This dashboard is available as part of the HTML Dashboard Templates collection at NextGenTemplates.com.
Key Features of Gym Fitness Business Dashboard in HTML
The Gym Fitness Business Dashboard in HTML is loaded with powerful features that make gym analytics accessible to everyone. This template includes 5 interactive dashboard pages, 6 high-level KPI cards, multiple interactive charts with slicers, and a full data table with search, sort, pagination, and CSV export capabilities. Here are the standout features that make this dashboard a must-have for any fitness business:
- 5 Interactive Dashboard Pages — Overview, Membership Analysis, Revenue Breakdown, Member Engagement, and Data View provide complete visibility into your gym operations.
- 6 KPI Cards on Overview — Track Total Members, Total Revenue, Avg Monthly Fee, Active Members, Avg Satisfaction, and Total Attendance at a glance.
- Interactive Slicers and Filters — Apply filters on the Overview page to instantly slice data by multiple dimensions for focused analysis.
- Searchable Data Table — The Data View page lets you search, sort, paginate, and export your complete dataset to CSV.
- Browser-Based — No software installation needed. Works in Chrome, Firefox, Edge, and Safari.
- Responsive Design — Access the dashboard from desktop, tablet, or mobile devices.
Dashboard Pages Explained
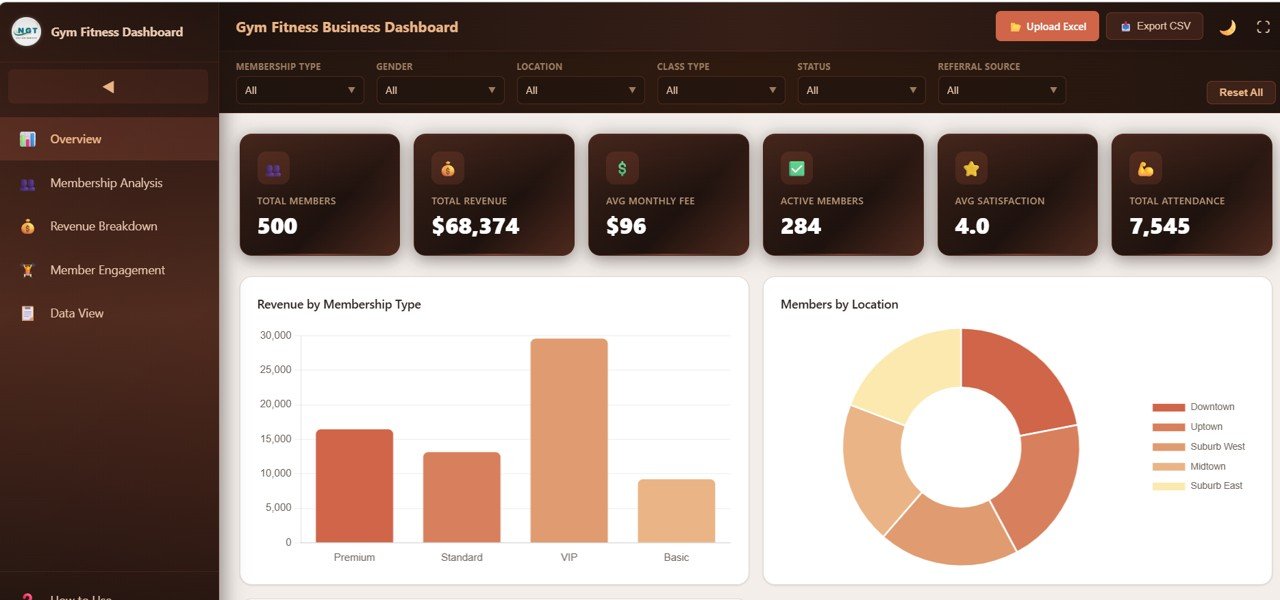
1. Overview Page
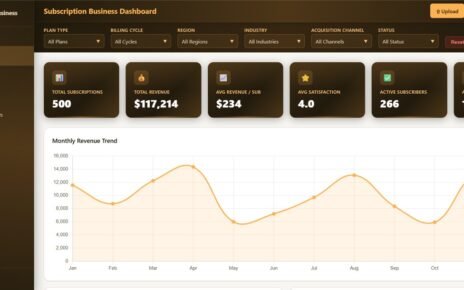
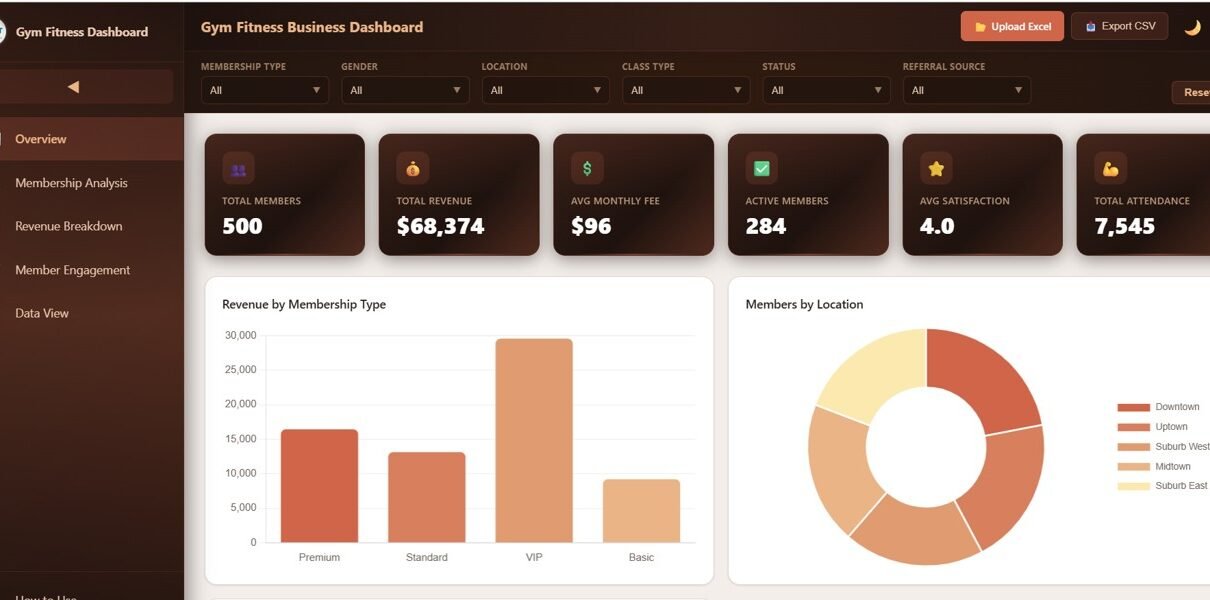
The Overview page serves as the command center for your gym business. At the top, 6 high-level KPI cards display Total Members, Total Revenue, Avg Monthly Fee, Active Members, Avg Satisfaction, and Total Attendance — giving you an instant snapshot of your business health. Below the cards, 5 interactive charts provide deep analytical insights: Revenue by Membership Type helps you understand which membership tiers drive the most income, Members by Location shows your member distribution across branches, Revenue by Class Type reveals which fitness classes generate the highest returns, Monthly Revenue Trend tracks your income trajectory over time, and Members by Status provides a clear breakdown of active versus inactive members. Multiple slicers on this page let you filter the entire dashboard instantly.
Gym Fitness Business Dashboard Overview2. Membership Analysis
The Membership Analysis page provides a detailed breakdown of your member base through 4 focused charts. Members by Membership Type shows the distribution across different membership plans such as Basic, Premium, and VIP. Average Fee by Membership Type reveals how much revenue each plan generates on average, helping you evaluate pricing strategy. Members by Gender provides demographic insights into your gym’s audience, while Revenue by Gender helps you understand income patterns across male and female members. Together, these charts give you a comprehensive picture of who your members are and how they contribute to your bottom line.
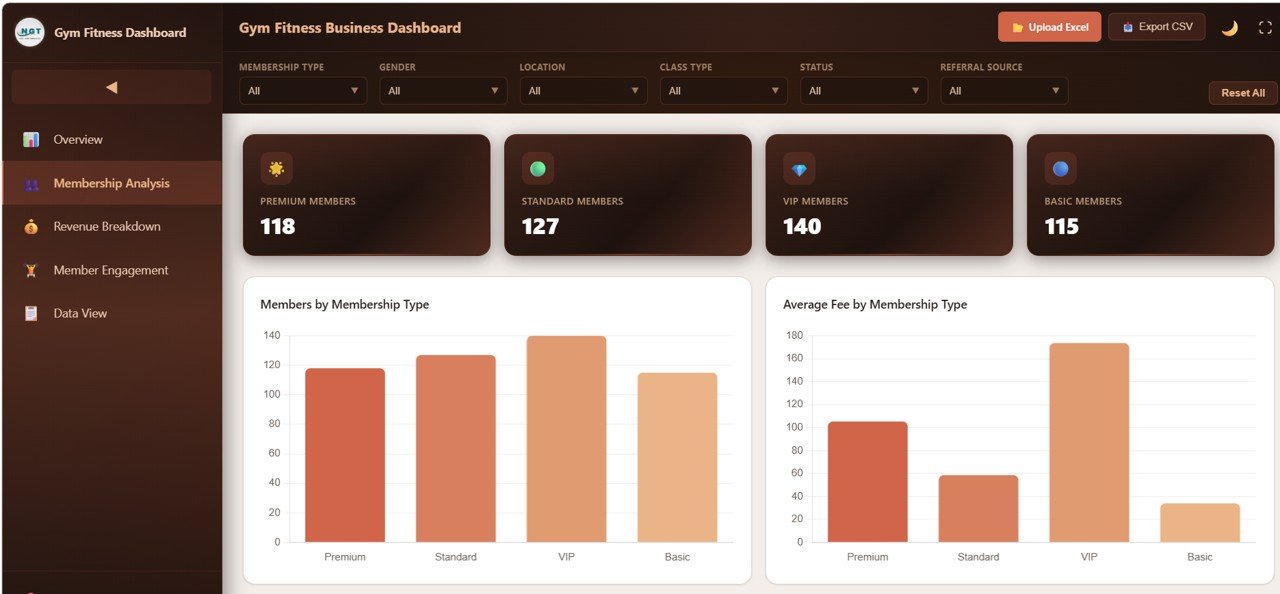 Membership Analysis
3. Revenue Breakdown
The Revenue Breakdown page analyzes your income sources through 4 insightful charts. Revenue Streams by Month tracks how different revenue categories perform over time, helping you spot seasonal trends and growth opportunities. Revenue by Location compares earnings across your gym branches so you can identify top-performing locations. Operating Cost by Location shows which branches cost the most to operate, enabling cost optimization. Revenue by Trainer reveals your highest-earning trainers, helping you recognize top performers and allocate resources effectively.
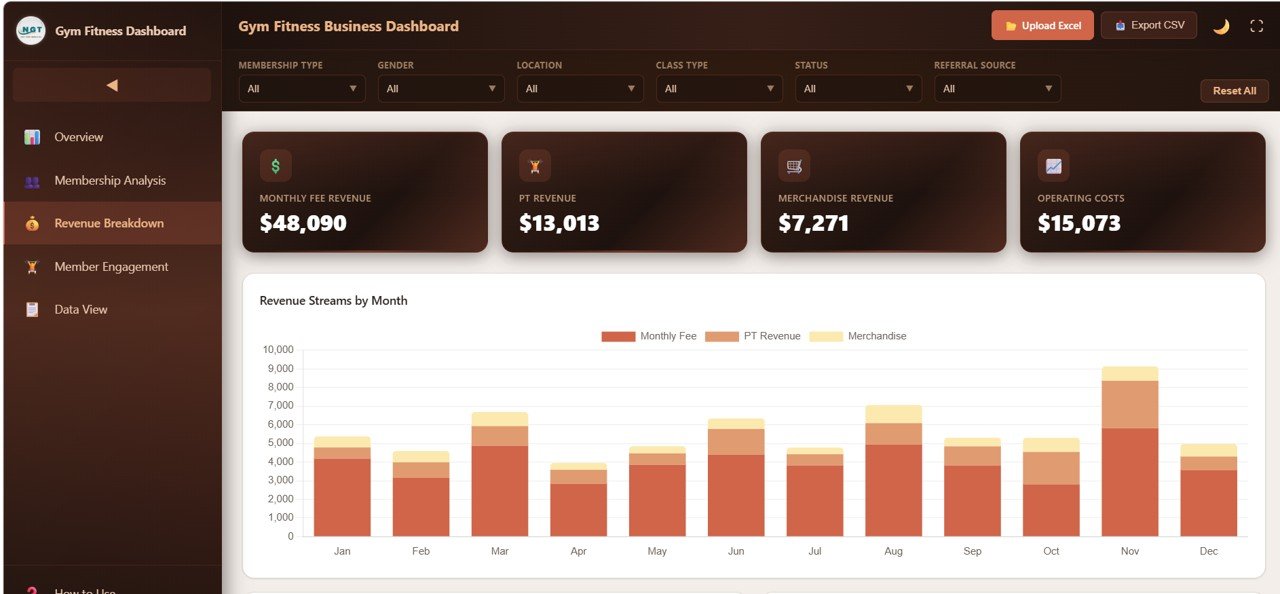 Revenue Breakdown
4. Member Engagement
The Member Engagement page focuses on participation and satisfaction metrics through 4 targeted charts. Attendance by Class Type shows which fitness classes attract the most members, helping you optimize class schedules. Satisfaction by Class Type reveals which programs keep members happiest, guiding your programming decisions. Attendance by Location compares visit patterns across branches, and Satisfaction by Membership Type shows which membership tiers have the most engaged and satisfied members.
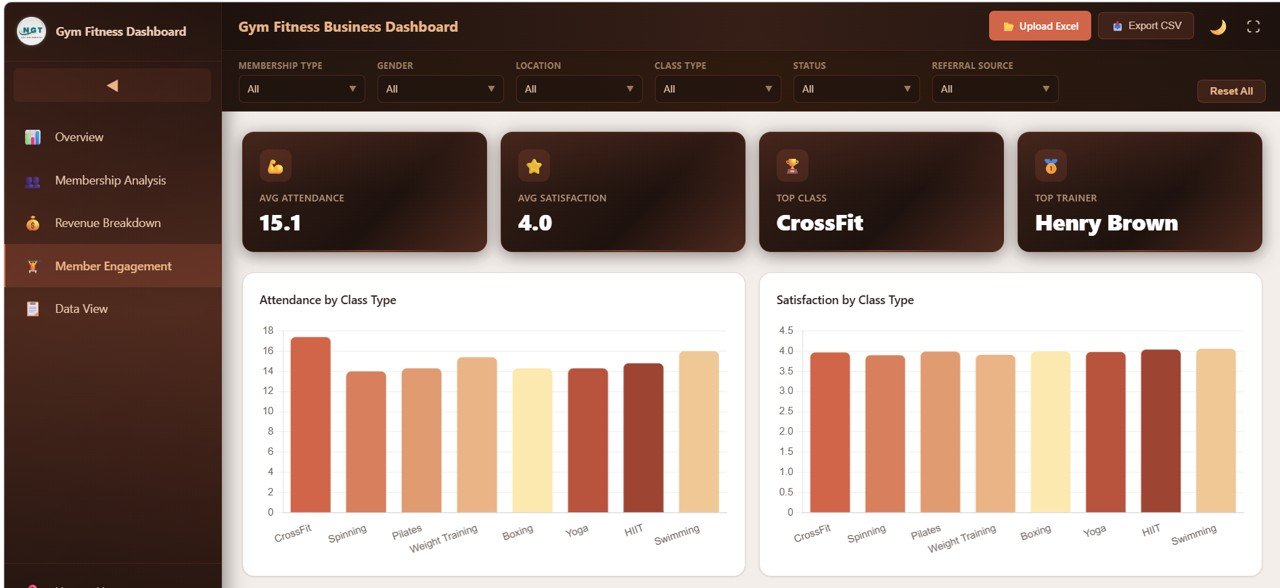 Member Engagement
5. Data View
The Data View page is a detailed data table that displays all your gym records in a structured, searchable format. You can search for specific members, sort by any column, navigate through pages using pagination, and export the filtered data to CSV for further analysis. This page is perfect for when you need to drill down into individual member records or extract specific subsets of data for reporting.
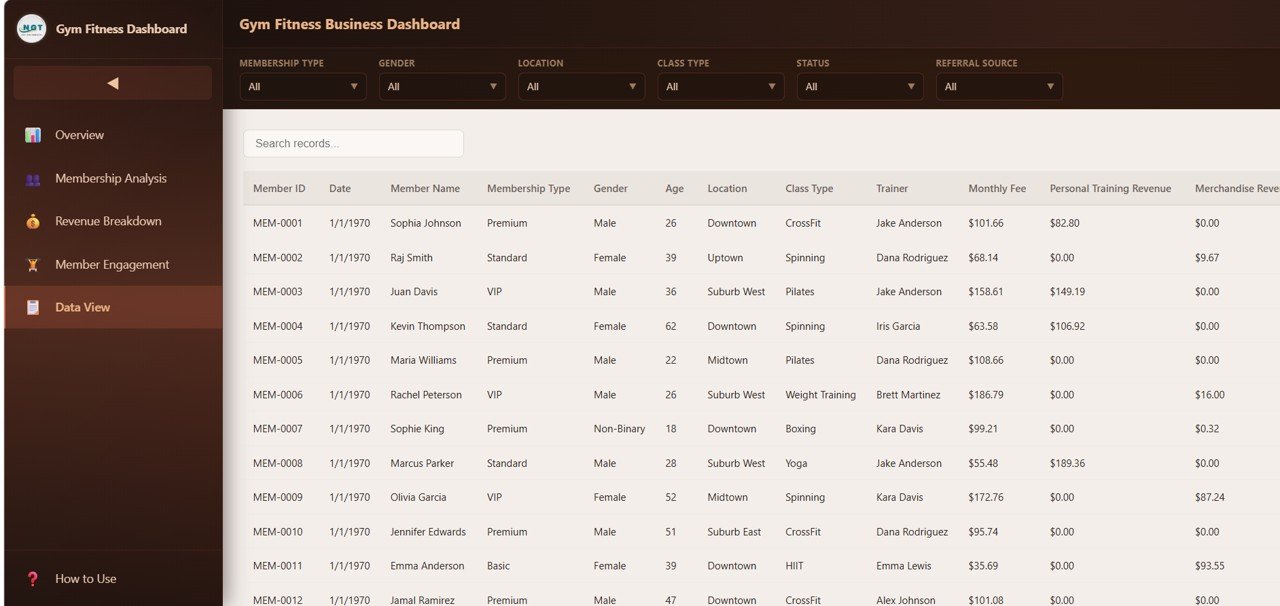 Data View
Advantages of Gym Fitness Business Dashboard in HTML
- Zero Installation Required — Unlike Excel or Power BI dashboards, this HTML template runs directly in any web browser with no additional software needed.
- Instant Visual Insights — 6 KPI cards and 17+ interactive charts across 5 pages transform raw data into actionable business intelligence.
- Multi-Location Support — Compare revenue, costs, attendance, and satisfaction across multiple gym branches in a single view.
- Data Export — The Data View page allows you to export filtered records to CSV, making it easy to share data with accountants or partners.
- Mobile-Friendly — Responsive design ensures the dashboard works on any screen size from desktop monitors to smartphone browsers.
Opportunities for Improvement
- Adding more advanced date range filters would allow users to analyze performance over custom time periods rather than preset monthly views.
- Including a dedicated Trainer Analysis page with individual trainer scorecards could help fitness managers evaluate performance more granularly.
- Integration with Google Sheets or a backend database would enable real-time data synchronization without manual file updates.
Best Practices for Using This Dashboard
- Update your data file weekly or monthly to keep the dashboard current and relevant for decision-making.
- Start with the Overview page to get a high-level snapshot, then navigate to specific analysis pages based on the areas you want to investigate.
- Use the slicers on the Overview page to compare specific membership types or locations side by side.
- Export data from the Data View page for presentations, board meetings, or sharing with business partners.
- Compare this HTML version with the Gym Fitness Business Dashboard in Excel or the Power BI version to determine which platform best fits your workflow.
Explore Relevant Templates
- Gym Fitness Business Dashboard in Excel — The Excel version with pivot tables and automated charts.
- Gym Fitness Business Dashboard in Google Sheets — Cloud-based version with search sheet and formulas.
- Gym Fitness Business Dashboard in Power BI — Advanced Power BI version with DAX measures.
- Fitness Industry KPI Scorecard in Google Sheets — MTD/YTD KPI tracking with trend charts.
- Fitness Studios Dashboard in Excel — Studio-specific analytics with class and trainer tracking.
Frequently Asked Questions
What is the best HTML dashboard template for tracking gym business performance?
The Gym Fitness Business Dashboard in HTML is one of the best HTML-based gym analytics templates available. It includes 5 interactive pages with 6 KPI cards, interactive charts, slicers, and a searchable data table, all running in any modern browser without installation.
How many KPIs does this gym dashboard track?
The dashboard tracks 6 primary KPIs on the Overview page: Total Members, Total Revenue, Avg Monthly Fee, Active Members, Avg Satisfaction, and Total Attendance. Additional metrics are analyzed across Membership Analysis, Revenue Breakdown, and Member Engagement pages.
Do I need coding skills to customize this HTML dashboard?
No coding is required for basic use. Simply replace the sample data in the data file with your own gym records. For advanced customizations like adding new charts or changing colors, basic HTML and JavaScript knowledge would be helpful.
Can I track multiple gym locations with this dashboard?
Yes. The dashboard includes location-based analysis on multiple pages including Members by Location, Revenue by Location, Operating Cost by Location, and Attendance by Location. You can compare all your branches from a single dashboard view.
How does the Data View page work?
The Data View page displays all gym records in a structured table format with search functionality, column sorting, pagination for easy navigation, and a CSV export button for downloading filtered data to use in other applications.
Is this dashboard compatible with all browsers?
Yes. The Gym Fitness Business Dashboard in HTML works in all modern browsers including Google Chrome, Mozilla Firefox, Microsoft Edge, and Apple Safari on both desktop and mobile devices.
Conclusion
The Gym Fitness Business Dashboard in HTML is a powerful, no-installation-required analytics solution that gives gym owners and fitness managers complete visibility into their business performance. With 5 interactive pages, 6 KPI cards, and a searchable data table, this template transforms your raw gym data into actionable insights you can act on immediately. Whether you are tracking membership growth, analyzing revenue streams, evaluating class performance, or comparing branch-level metrics, this dashboard has you covered.
Click here to Purchase the Gym Fitness Business Dashboard in HTML
🎥 Visit our YouTube channel for step-by-step tutorials: Youtube.com/@NeoTechNavigators