According to a 2025 CB Insights analysis, 38% of startups fail because they run out of cash — and 74% of seed-stage founders admit they don’t track key financial and growth metrics consistently. The Startup Growth KPI Scorecard in Google Sheets gives founders a ready-to-use scorecard that tracks 20+ KPIs across 4 interconnected sheets, with month-to-date and year-to-date trend charts, automatic actual-vs-target comparisons, and prior-year benchmarking — all in a browser-based spreadsheet that costs $8.99 one-time.
Whether you’re reporting monthly growth numbers to investors, monitoring burn rate before your next funding round, or standardizing KPI definitions across a 15-person team, this scorecard replaces the $49–$249/month SaaS analytics tools with a Google Sheets template you can customize and share in under 10 minutes. In this article, we walk through every sheet, explain the key features, and show you exactly how to set it up for your startup.
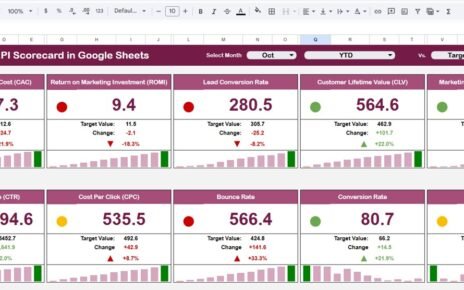
 Startup Growth KPI Scorecard in Google Sheets
Key Features of Startup Growth KPI Scorecard in Google Sheets
The Startup Growth KPI Scorecard in Google Sheets tracks 20+ customizable KPIs including MRR, ARR, customer acquisition cost, churn rate, burn rate, runway months, NPS, and revenue per employee. All metrics update automatically when you replace the sample data with your own numbers — no manual formula editing needed.
The scorecard uses dropdown-driven navigation across all 4 sheets. On the main Scorecard sheet, select any month and toggle between MTD and YTD views. On the KPI Trend sheet, pick any individual KPI to see its 12-month trend with Actual, Target, and Prior Year lines overlaid. Color-coded conditional formatting highlights underperforming metrics in red and on-track metrics in green, so leadership teams spot issues at a glance.
Every KPI is fully documented in the KPI Definition sheet — including its group, unit of measurement, type (Lower the Better or Upper the Better), calculation formula, and business definition. This means new team members or investor analysts can understand exactly what each metric measures without asking the founder to explain.
The template also includes prior-year benchmarking columns so you can run a three-way comparison: this month’s actual vs. this month’s target vs. the same month last year. This is especially useful for Series A pitch decks where investors want to see year-over-year growth acceleration.
Sheets Explanation
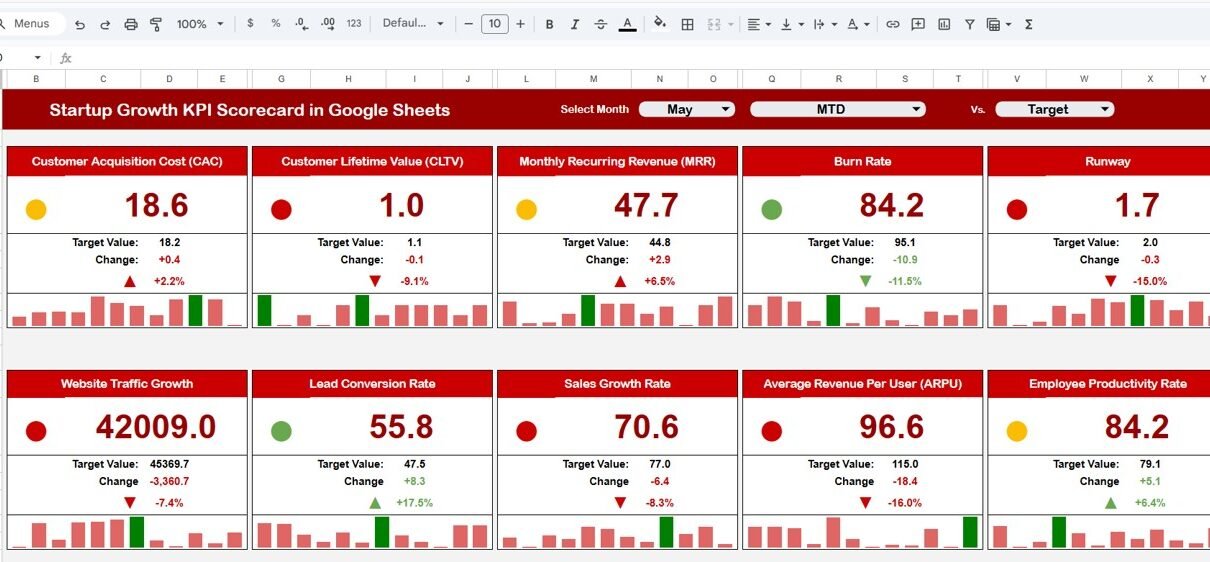
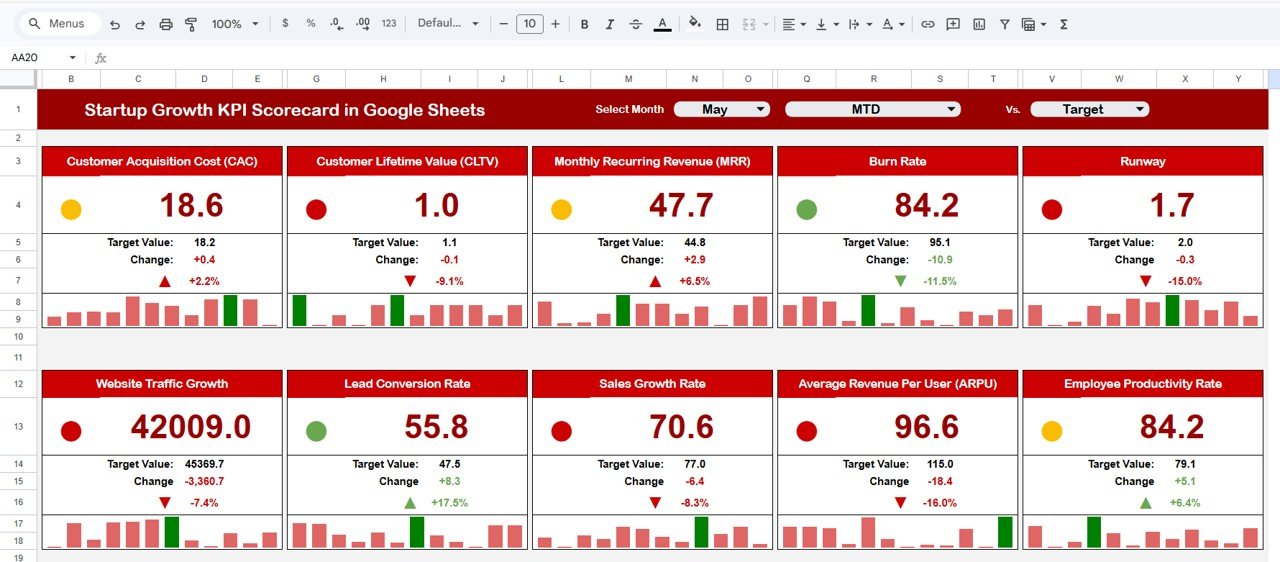
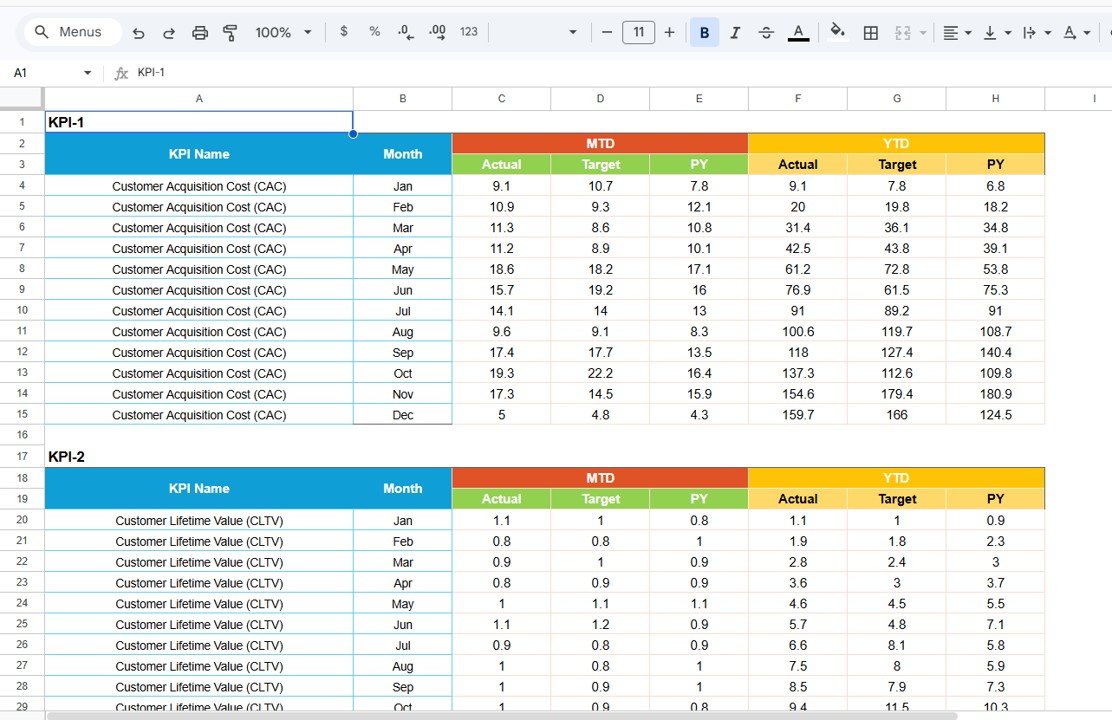
1. Scorecard Sheet
The Scorecard sheet is the main interface where you view KPI performance at a glance. It includes dropdown menus to select the month, MTD (Month-to-Date), or YTD (Year-to-Date) for performance analysis. Each KPI row shows the actual value alongside the target value, with visual indicators using color-coded conditional formatting. The sheet provides a single view of all relevant KPI information — actual, target, variance, MTD comparison, and YTD comparison — so you never need to switch between tabs during a board meeting.
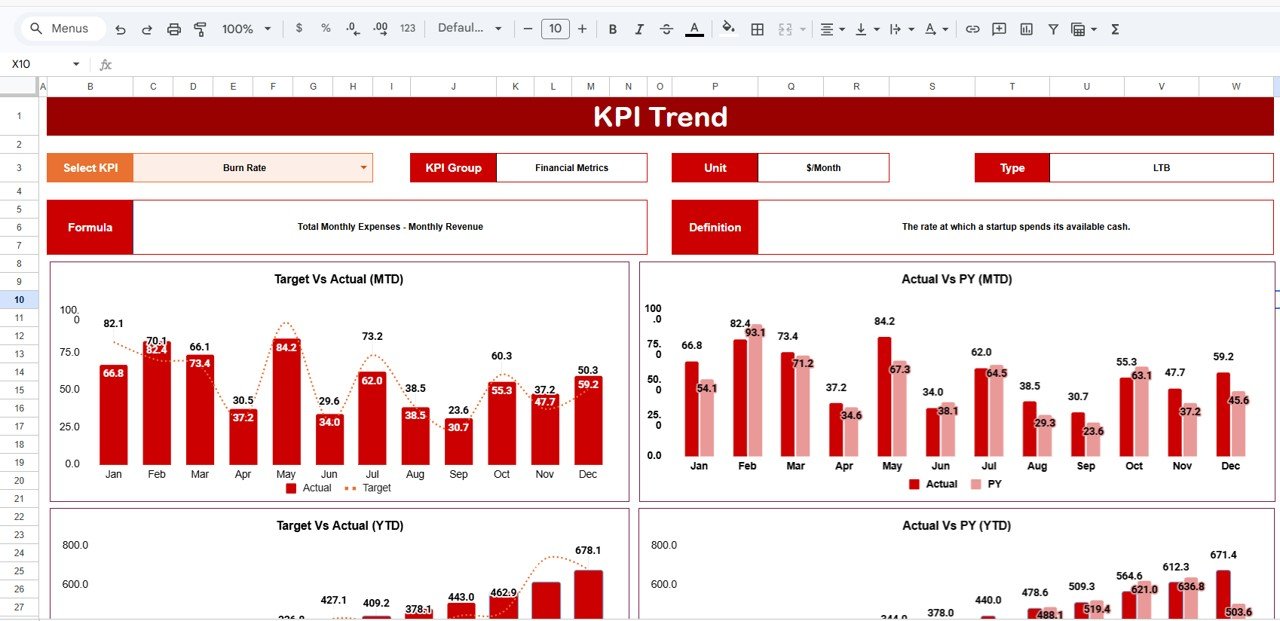
Startup Growth KPI Scorecard in Google Sheets2. KPI Trend Sheet
The KPI Trend sheet lets you deep-dive into any single metric. Select the KPI name from the dropdown on cell C3, and the sheet displays the KPI Group, Unit, Type (Lower the Better or Upper the Better), Formula, and Definition. Below the metadata, MTD and YTD trend charts plot Actual, Target, and Prior Year numbers over 12 months. This view is essential for identifying seasonal patterns, acceleration, or deceleration in individual metrics before they show up in the aggregate scorecard.
 KPI Trend Sheet
3. Input Data Sheet
The Input Data sheet is where you enter all KPI data — actual values, targets, and prior-year figures for each month. The layout is structured so you can record metrics as new results become available, and the scorecard and trend pages reflect updates immediately. There are no complex formulas to maintain here; it is a clean data-entry interface that feeds the rest of the template.
 Input Data Sheet
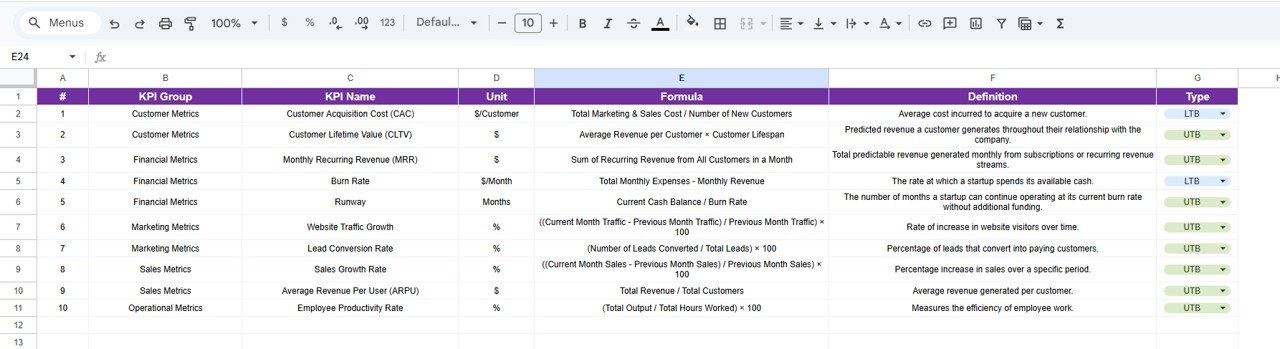
4. KPI Definition Sheet
In the KPI Definition sheet, you document every metric’s name, group (e.g., Growth, Revenue, Efficiency), unit of measurement (%, $, #), calculation formula, and business definition. This sheet serves as your team’s shared reference, ensuring everyone — from the CEO to a new operations hire — uses the same metric definitions. If you add a new KPI, just add a row here and in the Input Data sheet, and the scorecard picks it up automatically.
 KPI Definition Sheet
Startup Growth KPI Scorecard vs. Microsoft Excel vs. Paid SaaS — Feature Comparison
| Feature | Startup Growth KPI Scorecard (Google Sheets) | Microsoft Excel Dashboard | Baremetrics / ChartMogul |
|---|---|---|---|
| Cost | $8.99 one-time | $14.99+ one-time (separate purchase) | $49–249 / month |
| Platform | Google Sheets (browser-based) | Desktop Excel required | Cloud SaaS |
| Setup Time | Under 10 minutes | 10–15 minutes | 30–60 minutes + API integration |
| Real-Time Team Collaboration | Yes — built into Google Sheets | Limited (OneDrive required) | Yes |
| Mobile Access | Google Sheets mobile app | Limited on mobile | Browser / app |
| Customizable KPIs | Add/edit any KPI freely | Requires formula edits | Fixed to billing integrations |
| Share with Link | One click | Requires file sharing | Yes |
| Year-1 Cost (5 users) | $8.99 total | $14.99 total | $588–$2,988 |
| Prior Year Benchmarking | Built-in PY column | Manual setup needed | Varies by plan |
For startup founders who want structured KPI tracking without paying $49+/month for analytics SaaS, the Startup Growth KPI Scorecard in Google Sheets sits in the sweet spot.
Who Should Use This Template
Perfect for:
- Seed-to-Series-A startup founders tracking monthly growth metrics across revenue, users, and burn rate
- Operations leads at 5–100 person startups who report KPIs to investors or board members monthly
- Startup accelerator managers monitoring cohort performance across multiple portfolio companies
- Finance managers at early-stage companies who need actual-vs-target tracking without dedicated BI tools
Not a fit if:
- You need real-time API integrations with Stripe, Mixpanel, or HubSpot — use Baremetrics or ChartMogul
- You’re tracking 100+ KPIs across 10+ departments — consider a dedicated Power BI or Tableau setup
- You require SOC 2 compliance and formal audit trails for institutional investor reporting
Real-World Use Cases
Click here to Purchase the Startup Growth KPI Scorecard in Google Sheets
Ravi runs a 15-person fintech startup in Bangalore. He uses the Startup Growth KPI Scorecard to track MRR, customer acquisition cost, and churn rate monthly. Before board meetings, he toggles to YTD view and shares the Google Sheet link with his investors — replacing the $99/month Baremetrics subscription he was paying for basic metric tracking.
Jessica manages a startup accelerator in Austin with 12 portfolio companies. She duplicates the scorecard for each startup and uses the KPI Definition sheet to standardize metrics across the cohort. The prior-year benchmarking helps her compare each company’s Q1 2026 performance against Q1 2025 — a feature that cost her $200/month on ChartMogul.
Tomás is the COO of a 40-person edtech startup in Mexico City. He enters weekly user growth, NPS scores, and revenue per employee into the Input Data sheet every Monday. The color-coded scorecard flags any metric below 80% of target in red, so his leadership team spots issues before they escalate.
Advantages of Startup Growth KPI Scorecard in Google Sheets
- Zero learning curve — anyone who can use Google Sheets can use this scorecard. No BI tool training, no SQL, no API configuration.
- Real-time collaboration — share the scorecard with your co-founder, CFO, or investors via a single link. Everyone sees the same data simultaneously.
- Full customization — add, rename, or remove any KPI. Change groups, units, and formulas in the Definition sheet and the entire scorecard adapts.
- Cost savings — $8.99 one-time replaces $588–$2,988/year in SaaS subscriptions for a 5-person team.
- Investor-ready format — the MTD/YTD toggle and prior-year columns produce the exact comparisons investors ask for in monthly updates and board decks.
Opportunities for Improvement
- No API integration — data entry is manual. If you use Stripe, Mixpanel, or Google Analytics, you’ll need to copy numbers into the Input Data sheet rather than pulling them automatically.
- No role-based permissions — Google Sheets sharing is all-or-nothing (view or edit). You can’t restrict certain users from seeing specific KPIs within the same sheet.
- Chart interactivity is limited — Google Sheets charts don’t support hover tooltips or drill-through the way Power BI or Tableau dashboards do.
- Performance with large datasets — if you track 50+ KPIs across 36+ months of history, the sheet may slow down. For that scale, a Power BI dashboard is a better fit.
Best Practices
Click here to Purchase the Startup Growth KPI Scorecard in Google Sheets
- Update data on a fixed schedule — enter actuals every Monday or the 1st of each month. Consistent data entry makes trend analysis reliable.
- Define KPIs before entering data — fill in the KPI Definition sheet first so every team member understands what each metric means and how it’s calculated.
- Use the prior-year column — even if your startup is less than 2 years old, enter available PY data. Year-over-year comparisons are the strongest signal investors look for.
- Share view-only links for external stakeholders — give investors and advisors view access so they can see real-time metrics without accidentally editing cells.
- Duplicate the scorecard quarterly — at the end of each quarter, duplicate the sheet as a snapshot for your records before resetting targets for the next period.
Explore Relevant Templates
If the Startup Growth KPI Scorecard fits your needs, these related templates on NextGenTemplates.com may also help:
- SaaS Metrics Dashboard in Google Sheets — Track MRR, churn, LTV, and CAC with interactive charts and automated calculations built for SaaS founders.
- Startup Burn Rate Dashboard in Google Sheets — Monitor monthly burn rate, cash runway, and expense breakdowns with visual trend analysis.
- E-commerce KPI Scorecard in Google Sheets — Similar scorecard structure for e-commerce businesses tracking conversion rates, AOV, and revenue metrics.
- SaaS Financial Model Dashboard in Google Sheets — Full financial modeling with revenue projections, scenario planning, and investor-ready outputs.
- Expense Management KPI Dashboard in Google Sheets — Track expense categories, budget utilization, and cost trends with automated dashboards.
Browse all Google Sheets Dashboard Templates
Also available in other formats:
Frequently Asked Questions
Click here to Purchase the Startup Growth KPI Scorecard in Google Sheets
What KPIs does the Startup Growth KPI Scorecard track?
The Startup Growth KPI Scorecard in Google Sheets tracks 20+ customizable KPIs including MRR, ARR, customer acquisition cost, churn rate, burn rate, runway months, NPS, and revenue per employee. You define every KPI in the Definition sheet — add, remove, or rename any metric to match your startup’s stage.
How long does it take to set up this scorecard?
Setup takes under 10 minutes. Click the Google Sheets copy link from the PDF guide, enter your KPI definitions, paste your monthly data into the Input Data sheet, and the Scorecard and Trend pages update automatically. No formulas to write.
Can I share this scorecard with my investors?
Yes. Since it runs in Google Sheets, click Share and send a view-only or edit link to investors, board members, or co-founders. Everyone sees the same real-time data without installing anything.
How does this compare to Baremetrics or ChartMogul?
Baremetrics starts at $49/month and ChartMogul at $99/month — both require Stripe or billing API integration. The Startup Growth KPI Scorecard costs $8.99 one-time, works with any data you enter manually, and gives you full control over which KPIs to track without API dependencies.
Does this template work on mobile?
Yes. Google Sheets runs on the mobile app for iOS and Android and any mobile browser. The dropdowns and conditional formatting work on mobile, though the desktop view offers the best experience for trend charts.
Can I add more KPIs beyond the defaults?
Yes. Go to the KPI Definition sheet, add a new row with the KPI name, group, unit, formula, and definition. Then add the corresponding data in the Input Data sheet. The Scorecard and Trend pages pick up the new KPI automatically.
Is this a one-time purchase or a subscription?
One-time purchase. Pay $8.99 once and get lifetime access. No monthly fees, no per-user charges, no renewal costs. Download the file, make a copy in Google Drive, and it is yours forever.
About the Author
Built by PK — Microsoft Certified Professional with 15+ years of Excel, Google Sheets, and Power BI experience. Founder of NextGenTemplates, reaching 300K+ subscribers across YouTube channels (@PK-AnExcelExpert, @NextGenTemplates, @NeoTechNavigators). Every template is hand-built and tested before release.
Conclusion
The Startup Growth KPI Scorecard in Google Sheets gives founders a structured, investor-ready way to track 20+ growth metrics without paying monthly SaaS fees. With dropdown-driven navigation, automatic MTD/YTD calculations, prior-year benchmarking, and full KPI documentation in one place, it’s built for the way early-stage teams actually operate — fast, lean, and collaborative. For more tutorials and walkthroughs, visit Youtube.com/@NeoTechNavigators.
Click here to Purchase the Startup Growth KPI Scorecard in Google Sheets
Instant download · One-time payment · No subscription