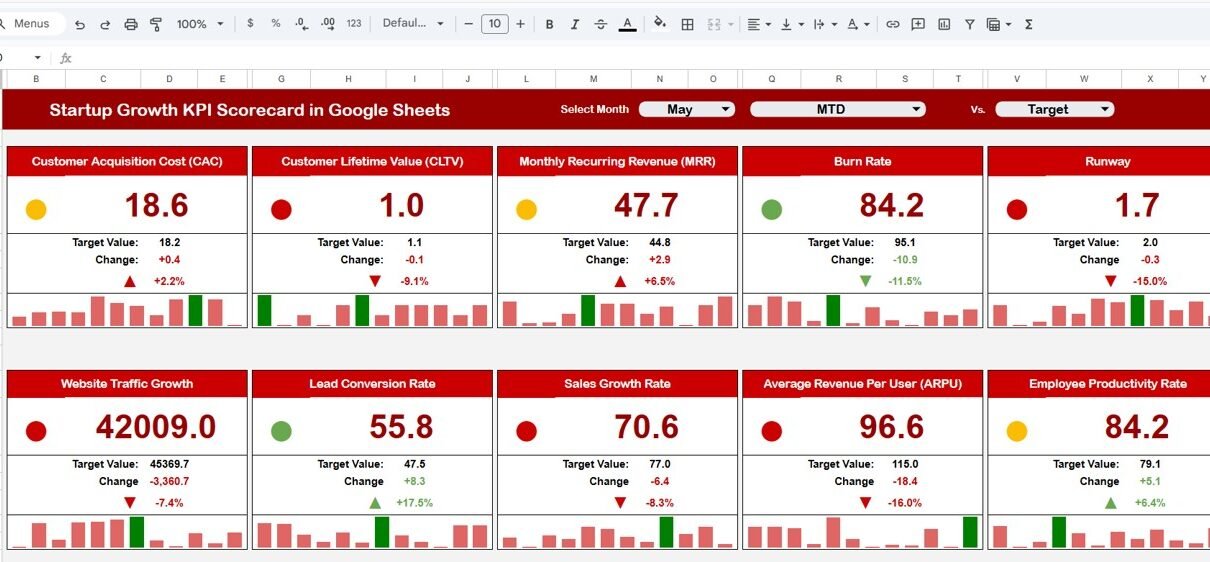
Track 20+ startup KPIs including MRR, churn rate, CAC, and burn rate with MTD/YTD trend analysis, actual vs target comparisons, and prior-year benchmarking in this ready-to-use Google Sheets scorecard template.
Online Tutorial for Data Analysis and Automation
Track 20+ startup KPIs including MRR, churn rate, CAC, and burn rate with MTD/YTD trend analysis, actual vs target comparisons, and prior-year benchmarking in this ready-to-use Google Sheets scorecard template.
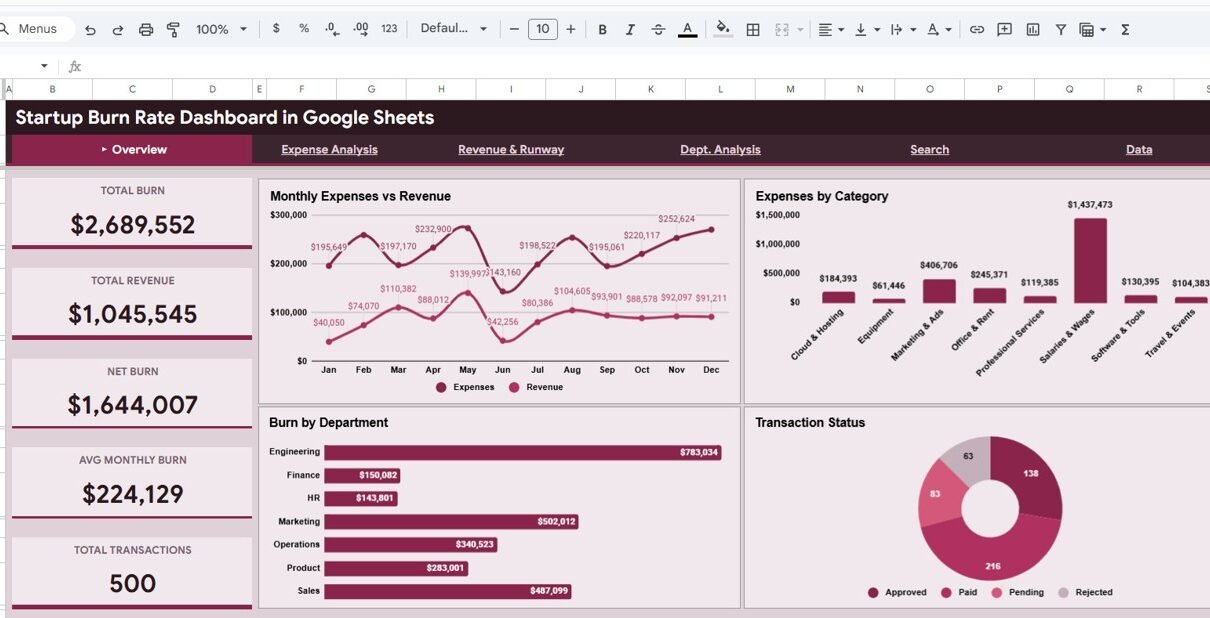
Track your startup’s burn rate, expenses, revenue, and financial runway with this interactive Google Sheets dashboard featuring 5 pages, 5 KPI cards, dynamic charts, and smart search functionality.