Construction projects generate 30% cost overruns on average when timelines and budgets are tracked manually or across disconnected tools. The Construction Project Timeline in Google Sheets consolidates task scheduling, budget tracking, inspection logging, and Gantt chart visualization into a single spreadsheet with 5 interactive pages, 20+ charts, and slicer filters — all for a one-time cost of $6.99.
Whether you manage residential builds, commercial fit-outs, or renovation projects, this template replaces the need for Smartsheet or Monday.com subscriptions. It runs entirely in Google Sheets, so every team member, contractor, and stakeholder can view real-time progress from any device without installing software or paying per-seat license fees.
Key Features of Construction Project Timeline in Google Sheets
👉 Click here to Purchase the Construction Project Timeline in Google Sheets
The Construction Project Timeline in Google Sheets delivers 5 dedicated pages that cover the full lifecycle of a construction project — from task scheduling and Gantt chart visualization to budget analysis and quality inspection tracking.
- 5 KPI Cards on the Overview Page – Overall Completion percentage, Tasks Completed count, Days Remaining until deadline, Total Budget, and Budget Variance Savings update automatically from your project data
- 20+ Pre-Built Charts – Charts cover Tasks by Phase, Budget by Phase, Actual Cost by Contractor, Percent Complete by Phase, Variance by Phase, Task Duration by Phase, Task Progress by Month, Inspections by Phase, and more
- Built-In Gantt Chart View – The Gantt View page visualizes task durations, phase groupings, monthly progress, and percent-complete indicators using native Google Sheets features — no add-ons required
- Budget and Change Order Tracking – The Budget page tracks Planned Budget by Phase, Actual Cost by Phase, Variance by Phase, Change Orders by Item, and Net Budget Position by Category
- Inspection Log with Follow-Up Tracking – Record inspections by phase, result, and inspector. Charts track Inspections by Phase, Inspections by Result, Inspections by Inspector, and Follow-Up Inspections by Phase
- Slicer Filters on Every Page – Filter by phase, contractor, status, date range, or task type using native Google Sheets slicers
- Real-Time Collaboration – Share the Google Sheet with contractors, subcontractors, and project owners for simultaneous viewing and editing
For complementary construction templates, see the Construction Project Schedule Calendar in Google Sheets and the Construction Project Cost Dashboard in Google Sheets.
Dashboard Pages Explanation
👉 Click here to Purchase the Construction Project Timeline in Google Sheets
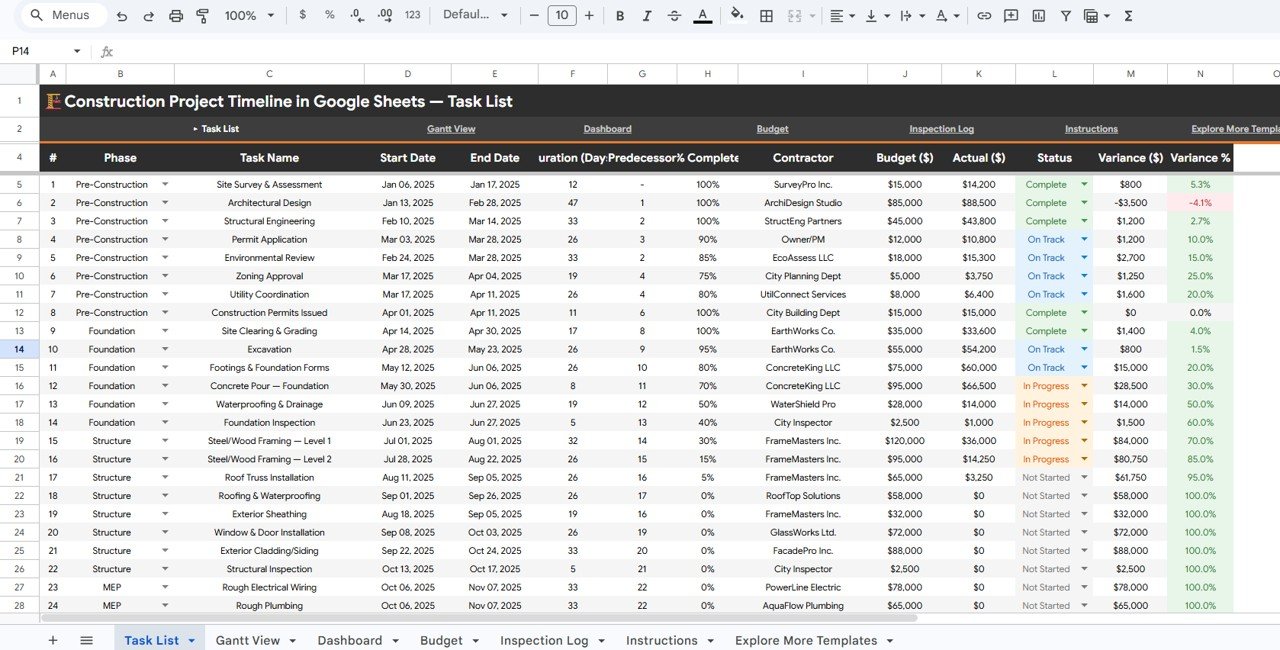
1 – Overview Page
The Overview page serves as the project command center. At the top, 5 KPI cards display Overall Completion, Tasks Completed, Days Remaining, Total Budget, and Budget Variance Savings. Below the cards, interactive charts show Tasks by Phase, Budget by Phase, Actual Cost by Contractor, Percent Complete by Phase, and Variance by Phase. Multiple slicers let you filter the entire view by phase, contractor, or status for instant drill-down into specific segments of your construction project.
Construction Project Timeline in Google Sheets
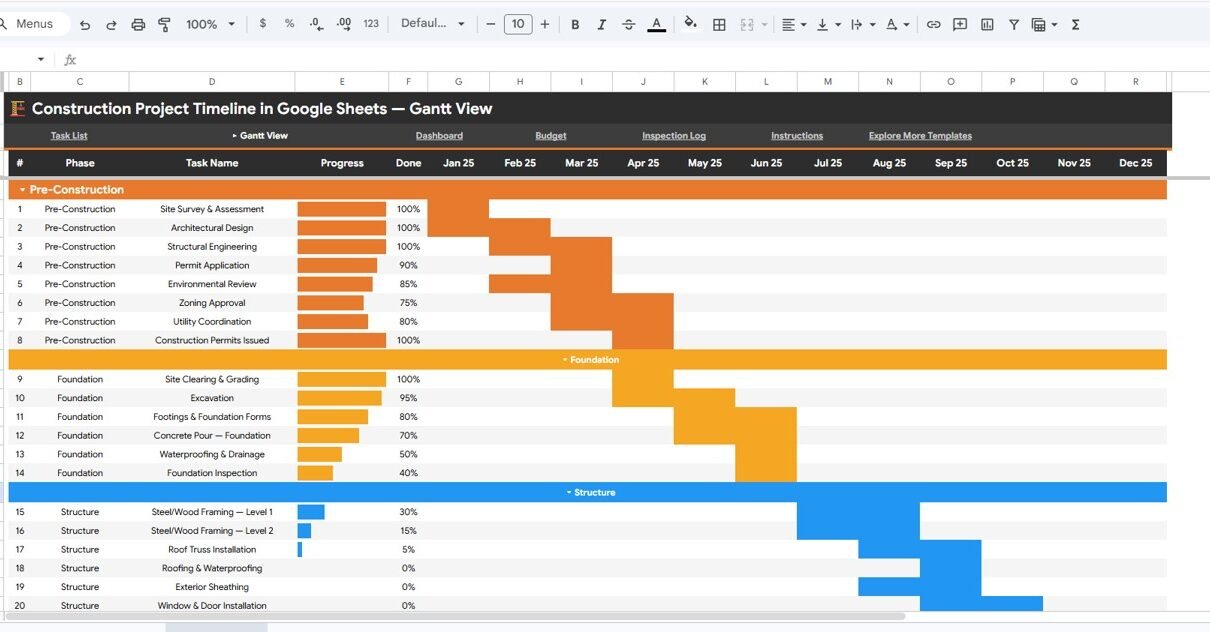
2 – Gantt View
The Gantt View page presents your construction schedule as a visual timeline. Charts include Task Duration by Phase (showing how long each phase takes relative to the overall project), Task Progress by Month (tracking completed work over time), Project Timeline by Phase (a Gantt-style horizontal bar chart), and Percent Complete by Task (individual task progress). This page makes it easy to spot scheduling conflicts, identify delays, and communicate timeline changes to stakeholders.
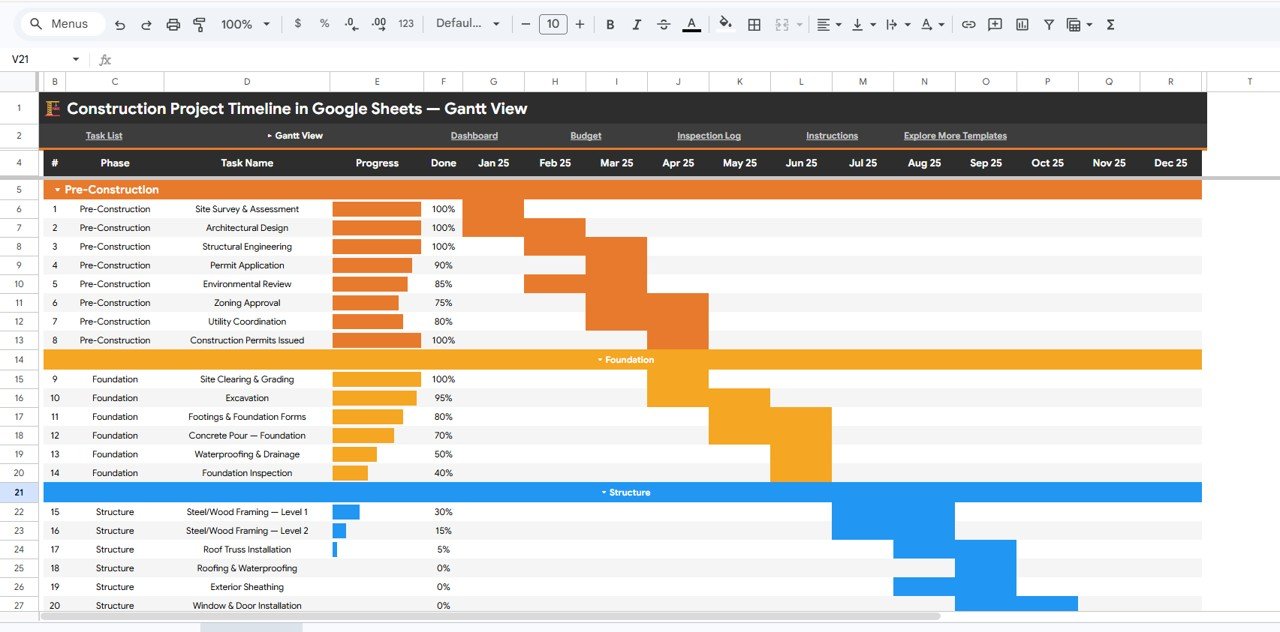
Gantt View
3 – Dashboard
The Dashboard page consolidates the most important project metrics into a single view. Charts cover Completion Percent by Phase, Budget by Phase, Actual Cost by Phase, Tasks by Status, Budget by Contractor, and Actual Cost by Contractor. This is the page you share with project owners and stakeholders who need a quick snapshot of project health without diving into detailed data.Construction Project Timeline in Google Sheets
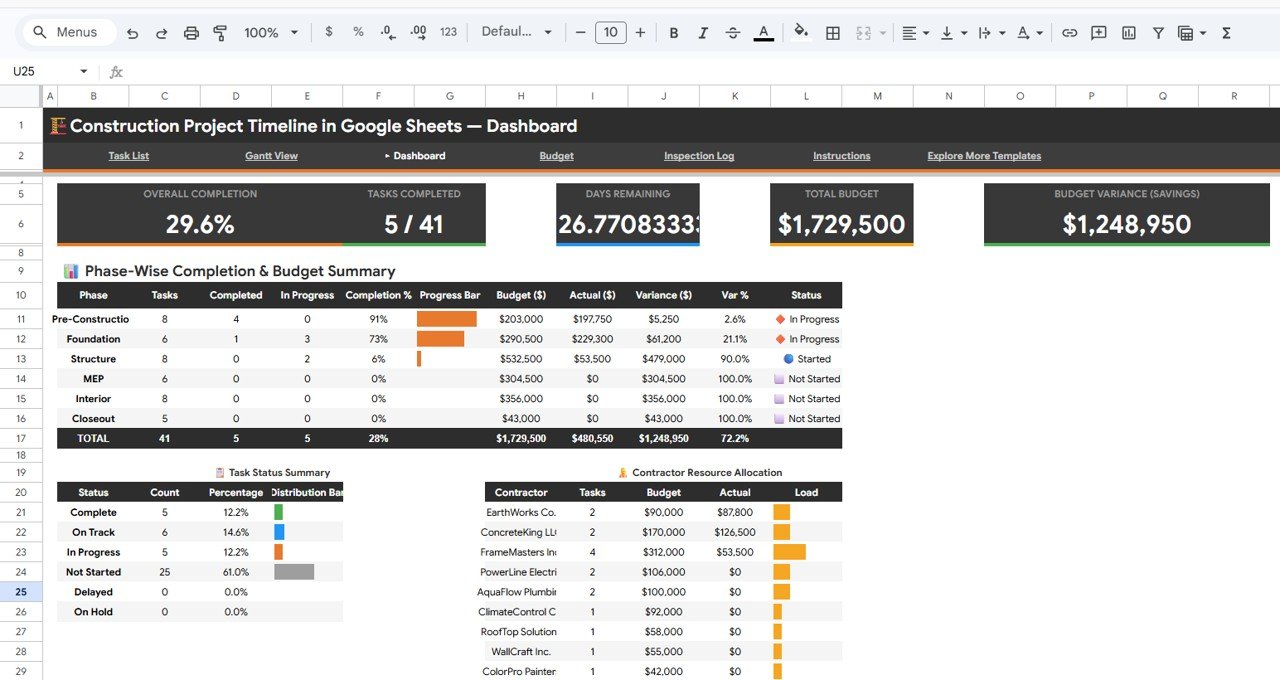
Dashboard
4 – Budget
The Budget page provides detailed financial analysis for your construction project. Charts display Planned Budget by Phase, Actual Cost by Phase, Variance by Phase (highlighting over- and under-budget areas), Change Orders by Item (tracking scope changes and their financial impact), and Net Budget Position by Category. This page helps you catch cost overruns early and make data-driven decisions about resource allocation.
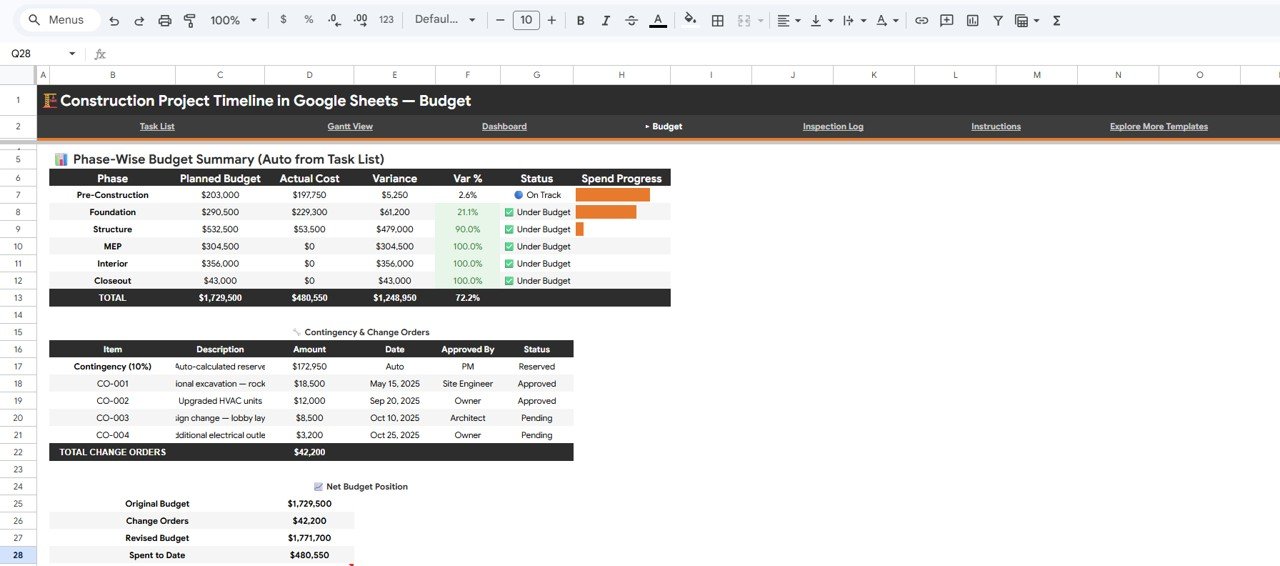
Budget
5 – Inspection Log
The Inspection Log page tracks quality control across your entire project. Charts display Inspections by Phase (which construction stages are being inspected), Inspections by Result (pass/fail/conditional rates), Inspections by Inspector (workload distribution), and Follow-Up Inspections by Phase (ensuring failed inspections are re-checked). This module is essential for maintaining compliance with building codes and documenting quality for project close-out.Construction Project Timeline in Google Sheets
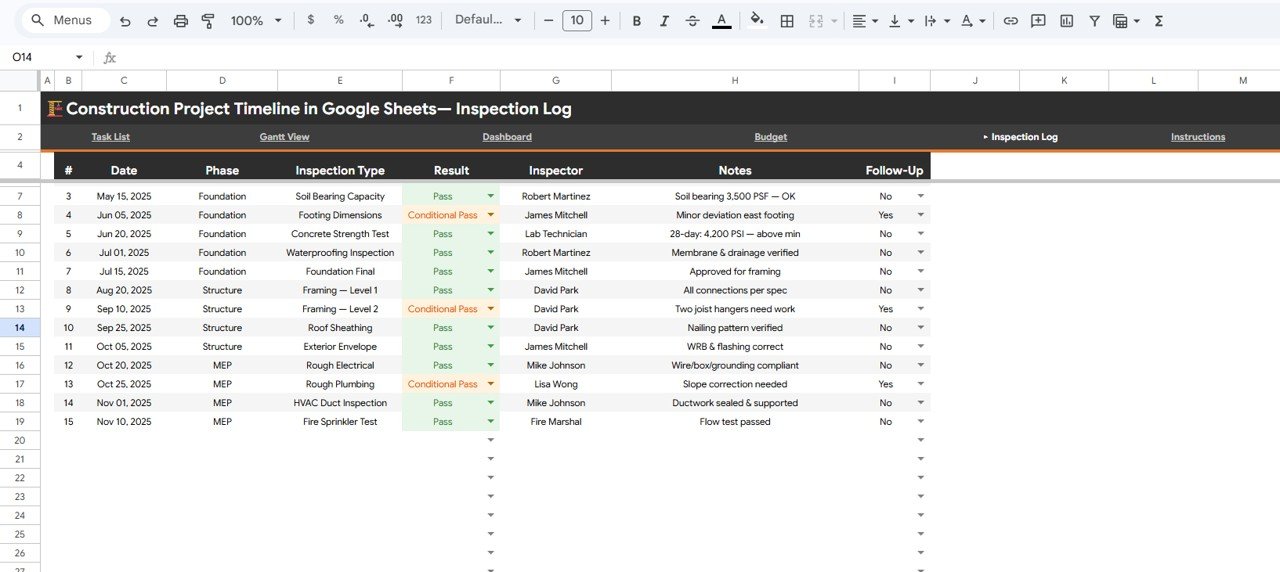
Inspection Log
Construction Project Timeline vs. Microsoft Excel vs. Smartsheet — Feature Comparison
| Feature | Construction Project Timeline (Google Sheets) | Microsoft Excel Dashboard | Smartsheet / Monday.com |
|---|---|---|---|
| Cost | $6.99 one-time | $15-30 one-time (template) + Excel license | $9-25 / user / month |
| Platform | Google Sheets (browser-based) | Desktop app required | Cloud SaaS |
| Setup Time | Under 10 minutes | 15-30 minutes | 1-3 hours with onboarding |
| Real-Time Team Collaboration | ✅ Built-in (Google Sheets) | ❌ File sharing only | ✅ Yes |
| Mobile Access | ✅ Google Sheets app | Limited on mobile | ✅ Yes |
| Built-In Gantt Chart | ✅ Included | Requires manual setup | ✅ Included |
| Inspection Log Module | ✅ Included | Not standard | Add-on required |
| Budget Variance Tracking | ✅ Included | Requires manual formulas | Limited without premium plan |
| Year-1 Cost (5 Users) | $6.99 total | $80-150 (license + template) | $540-1,500 |
For construction teams that want Gantt charts, budget tracking, and inspection logs without paying monthly SaaS fees, the Construction Project Timeline in Google Sheets sits in the sweet spot.
Who Should Use This Template
👉 Click here to Purchase the Construction Project Timeline in Google Sheets
Perfect for:
- Construction project managers tracking 5-50 task schedules with budgets under $10M
- General contractors who need a single view of timeline, budget, and inspection status
- Small to mid-size construction firms wanting a free-to-use platform with no per-seat licensing
- Owner-builders and renovation managers who need Gantt chart visibility without Smartsheet pricingConstruction Project Timeline in Google Sheets
Not a fit if:
- You manage 500+ tasks across multiple simultaneous projects requiring ERP integration
- Your team needs BIM software integration or automated resource leveling
- You require SOC 2 compliance, audit trails, and role-based permissions beyond Google Workspace
Real-World Use Cases
Raj manages a 25-unit residential development. He uses the Construction Project Timeline to track 40 tasks across Foundation, Framing, MEP, and Finishing phases. The Gantt View helps him spot scheduling overlaps between contractors, while the Budget page flags cost overruns before they escalate — saving his firm from a $15,000 change order surprise on the electrical phase.Construction Project Timeline in Google Sheets
Maria runs project controls for a mid-size commercial builder. She shares the Google Sheet with her superintendent and 3 subcontractors so everyone sees the same timeline. The Inspection Log replaced her paper-based QC tracking, and the slicer filters let her pull phase-specific reports for weekly owner meetings in under 2 minutes.
Tom is an owner-builder renovating a historic property. With no construction management background, he uses the Overview page KPIs to stay on top of completion percentage and days remaining. The Budget Variance card showed him he was $3,200 under budget on demolition — funds he reallocated to upgraded fixtures.
Advantages of Construction Project Timeline in Google Sheets
- Zero recurring cost – $6.99 one-time versus $540-1,500/year for 5 users on Smartsheet or Monday.com
- Instant team access – Share via Google Sheets link, no app installs or account creation needed
- Five integrated modules – Timeline overview, Gantt chart, consolidated dashboard, budget analysis, and inspection log in a single file
- Mobile-friendly – Works on Google Sheets app (iOS/Android) for on-site status checks
- Fully customizable – Add phases, contractors, tasks, or inspection types without breaking formulas
- No macros or scripts – Built entirely with native Google Sheets features for maximum compatibility
Opportunities for Improvement
👉 Click here to Purchase the Construction Project Timeline in Google Sheets
- No automated notifications – Google Sheets does not send alerts when tasks are overdue or inspections are due. You would need Google Apps Script or a third-party tool like Zapier to add email reminders.
- Single project scope – This template tracks one project at a time. Multi-project portfolio views require duplicating the sheet or using a dedicated program management tool.
- No resource leveling – The Gantt chart shows timelines but does not automatically detect or resolve resource conflicts across overlapping tasks.
- Limited offline access – While Google Sheets has an offline mode, slicer filters and some chart interactions work best with an internet connection.Construction Project Timeline in Google Sheets
Best Practices
- Update task progress weekly – Set a recurring reminder to update completion percentages every Friday so your Gantt View and KPI cards reflect the latest statusConstruction Project Timeline in Google Sheets
- Use consistent phase names – Stick to standard phase labels (e.g., “Foundation”, “Framing”, “MEP”, “Finishing”) so charts group data correctlyConstruction Project Timeline in Google Sheets
- Log inspections the same day – Enter inspection results immediately to keep the Inspection Log current and ensure follow-ups are scheduled on timeConstruction Project Timeline in Google Sheets
- Set view-only permissions for stakeholders – Share with project owners as “Viewer” to prevent accidental edits while giving them full dashboard visibility
- Use slicer filters for meeting prep – Before weekly progress meetings, apply filters to isolate the current phase for focused discussion
For additional project management tools, see the Project Gantt Chart in Google Sheets for a dedicated Gantt template, or the Project Deliverable Approval Tracker in Google Sheets for sign-off workflows.
Explore Relevant Templates
- Construction Project Schedule Calendar in Google Sheets – Calendar-based view of construction schedules
- Construction Project Cost Dashboard in Google Sheets – Deep-dive into cost analytics for construction projects
- Project Gantt Chart in Google Sheets – Dedicated Gantt chart for any project type
- Construction Project Cost Dashboard in HTML – Browser-based construction cost analytics
- 💎 Save 40% — Project Management Pro Bundle (9 Templates) →
Learn more about Google Sheets features for project tracking on the official Google Sheets Help Center.
Frequently Asked Questions
👉 Click here to Purchase the Construction Project Timeline in Google Sheets
What KPIs does the Construction Project Timeline track?
The Construction Project Timeline in Google Sheets tracks 5 KPIs: Overall Completion percentage, Tasks Completed count, Days Remaining, Total Budget, and Budget Variance Savings. All metrics update automatically when you replace the sample data with your actual construction project details.
Does this template include a Gantt chart?
Yes. The Gantt View page includes 4 charts: Task Duration by Phase, Task Progress by Month, Project Timeline by Phase, and Percent Complete by Task. The Gantt chart is built with native Google Sheets features — no plugins, add-ons, or macros needed.
Can I share this with contractors and subcontractors?
Yes. Since it runs in Google Sheets, share it with anyone via a link. Set view-only or edit permissions per user. Real-time collaboration means everyone sees the latest project data without emailing files back and forth.
How does this compare to Smartsheet or Monday.com for construction?
The Construction Project Timeline costs $6.99 one-time versus $9-25 per user per month for Smartsheet or Monday.com. For teams of 5, that is $6.99 total versus $540-1,500 per year. This template covers timelines, budgets, and inspections without recurring fees.
How long does initial setup take?
Setup takes under 10 minutes. Open the Google Sheets link from the PDF guide, click Make a Copy, replace the sample data in the Data sheet with your project tasks, and all 5 pages update automatically. No formulas to configure.
Can I track multiple construction projects in one file?
This template is designed for one project at a time for clarity and performance. For multiple projects, duplicate the file for each project. Each copy operates independently with its own data, charts, and KPI cards.
Does it work on mobile devices at the job site?
Yes. Google Sheets works on any device with the Google Sheets app (iOS and Android) or any mobile browser. Slicer filters and charts display correctly on tablets and phones, making it easy to check project status from the construction site.
About the Author
Built by PK — Microsoft Certified Professional with 15+ years of Excel, Google Sheets, and Power BI experience. Founder of NextGenTemplates, reaching 300K+ subscribers across YouTube channels. Every template is hand-built and tested before release.
Conclusion
The Construction Project Timeline in Google Sheets gives construction project managers a unified view of task scheduling, Gantt chart visualization, budget tracking, and inspection logging — all in a single Google Sheets file with 20+ charts and slicer filters. For $6.99 one-time, it replaces the need for $540-1,500/year SaaS subscriptions while keeping your entire team connected in real time.
👉 Click here to Purchase the Construction Project Timeline in Google Sheets
✅ Instant download · One-time payment · No subscription
🎥 Visit our YouTube channel for step-by-step tutorials: Youtube.com/@NeoTechNavigators
📅 Last updated: April 2026

