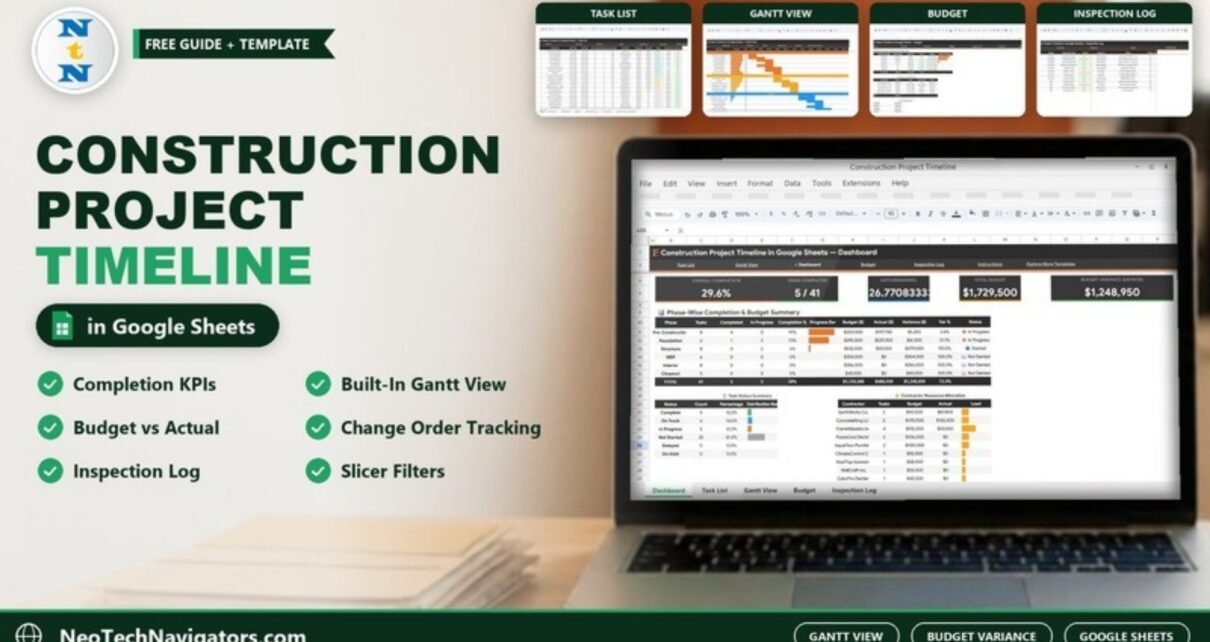
The Construction Project Timeline in Google Sheets brings task scheduling, a Gantt view, budget tracking and inspection logging into one shared spreadsheet. Instead of keeping the schedule in one file, costs in another and inspection notes on paper, the project manager, site team and owner all look at the same numbers.
The template has five working pages (Task List, Gantt View, Dashboard, Budget and Inspection Log) plus an Instructions tab. One task list drives everything: the Gantt bars, the five KPI cards on the Dashboard, the phase summaries and the budget variance. It is built with native Google Sheets features only, so there are no macros, add-ons or scripts to approve, and it works in the browser and in the Google Sheets mobile app.
Below you will see what each page shows, how the KPIs are worked out, how to set it up for your own project, and where it stops being the right tool.
🎥 Watch the Video Tutorial
Get the Construction Project Timeline
What Problem Does It Solve?
On most small and mid-size jobs the schedule, the budget and the quality records are kept by different people in different formats. When the owner asks “are we on time and on budget, and has the framing inspection passed?”, someone has to pull three sources together. By then the information is already a week old.
This template keeps those three views in one Google Sheet. The same task list drives the completion percentage, the Gantt bars and the phase budgets, and the inspection log sits next to it. Anyone you share the file with sees the current position without waiting for a report.
It is a good fit for:
- Project managers and site engineers running a single residential, commercial or renovation project.
- General contractors who need one view of timeline, cost and inspections for weekly meetings.
- Owner-builders and small firms that want Gantt-style visibility without a per-user software subscription.
Pages Explained
1. Task List
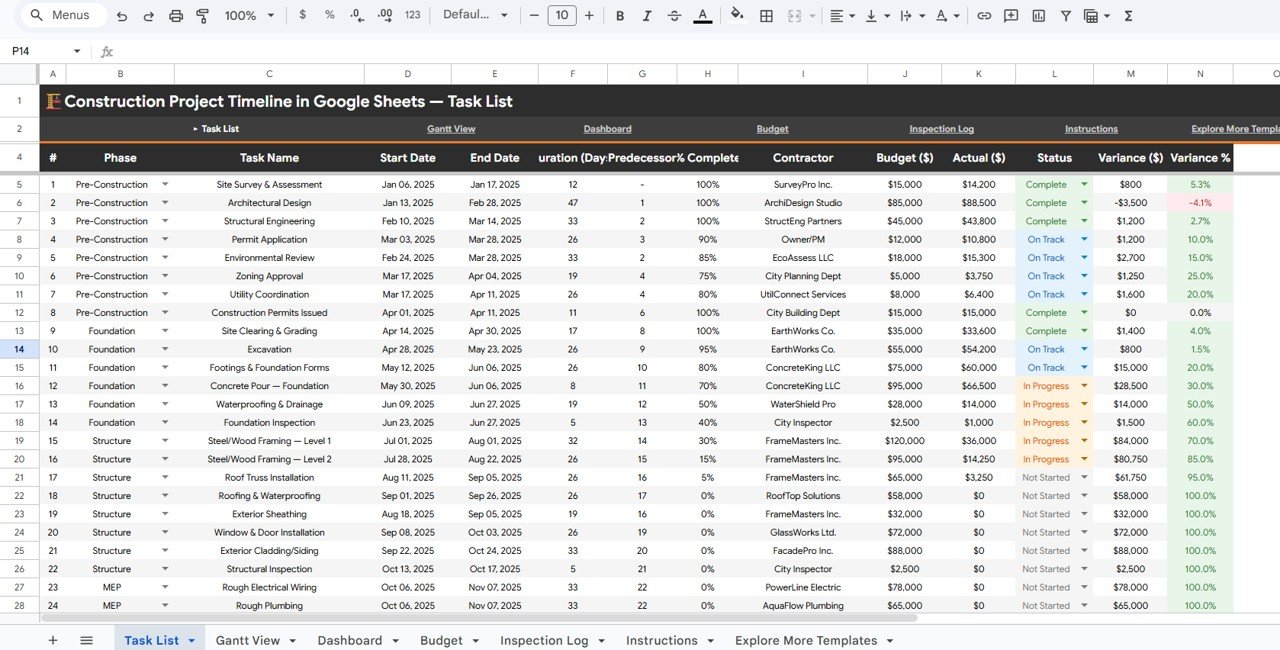
The Task List is where you enter the project. Each row has #, Phase, Task Name, Start Date, End Date, Duration (Days), Predecessor, % Complete, Contractor, Budget ($), Actual ($), Status, Variance ($) and Variance %. Phase and Status are dropdowns. The sample project has 41 tasks across six phases: Pre-Construction, Foundation, Structure, MEP, Interior and Closeout, and uses the statuses Complete, On Track, In Progress and Not Started (Delayed and On Hold are also counted on the Dashboard).
2. Gantt View
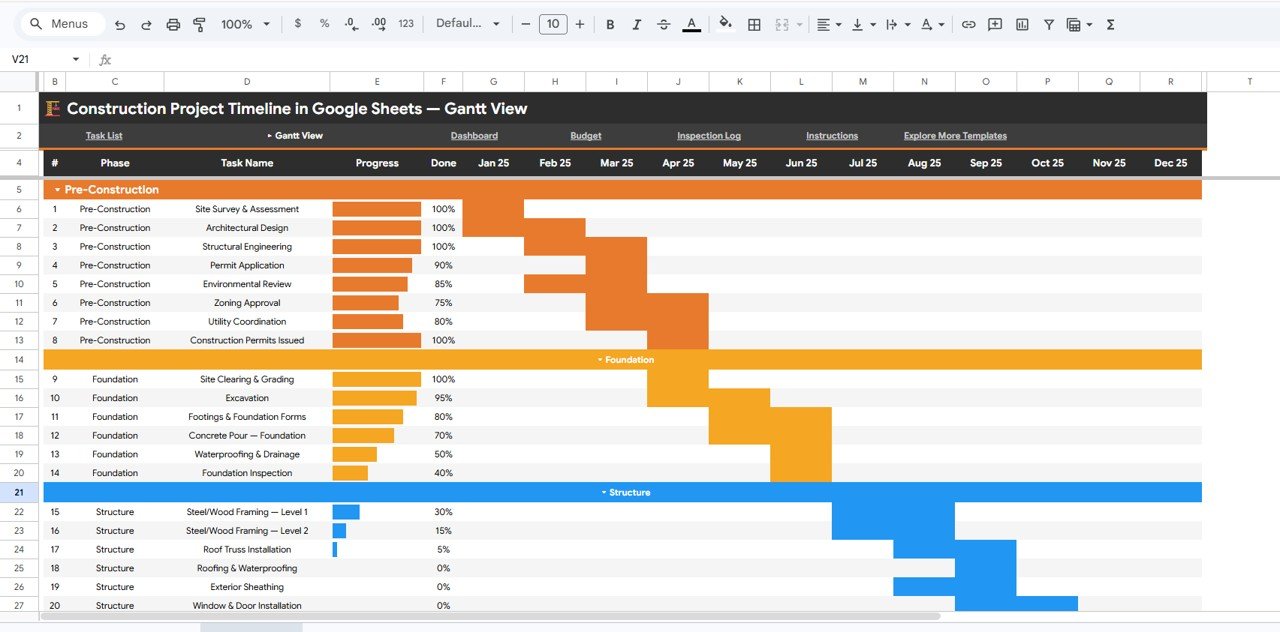
The Gantt View turns the task list into a timeline. Tasks are grouped under coloured phase headers, each with a Progress bar and a Done percentage, and coloured bars fill a monthly grid (Jan 25 to Dec 25 in the sample) to show when each task runs. It is the page to open when you need to spot overlapping trades, see which phase is running long, or explain a delay to the client.
3. Dashboard
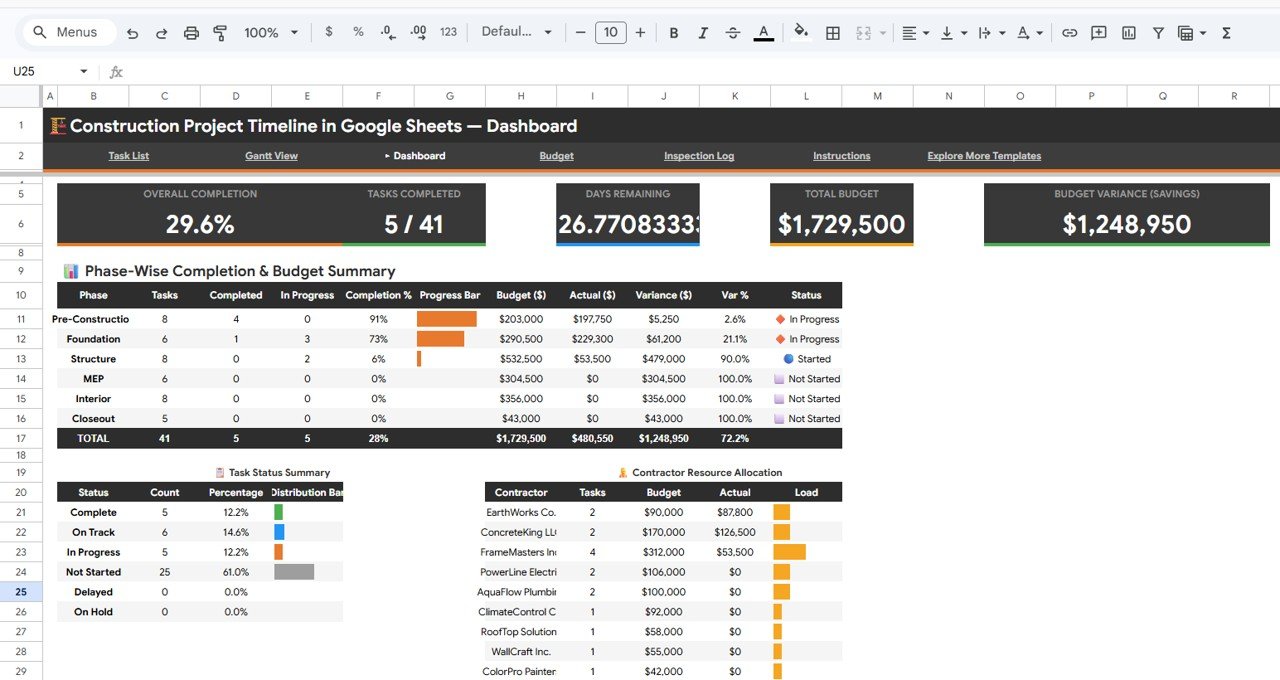
The Dashboard is the one-screen summary for owners and stakeholders. Five KPI cards sit at the top: Overall Completion, Tasks Completed, Days Remaining, Total Budget and Budget Variance (Savings). Below them are three summary tables:
- Phase-Wise Completion & Budget Summary: tasks, completed, in progress, completion %, a progress bar, budget, actual, variance, var % and a status for each phase.
- Task Status Summary: the count and percentage of tasks that are Complete, On Track, In Progress, Not Started, Delayed and On Hold.
- Contractor Resource Allocation: tasks, budget, actual and a load bar for each contractor.
4. Budget
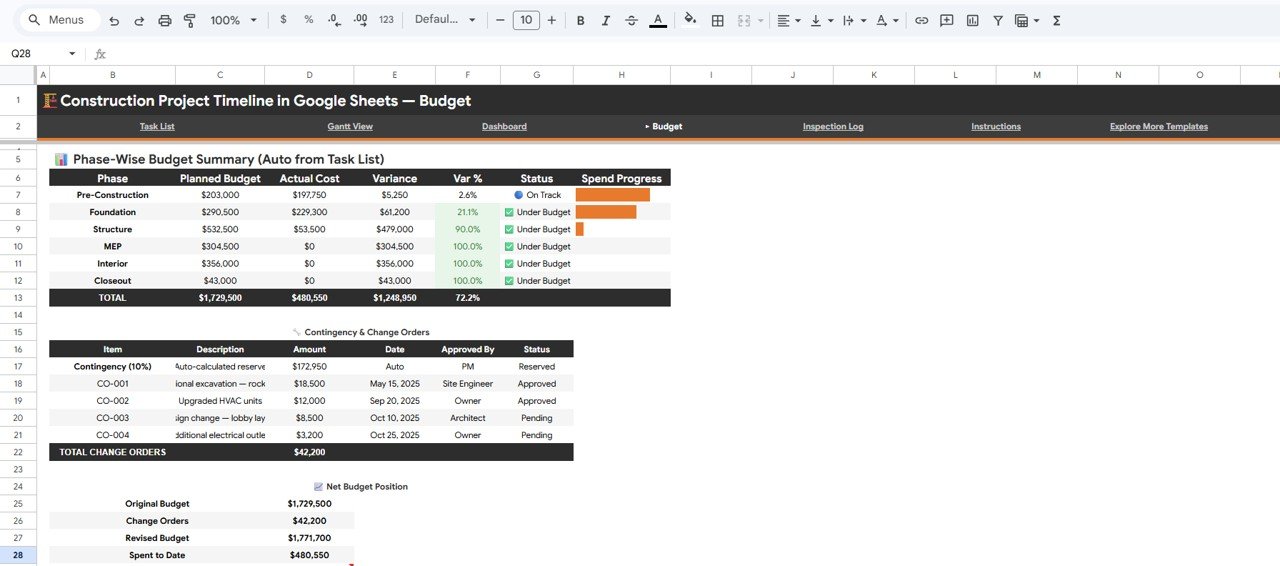
The Budget page is where cost control happens. The Phase-Wise Budget Summary (Auto from Task List) shows Planned Budget, Actual Cost, Variance, Var %, a Status (such as On Track or Under Budget) and a Spend Progress bar for each phase. The Contingency & Change Orders table lists a 10% contingency reserve and each change order with its item number, description, amount, date, who approved it and its status (Reserved, Approved or Pending). The Net Budget Position block then shows Original Budget, Change Orders, Revised Budget and Spent to Date.
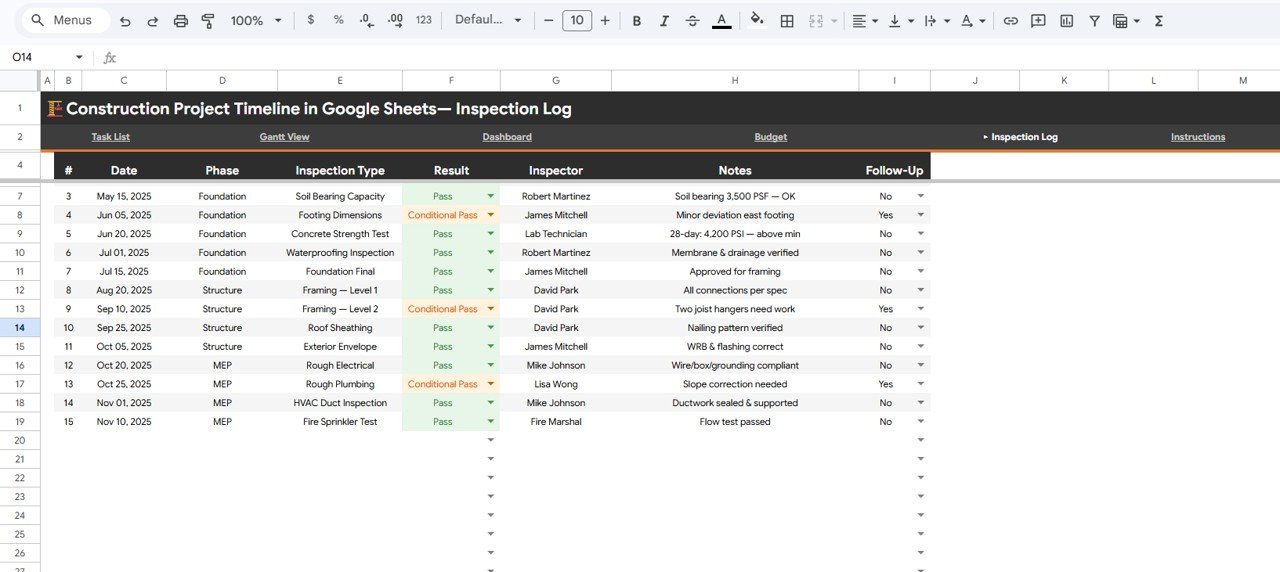
5. Inspection Log
The Inspection Log records each quality check with #, Date, Phase, Inspection Type, Result, Inspector, Notes and Follow-Up. Result is a dropdown (the sample uses Pass and Conditional Pass), and Follow-Up is Yes or No, so conditional results with open actions do not get forgotten before close-out.
Construction KPIs and How They Work
| KPI | What it measures | How to read it | Sample value |
|---|---|---|---|
| Overall Completion | How much of the planned work is done | Based on the % Complete of the tasks; higher is better against the plan | 29.6% |
| Tasks Completed | Tasks with status Complete out of all tasks | Count of Complete tasks / total tasks | 5 / 41 |
| Days Remaining | Time left until the planned finish | Read it together with Overall Completion | About 27 days at the time of the screenshot |
| Total Budget | Approved budget for all phases | Sum of the Budget ($) column | $1,729,500 |
| Budget Variance (Savings) | Budget not yet spent | Total Budget − total Actual ($) | $1,729,500 − $480,550 = $1,248,950 |
Note that Budget Variance (Savings) is the gap between total budget and money spent so far, so early in a project it mostly reflects work that has not started yet rather than real savings. For true cost control, look at variance on tasks that are already complete. The task-level variance works like this: Architectural Design has a budget of $85,000 and an actual of $88,500, so Variance ($) is 85,000 − 88,500 = −$3,500 and Variance % is −3,500 ÷ 85,000 ≈ −4.1%, the only overspent task in the sample screenshot. You can reproduce the same check in any cell:
Variance ($):  =Budget-Actual
Variance %:    =(Budget-Actual)/Budget
Revised budget: =OriginalBudget+TotalChangeOrders
On the Budget page the last formula gives $1,729,500 + $42,200 = $1,771,700, matching the Revised Budget shown in the screenshot. If the Days Remaining card shows decimals, set its number format to zero decimal places.
How to Set It Up for Your Project
- Open the PDF guide included with your purchase and use the link to Make a copy in your Google Drive.
- Look through the sample project first so you know which inputs drive which pages.
- On the Task List, replace the sample tasks with your own: phase, task name, start and end dates, predecessor, % complete, contractor, budget, actual and status.
- Add change orders on the Budget page and inspection records on the Inspection Log in the same format as the sample rows.
- Check the Dashboard cards; completion, tasks completed, days remaining and variance update automatically.
- Share the file with your team using Share in Google Sheets: give editors access to people who update progress and Viewer access to owners.
- Update progress and costs on a fixed day each week before the site meeting.
Real-World Use Cases
- Residential build: a project manager tracking pre-construction, foundation, structure and MEP work uses the Gantt View to spot two trades booked into the same weeks and moves one before it causes a delay.
- Commercial fit-out: a contractor shares the sheet with the client and subcontractors; the Contingency & Change Orders table shows pending changes early enough to discuss them at the next meeting.
- Home renovation: an owner-builder without project software watches Overall Completion and Days Remaining to decide whether to bring in extra help.
Google Sheets Timeline vs Desktop Spreadsheet vs Project Software
| Feature | This Google Sheets template | Plain desktop spreadsheet | Project management software |
|---|---|---|---|
| Set-up | Copy the file and replace sample data | Build everything yourself | Account setup and onboarding |
| Team access | Browser and mobile app, live sharing | File sharing by email or drive | Yes, usually per user |
| Gantt view | Included | Manual | Included |
| Budget variance and change orders | Included | Manual formulas | Varies by plan |
| Inspection log | Included | Not standard | Often an add-on |
| Automatic alerts and resource levelling | No | No | Usually yes |
Best Practices
- Update weekly, on the same day. Gantt bars and KPI cards are only as current as the last update.
- Use the Phase dropdown rather than typing phase names, so the summaries group correctly.
- Log inspections the day they happen and set Follow-Up to Yes for anything that did not fully pass.
- Record change orders separately rather than editing the original budget, so the variance stays honest.
- Fill in Predecessor so everyone can see which task is waiting on which.
Limitations and Who Should Not Use It
- It covers one project per file. For a portfolio, make a copy per project or use a multi-project dashboard.
- Google Sheets does not send automatic reminders for overdue tasks or due inspections.
- The Predecessor column is for reference; there is no automatic rescheduling, resource levelling or critical-path calculation.
- Large programmes with hundreds of tasks, BIM integration or strict audit-trail requirements need dedicated construction software.
Related Guides and Templates
If you only need the schedule, the Project Gantt Chart in Google Sheets is lighter, and the Construction Project Schedule Calendar shows the same work in a calendar layout. For deeper cost reporting, see the Construction Project Cost Dashboard in Google Sheets, and for target-based tracking the Construction KPI Dashboard. Teams that want a full app with logins can look at the Construction Project Management System Web App.
Related templates on NextGenTemplates: Construction Project Cost Dashboard in Google Sheets and Construction Project Schedule Calendar in Google Sheets.
If you want to understand how summary tables and dashboards like these are built, the Pivot Tables & Dashboards course on NextGenTemplates Academy teaches the technique step by step.
Frequently Asked Questions
Does the template include a Gantt chart?
Yes. The Gantt View page shows every task as a coloured bar on a monthly grid, grouped by phase, with a progress bar and Done percentage. It is built with native Google Sheets formatting, with no add-ons.
What KPIs does it track?
Overall Completion, Tasks Completed, Days Remaining, Total Budget and Budget Variance (Savings), all on the Dashboard page.
Can I share it with contractors and the client?
Yes. Share the Google Sheet like any other file. Give editor access to the people who update progress, and Viewer access to owners and stakeholders.
Can I track several projects in one file?
It is designed for one project per file. Make a copy for each project so every file keeps its own data.
Does it work on a phone at the site?
Yes. The file opens in the Google Sheets app on Android and iOS, so you can check progress or update a status from site.
Does it use macros or Apps Script?
No. It is built with standard Google Sheets features, so there is nothing to authorise when you make your copy.
Wrapping Up
The Construction Project Timeline in Google Sheets gives you schedule, budget and inspection status for one project in a single shared file. Copy it, enter your phases and tasks on the Task List, and make the weekly update a habit: the Gantt View and Budget page will then show problems while there is still time to fix them.
Get the Construction Project Timeline in Google Sheets
📅 Last updated: October 2026