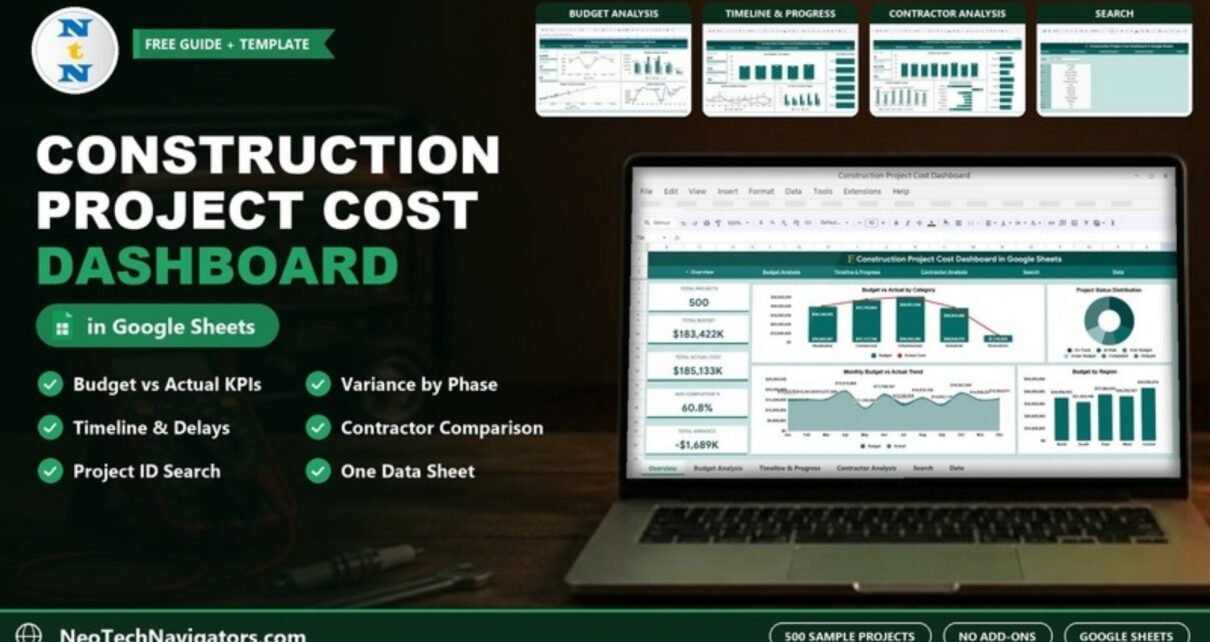
A construction portfolio rarely goes over budget in one dramatic moment. It drifts: a foundation phase costs a little more than planned, a contractor runs late, a region quietly carries more risk than the others. The Construction Project Cost Dashboard in Google Sheets is built to make that drift visible early, by turning one project table into KPI cards, budget-versus-actual charts, timeline views and a contractor comparison.
This guide walks through every page of the template exactly as it ships with its 500 sample projects, explains what each card and chart tells you, and shows how to load your own records. It is written for project managers, cost controllers, quantity surveyors and construction business owners who already use Google Sheets and want a clear cost picture without buying project-controls software.
🎥 Watch the Video Tutorial
Get the Construction Project Cost Dashboard
What Problem the Construction Cost Dashboard Solves
Most construction teams already keep a project list with a budget, an actual cost and a status. The trouble starts when someone asks a summary question. Which category runs furthest over budget? Which phase takes the longest? Which contractor finishes work and which one keeps overspending? Answering each of those by filtering and adding up rows takes time, and the answer is out of date by next week.
This template keeps your project list in one Data sheet and builds every summary from it. A navigation bar at the top of each page links Overview, Budget Analysis, Timeline & Progress, Contractor Analysis, Search and Data, so you move between views with one click.
Construction Project Cost Dashboard in Google Sheets at a Glance
| Page | KPI cards | Charts |
|---|---|---|
| Overview | Total Projects, Total Budget, Total Actual Cost, Avg Completion %, Total Variance | Budget vs Actual by Category, Project Status Distribution, Monthly Budget vs Actual Trend, Budget by Region |
| Budget Analysis | Avg Budget / Project, Over Budget Projects, Under Budget Projects | Avg Variance by Phase, Budget by Category & Priority, Budget vs Actual Cost (Sample), Monthly Variance Trend |
| Timeline & Progress | Avg Duration (Days), Completed Projects, Delayed Projects | Avg Completion % by Category, Avg Duration by Phase, Monthly Completed vs Delayed, On Track vs At Risk by Region |
| Contractor Analysis | Total Contractors, Avg Cost / Contractor, Best Completion Rate | Contractor Avg Completion %, Projects per Contractor, Contractor Budget vs Actual, Avg Variance per Contractor |
| Search | – | Project lookup by Project ID |
| Data | – | One row per project; the only sheet you edit |
Page-by-Page Walkthrough
1. Overview – The Whole Portfolio on One Screen
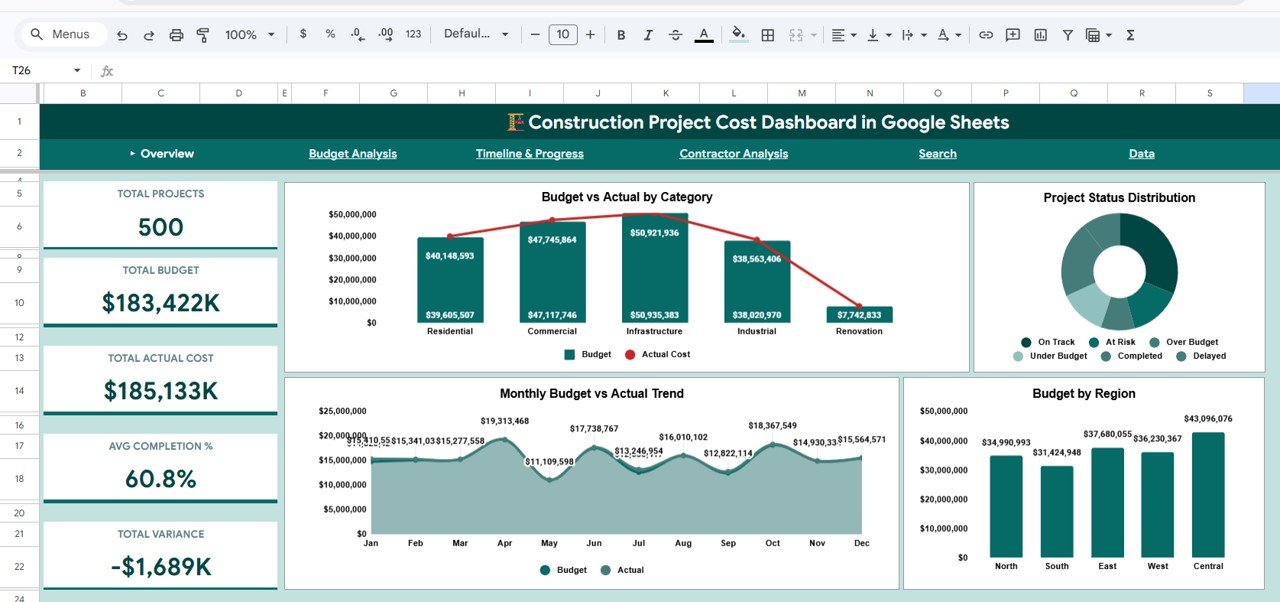
The Overview opens with five KPI cards down the left side. With the sample data they read Total Projects 500, Total Budget $183,422K, Total Actual Cost $185,133K, Avg Completion % 60.8% and Total Variance -$1,689K. A negative variance means the portfolio as a whole has spent more than it planned.
- Budget vs Actual by Category – columns for budget with a red line for actual cost across Residential, Commercial, Infrastructure, Industrial and Renovation. Infrastructure is the largest category in the sample at roughly $50.9 million.
- Project Status Distribution – a doughnut split into On Track, At Risk, Over Budget, Under Budget, Completed and Delayed.
- Monthly Budget vs Actual Trend – January to December, so you can see the months where spending peaked (April is the highest in the sample).
- Budget by Region – North, South, East, West and Central, with Central carrying the largest budget in the sample.
2. Budget Analysis – Where the Money Drifts
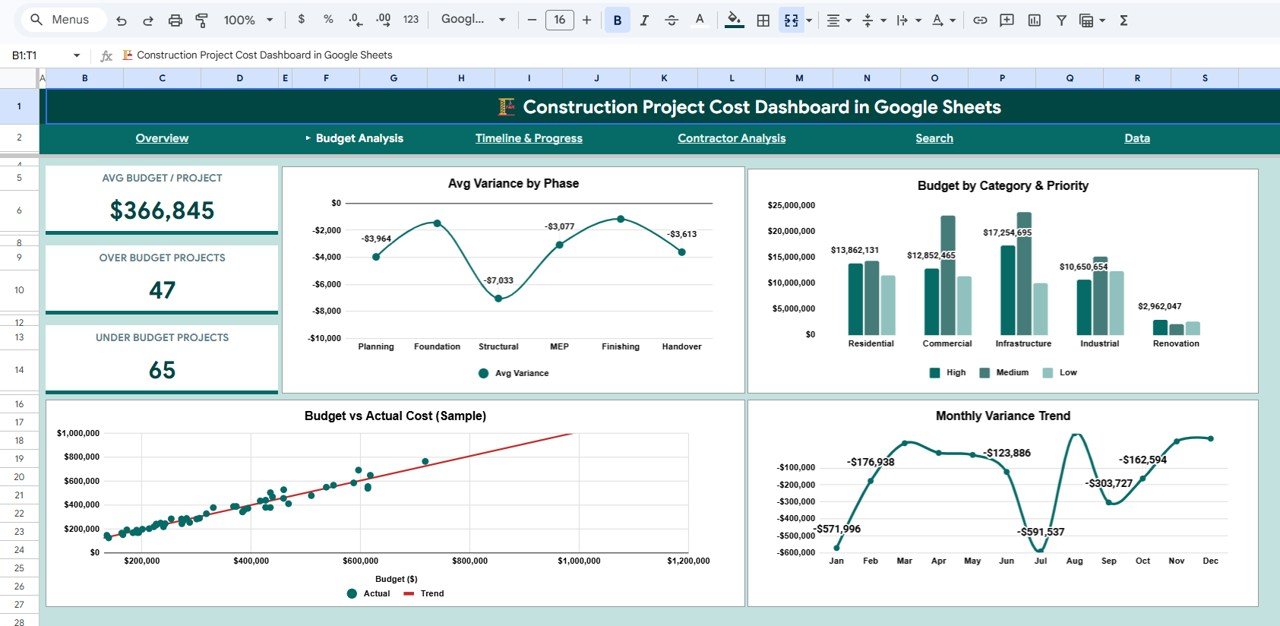
Three cards sit at the top: Avg Budget / Project ($366,845 in the sample, which is the total budget divided by 500 projects), Over Budget Projects (47) and Under Budget Projects (65).
- Avg Variance by Phase – a line across Planning, Foundation, Structural, MEP, Finishing and Handover. In the sample every phase averages a negative variance, and Structural is the worst at about -$7,033 per project.
- Budget by Category & Priority – grouped columns that split each category by High, Medium and Low priority.
- Budget vs Actual Cost (Sample) – a scatter of individual projects with a trend line, useful for spotting projects that sit far from the line.
- Monthly Variance Trend – shows how the gap between budget and actual moves month by month. January (-$571,996) and July (-$591,537) are the weakest months in the sample.
3. Timeline & Progress – Are Projects Finishing?
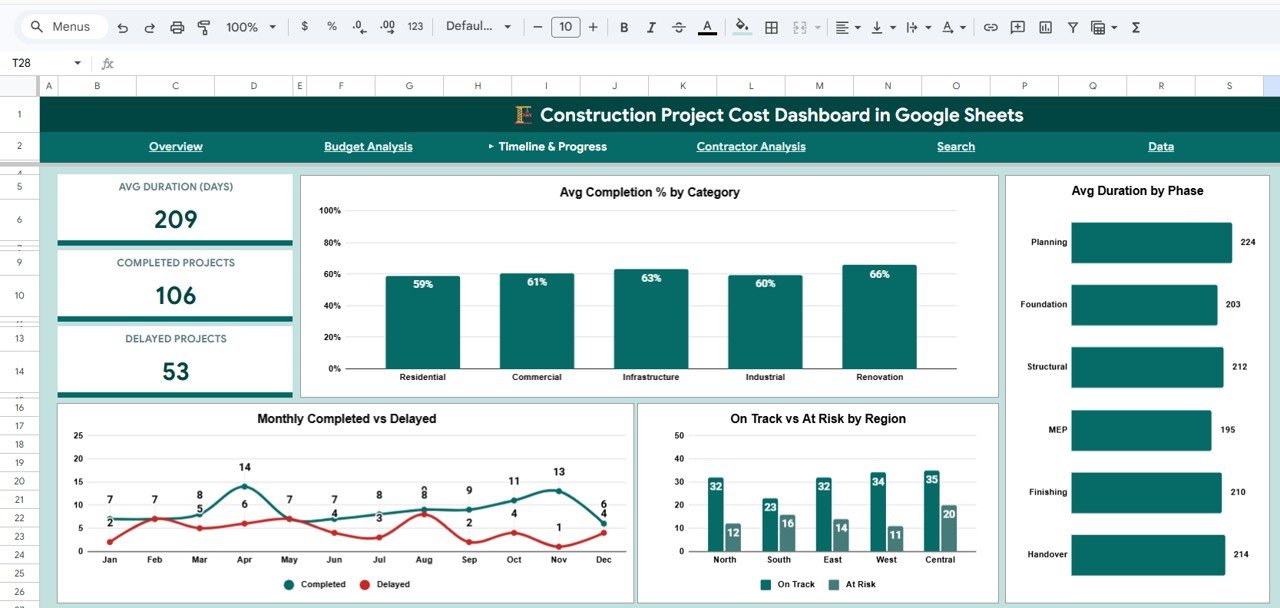
The cards show Avg Duration (Days) 209, Completed Projects 106 and Delayed Projects 53.
- Avg Completion % by Category – from 59% for Residential up to 66% for Renovation.
- Avg Duration by Phase – Planning is the longest phase in the sample at 224 days, MEP the shortest at 195.
- Monthly Completed vs Delayed – two lines, one for completed and one for delayed projects, so a bad month stands out. April has the most completions in the sample (14).
- On Track vs At Risk by Region – South has the highest share of at-risk projects (16 at risk against 23 on track).
4. Contractor Analysis – Who Delivers on Budget
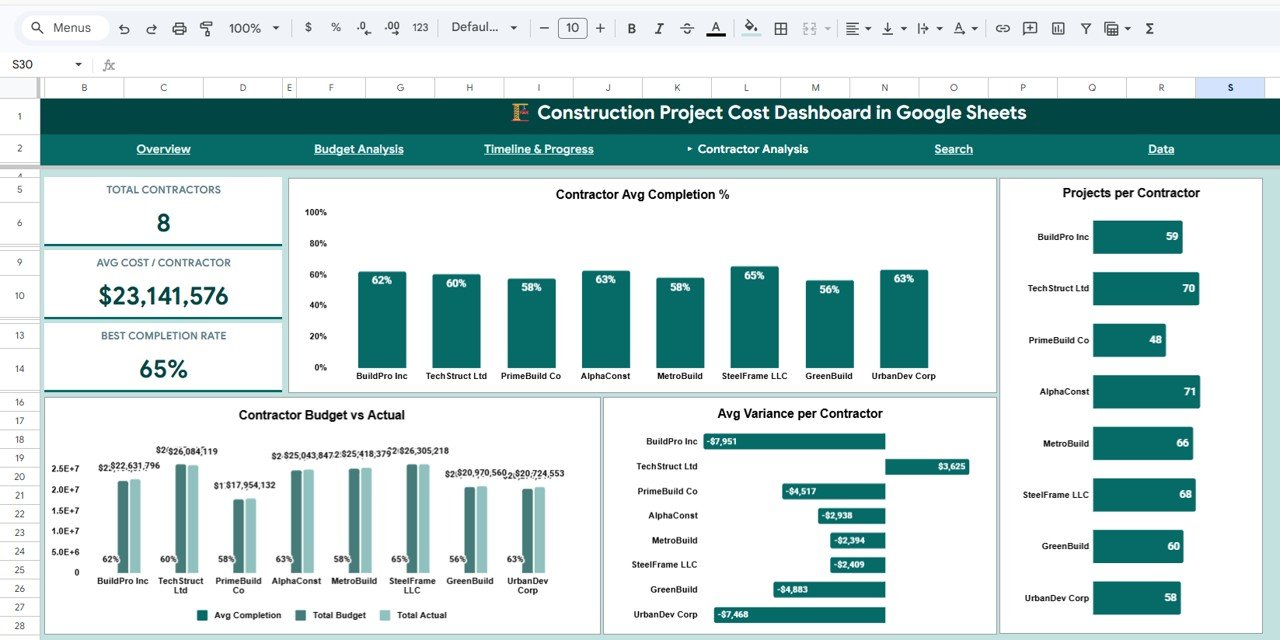
The cards read Total Contractors 8, Avg Cost / Contractor $23,141,576 (total actual cost divided by eight) and Best Completion Rate 65%. The sample contractors are BuildPro Inc, TechStruct Ltd, PrimeBuild Co, AlphaConst, MetroBuild, SteelFrame LLC, GreenBuild and UrbanDev Corp.
- Contractor Avg Completion % – SteelFrame LLC leads at 65%, GreenBuild trails at 56%.
- Projects per Contractor – workload ranges from 48 projects (PrimeBuild Co) to 71 (AlphaConst).
- Contractor Budget vs Actual – total budget and total actual side by side for each contractor.
- Avg Variance per Contractor – TechStruct Ltd is the only contractor with a positive average variance (+$3,625); BuildPro Inc has the largest overrun at -$7,951 per project.
5. Search – One Project, Every Detail
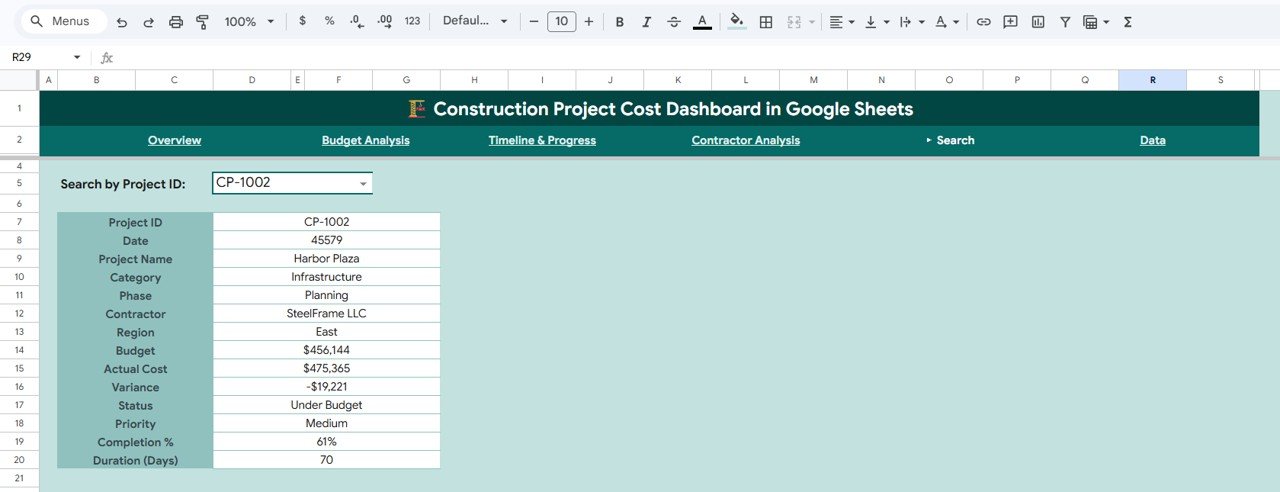
Pick a value in the Search by Project ID dropdown and the page fills in Project ID, Date, Project Name, Category, Phase, Contractor, Region, Budget, Actual Cost, Variance, Status, Priority, Completion % and Duration (Days). In the screenshot, CP-1002 is Harbor Plaza, an Infrastructure project in the Planning phase with SteelFrame LLC in the East region: budget $456,144, actual $475,365, variance -$19,221, priority Medium, completion 61% and duration 70 days.
6. Data – The Only Sheet You Edit
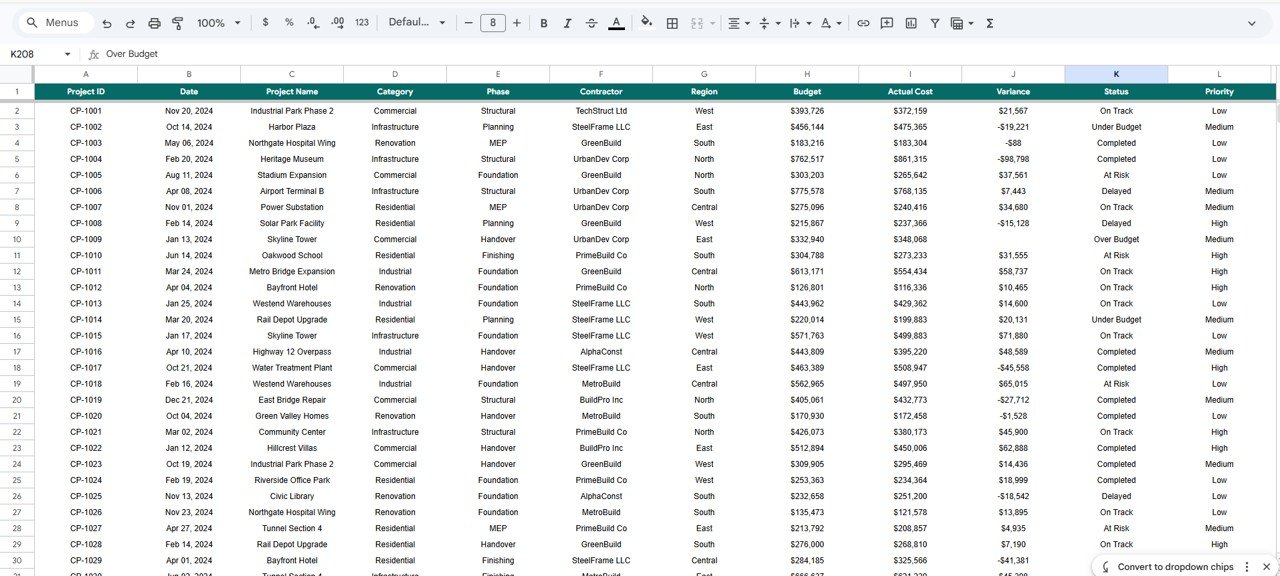
Each row is one project. The columns visible in the screenshot are Project ID, Date, Project Name, Category, Phase, Contractor, Region, Budget, Actual Cost, Variance, Status and Priority; the Search page also shows Completion % and Duration (Days) for each project. Variance is Budget minus Actual Cost, so a project that spends more than planned shows a negative number:
Variance = Budget - Actual Cost
CP-1001: $393,726 - $372,159 = $21,567   (under budget)
CP-1002: $456,144 - $475,365 = -$19,221  (over budget)
Status is a separate column that you type in; it does not change by itself when a variance turns negative. In the sample file, CP-1002 is labelled Under Budget even though its variance is negative, so check the Status value whenever you update actual costs. Also fill Variance on every row. A few sample rows, such as CP-1009, have a blank Variance cell, and the Total Variance card (-$1,689K) does not exactly equal Total Budget minus Total Actual Cost (-$1,711K), so complete rows keep the totals consistent.
How to Use It With Your Own Data
- Open the PDF guide that comes with the download and use its link to make your own editable copy in Google Drive.
- Go to the Data sheet and look at how the sample rows are written, especially Category, Phase, Status and Priority values.
- Replace the sample rows with your projects, keeping the same column order and headers.
- Use the same spelling every time for categories, phases, regions and contractor names, so each one appears as a single bar in the charts.
- Enter Budget and Actual Cost as plain numbers and keep Variance as Budget minus Actual Cost.
- Open Overview and check that Total Projects matches the number of rows you entered.
- If a date shows as a number (the sample Search page shows 45579 for one date), select the cell and apply Format > Number > Date.
If you want to understand how dashboards like this are put together and build your own versions, the Excel Pivot Tables & Dashboards course on NextGenTemplates Academy covers summarising data and charting it step by step.
Real-World Use Cases
- A general contractor running 30–50 jobs reviews Budget Analysis every month to find the phase where overruns start, then tightens estimates for that phase on new bids.
- A developer comparing subcontractors opens Contractor Analysis before awarding the next package and checks average variance and completion, not just price.
- A regional operations head uses On Track vs At Risk by Region to decide where to send a senior site manager for the next quarter.
Best Practices
- Update actual costs at a fixed rhythm, for example every Friday, so month-to-month trends compare like with like.
- Agree a short list of status values (On Track, At Risk, Over Budget, Under Budget, Completed, Delayed) and do not invent new ones mid-project.
- Investigate any project far from the trend line on the Budget vs Actual Cost scatter before it closes.
- Print or export the Overview to PDF through File > Download > PDF for monthly owner or board meetings.
- Keep a copy of the file at each quarter end so you can compare portfolios over time.
Who Should Not Use This Template
This is a reporting dashboard, not a full project-controls system. It does not schedule tasks, manage purchase orders, calculate earned value or send overrun alerts. Large firms that need integration with accounting or ERP software, multi-currency reporting or role-based access will outgrow it. It also depends on someone entering actual costs accurately; the charts are only as current as the Data sheet.
Related Templates and Guides
If you prefer a browser-based version, read the Construction Project Cost Dashboard in HTML guide. For schedule-focused work, the Construction Project Schedule Calendar in Google Sheets and the Construction Project Timeline in Google Sheets pair well with this dashboard. Teams that want progress and cost in one view can compare the Construction Progress & Cost Control Dashboard, and the Construction KPI Dashboard in Google Sheets covers month-by-month KPI targets.
Related template: Construction Project Cost Dashboard in Excel for teams that work in Microsoft Excel.
Frequently Asked Questions
What KPIs does the Construction Project Cost Dashboard show?
The Overview has five KPI cards: Total Projects, Total Budget, Total Actual Cost, Avg Completion % and Total Variance. The other pages add Avg Budget / Project, Over Budget Projects, Under Budget Projects, Avg Duration (Days), Completed Projects, Delayed Projects, Total Contractors, Avg Cost / Contractor and Best Completion Rate.
How is variance calculated?
Variance is Budget minus Actual Cost. A positive number means the project spent less than planned; a negative number means it went over budget.
Can I track several construction projects at once?
Yes. Each row in the Data sheet is one project, and the sample file holds 500 projects across five categories, five regions and eight contractors.
Do I need add-ons or Apps Script?
No. The dashboard runs on standard Google Sheets formulas and charts, so it works in any Google account.
Can I change the categories, phases or regions?
Yes. Type your own values into the Data sheet. Keep the spelling consistent so each value groups correctly in the charts.
Is there an Excel version?
Yes, a Construction Project Cost Dashboard in Excel is available on NextGenTemplates, along with an HTML version.
Wrapping Up
The Construction Project Cost Dashboard in Google Sheets turns one project table into a clear view of budget, actual cost, variance, timelines and contractor performance. Start by loading last quarter’s projects, look at the Avg Variance by Phase chart and the contractor comparison, and you will usually find one or two places where costs are leaking.
Get the Construction Project Cost Dashboard
📅 Last updated: October 2026