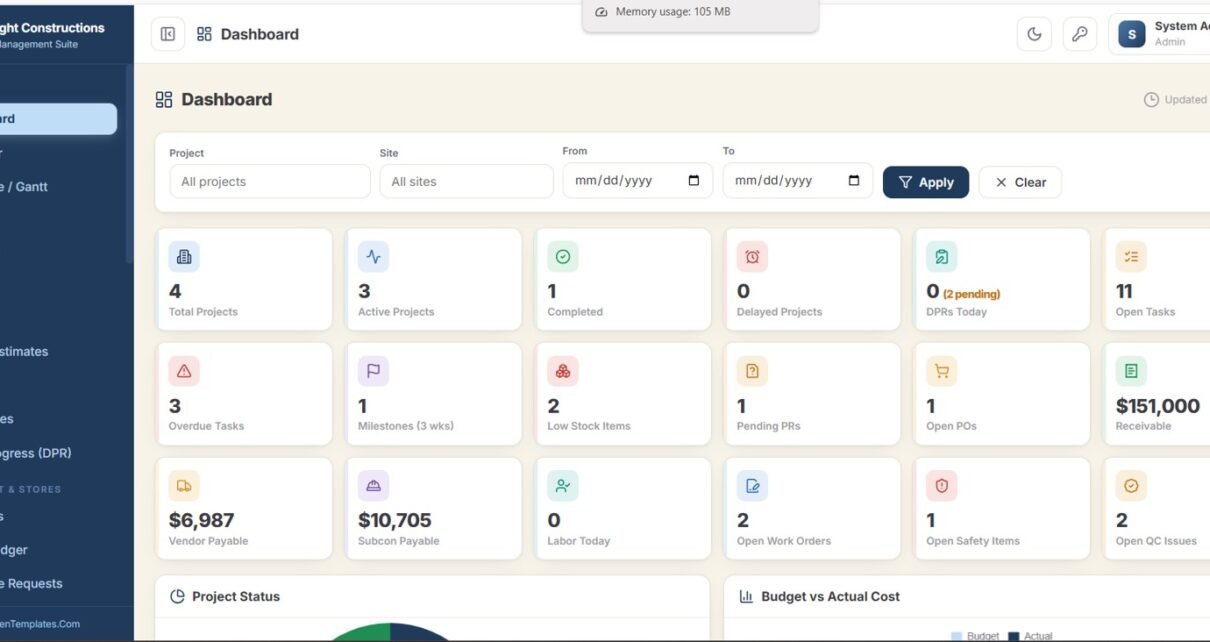
A multi-user Construction Project Management System Web App built on Google Sheets and Apps Script – 36 screens covering projects, procurement, finance, compliance, and reports, with role-based login and an 18-card dashboard. One-time $39.99.
Online Tutorial for Data Analysis and Automation
A multi-user Construction Project Management System Web App built on Google Sheets and Apps Script – 36 screens covering projects, procurement, finance, compliance, and reports, with role-based login and an 18-card dashboard. One-time $39.99.
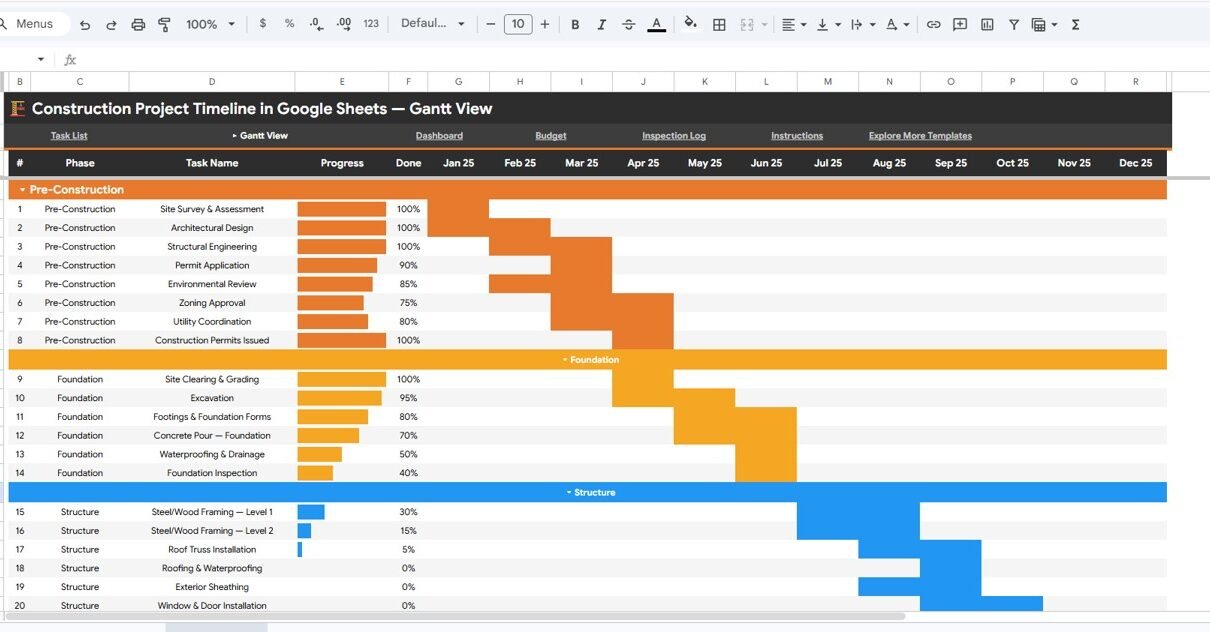
Track construction project timelines, budgets, inspections, and Gantt charts across 5 interactive pages in Google Sheets. The Construction Project Timeline template includes 20+ charts, KPI cards, slicer filters, and a built-in Gantt view for $6.99 one-time.
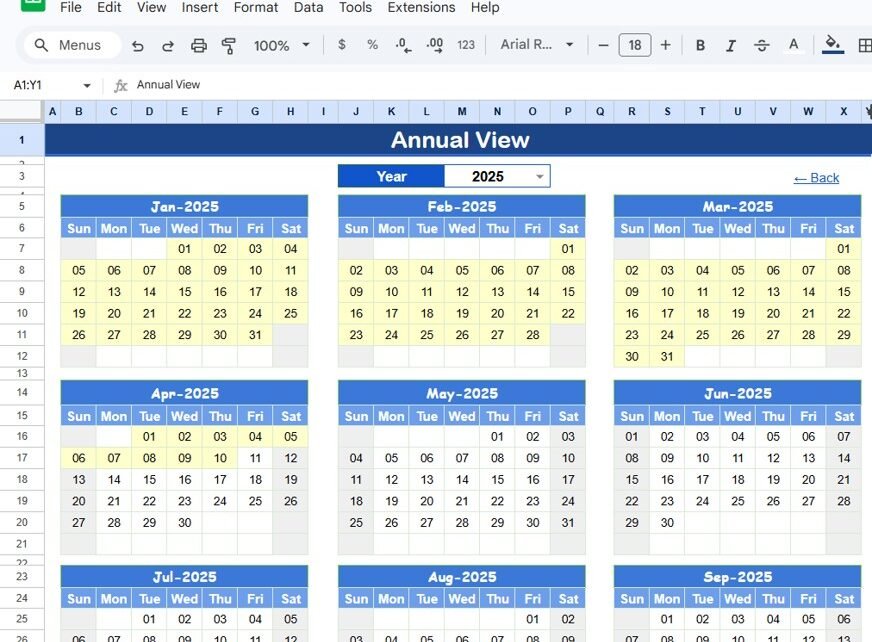
Construction Project Schedule Calendar in Google Sheets with 5 worksheets: Annual View, Monthly View, Daily View, Events database. Track inspections, deliveries, milestones, and site meetings.
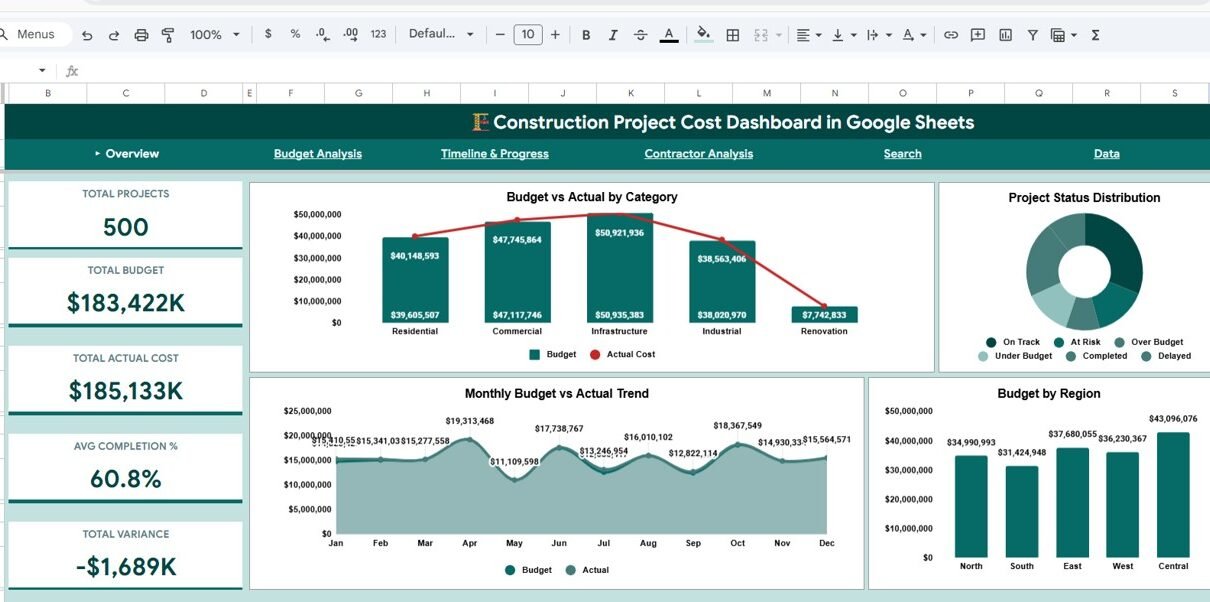
Track construction project budgets, actual costs, variances, contractor performance, and timelines with this interactive 5-page Google Sheets dashboard template featuring KPI cards, slicers, and a project search page.
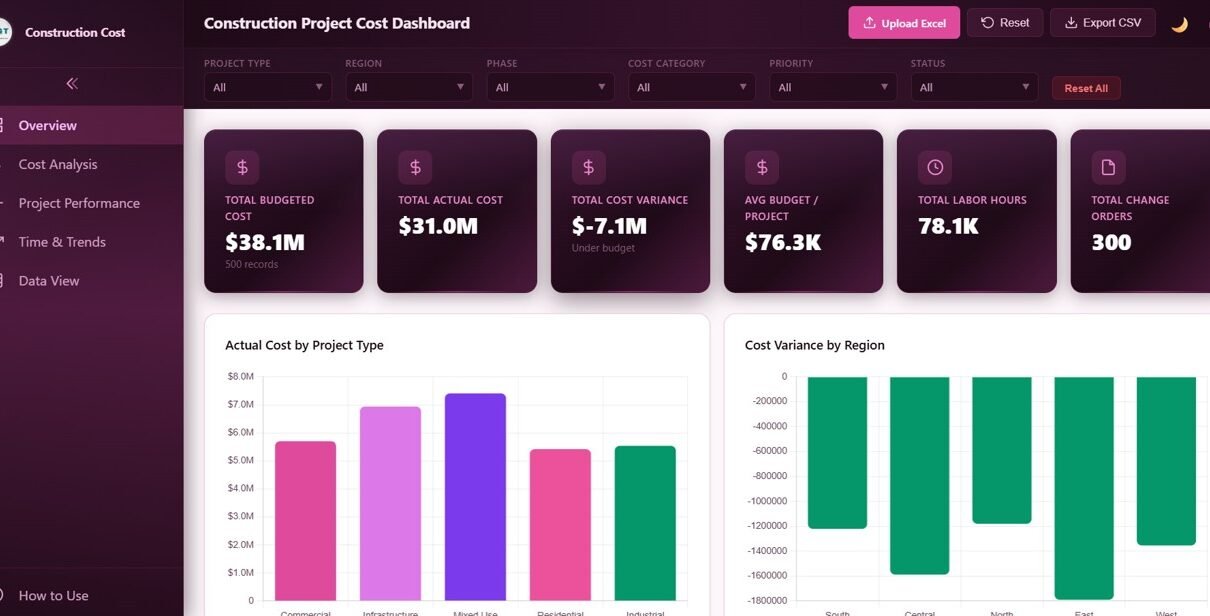
Construction Project Cost Dashboard in HTML with 5 interactive pages tracking budgets, actual costs, variances, project performance, time trends, and data view with CSV export.
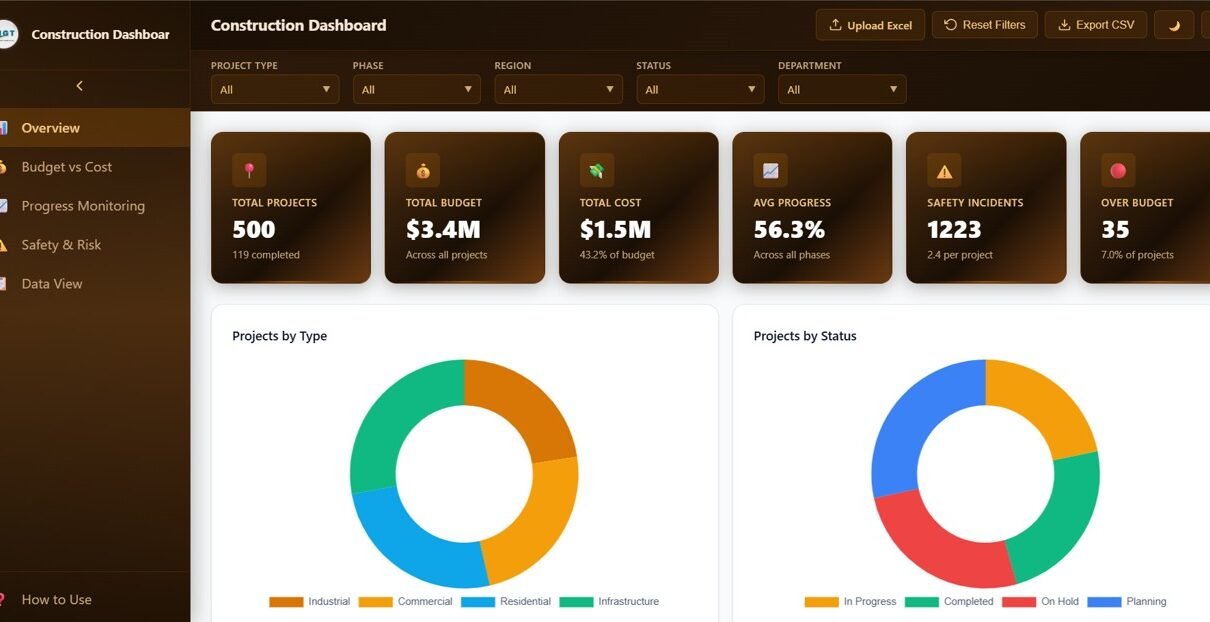
Construction Dashboard in HTML is a 5-page interactive analytics template to monitor construction projects, budgets, progress, and safety metrics in your browser.
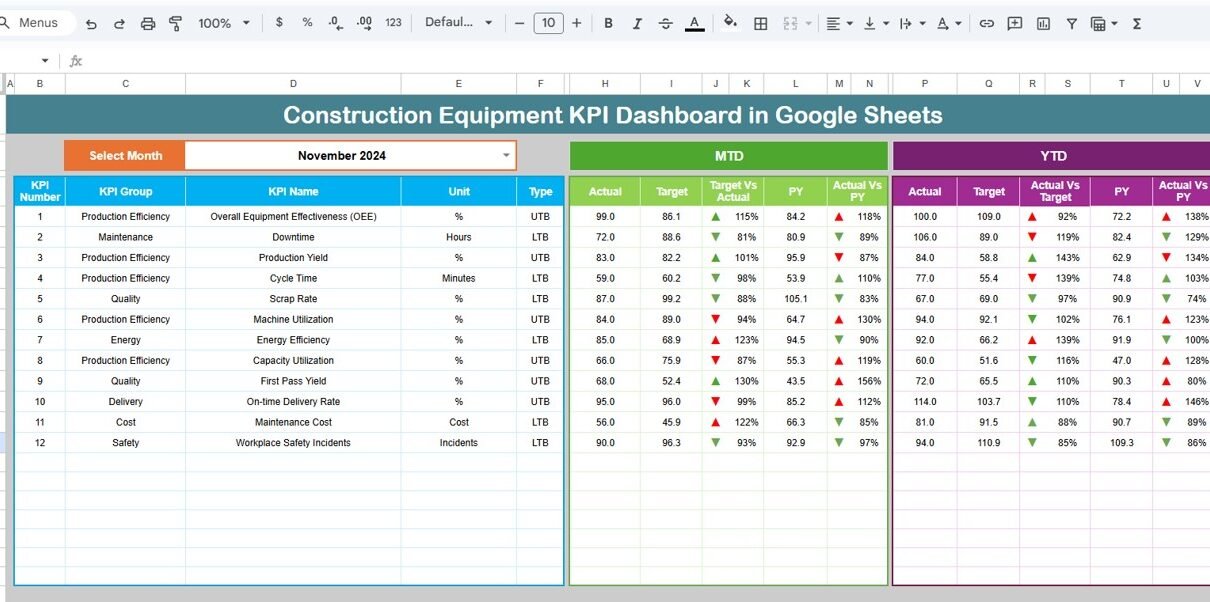
Construction projects depend heavily on the availability, utilization, and performance of equipment. However, many construction companies still track equipment data using manual logs, isolated spreadsheets, or delayed MIS reports. As a result, equipment downtime increases, costs rise, and productivity suffers. That is exactly where a Construction Equipment KPI Dashboard in Google Sheets delivers real value. […]
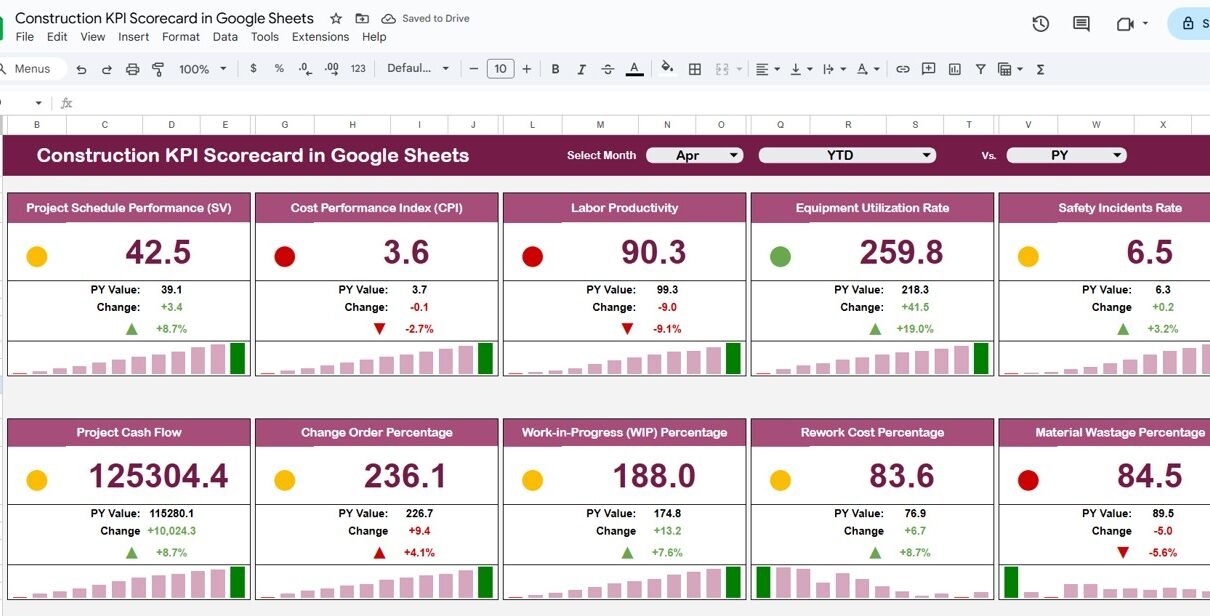
Monitoring key performance indicators (KPIs) in construction projects is essential for ensuring timely delivery, budget compliance, and overall project efficiency. The Construction KPI Scorecard in Google Sheets is a ready-to-use template designed to track and visualize project performance metrics in real-time. This article explains the key features, advantages, best practices, and usage of this Construction […]