Telehealth KPI Scorecard In Google Sheets
Telehealth has moved from a temporary care delivery option to a permanent part of modern healthcare operations. Clinics, hospitals, specialty practices, behavioral health providers, and virtual care teams now need a practical way to monitor appointment access, patient experience, provider utilization, clinical outcomes, and financial performance without waiting for a monthly manual report.Telehealth KPI Scorecard In Google Sheets
In this article, we have created Telehealth KPI Scorecard In Google Sheets. This is a ready-to-use scorecard template designed for healthcare teams that want a clear, simple, and shareable way to track telehealth performance. The template helps you compare actual results against targets, monitor month-to-date and year-to-date performance, review KPI trends, and maintain consistent KPI definitions in one organized Google Sheets file.Telehealth KPI Scorecard In Google Sheets
You can view the template here: Telehealth KPI Scorecard In Google Sheets.
Because it is built in Google Sheets, the scorecard is easy to share with managers, analysts, care coordinators, operations leaders, and executives. Teams can update the input data, review performance from any browser, and collaborate using familiar spreadsheet controls. For teams that want to learn more about Google Sheets collaboration and editing features, the Google Docs Editors Help center is also a useful reference.Telehealth KPI Scorecard In Google Sheets
Why Telehealth KPI Tracking Matters
Virtual care performance depends on more than total visits. A strong telehealth reporting process should help answer practical operating questions: Are patients getting appointments quickly? Are no-show rates under control? Are providers being used efficiently? Are visits being completed successfully? Are patients satisfied with the digital care experience? Are reimbursement and revenue measures moving in the right direction?
Without a structured scorecard, these answers often sit across multiple systems, exports, and manual notes. A simple KPI scorecard creates one place where decision makers can see what is working, what needs attention, and where performance is trending over time.
Key Features Of This KPI Scorecard
Below are the key features of this KPI Scorecard:
- Ready-to-use Google Sheets structure: Start tracking telehealth KPIs without building a reporting file from scratch.
- MTD and YTD performance views: Review both current month performance and year-to-date results.
- Actual vs target comparison: Compare each KPI against planned targets to identify performance gaps quickly.
- Visual status indicators: Use color-coded performance cues to understand which KPIs need attention.
- KPI trend analysis: Review actual, target, and previous year movement for selected metrics.
- Editable KPI definitions: Maintain KPI group, unit, formula, and definition details for consistent reporting.
- Simple input data structure: Update monthly KPI values in a clean data entry sheet.
- Healthcare-specific use case: Designed around telehealth, virtual care, remote consultation, patient access, and operational performance tracking.
What Is Included In The Template?
In this template, we have 4 worksheets:
- Scorecard Sheet
- KPI Trend Sheet
- Input Data Sheet
- KPI Definition Sheet
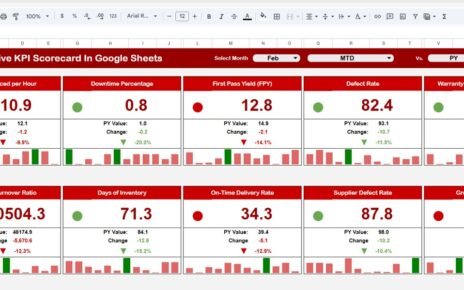
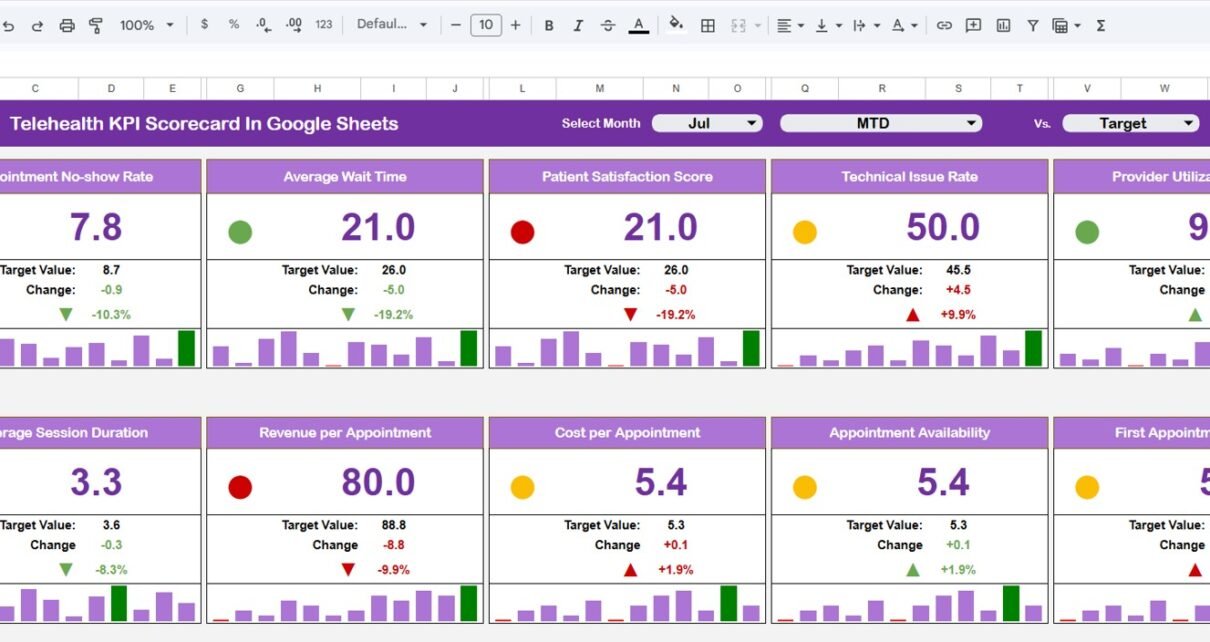
1. Scorecard Sheet
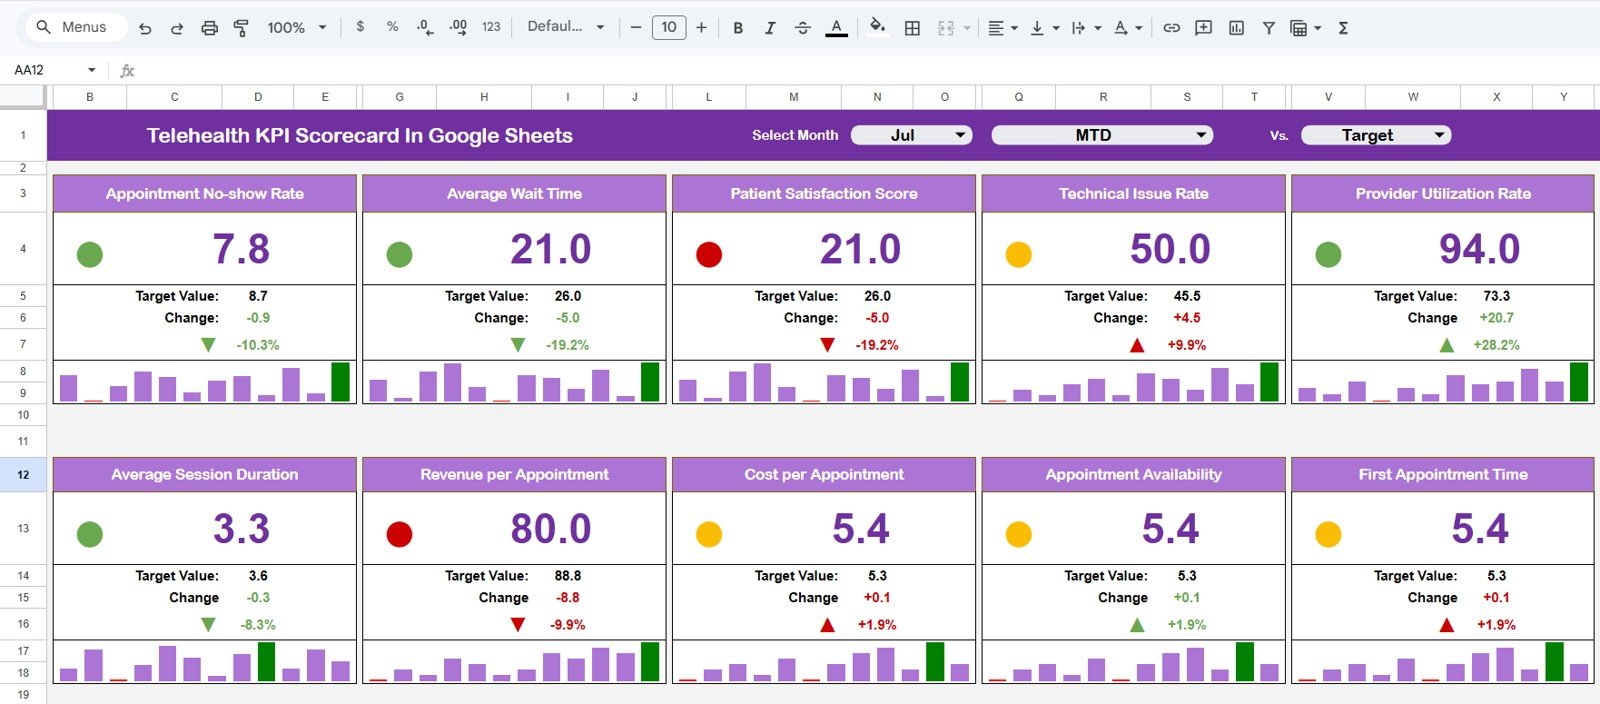
The Scorecard sheet is the main interface where you can view KPI performance. It is designed as the primary dashboard page for managers and decision makers who need a fast overview of telehealth operations.
Key features include:
- Dropdown Menus: Select the month, MTD, or YTD view for performance analysis.
- Actual vs Target Values: Compare actual performance against targets for each KPI.
- Visual Indicators: Quickly see performance status using color-coded visuals and conditional formatting.
- Comprehensive KPI Overview: Display all relevant information about KPIs, including MTD and YTD comparisons.
This sheet is useful for weekly reviews, monthly performance meetings, executive summaries, and quick operational check-ins. Instead of scanning raw rows of data, users can focus on the KPI status and the variance between actual and target results.
2. KPI Trend Sheet Tab
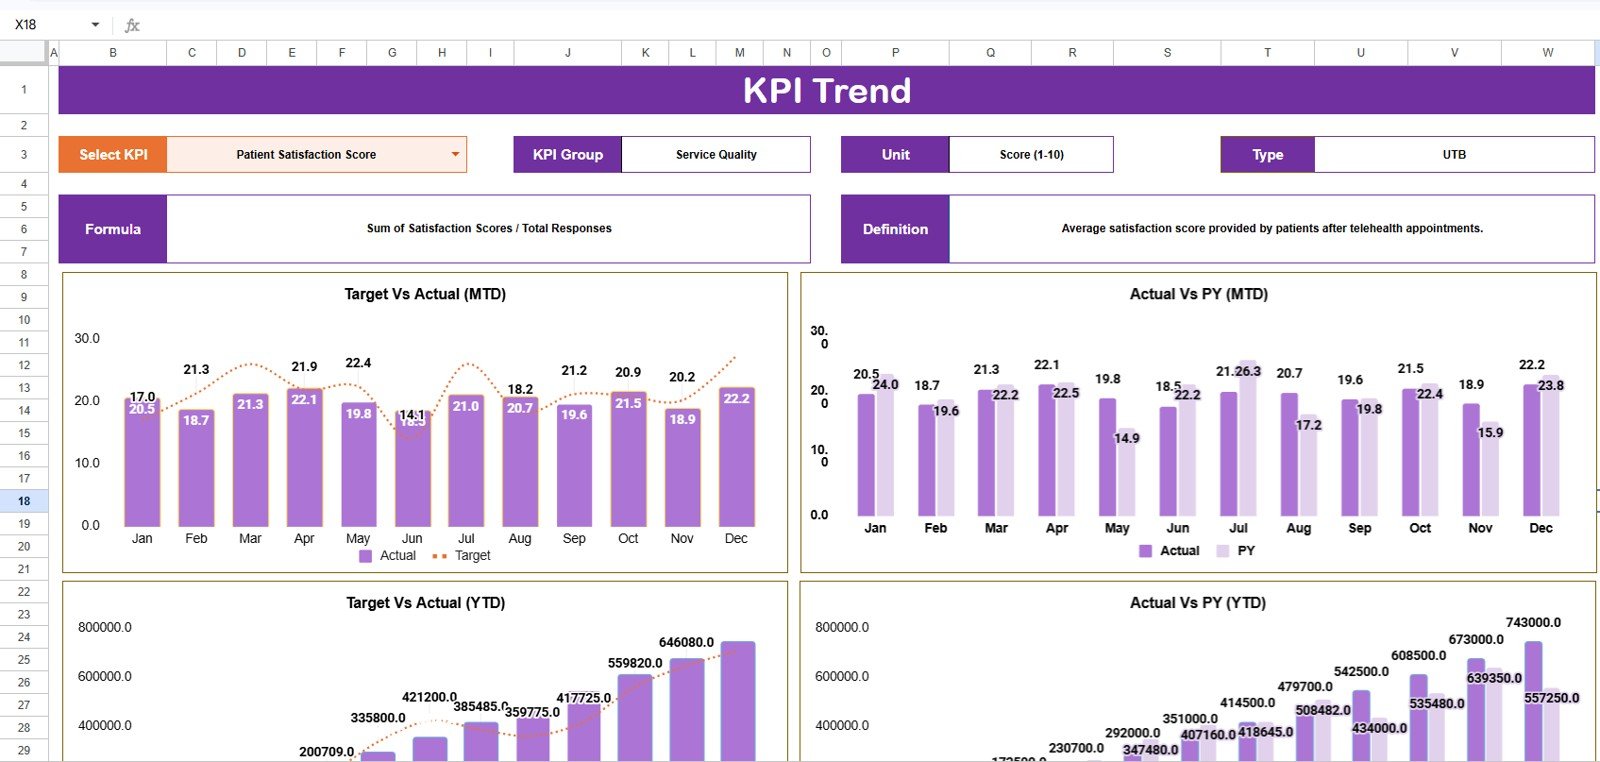
The KPI Trend sheet helps you analyze one KPI in more detail. You can select the KPI name from the dropdown available in range C3. Once the KPI is selected, the sheet displays the KPI Group, Unit of KPI, Type of KPI, Formula of the KPI, and Definition of the KPI.
This is especially helpful when a KPI needs deeper review. For example, if the scorecard shows a weak result for telehealth no-show rate, the trend sheet can help you review whether the issue is recent, seasonal, or part of a longer pattern. The template also shows the MTD and YTD trend chart for Actual, Target, and PY numbers.
Trend analysis is important because a single month can sometimes create a misleading view. A KPI may be below target this month but improving steadily, or it may look acceptable today while slowly declining over several periods. The KPI Trend sheet gives teams the context needed to make better decisions.
3. Input Data Sheet
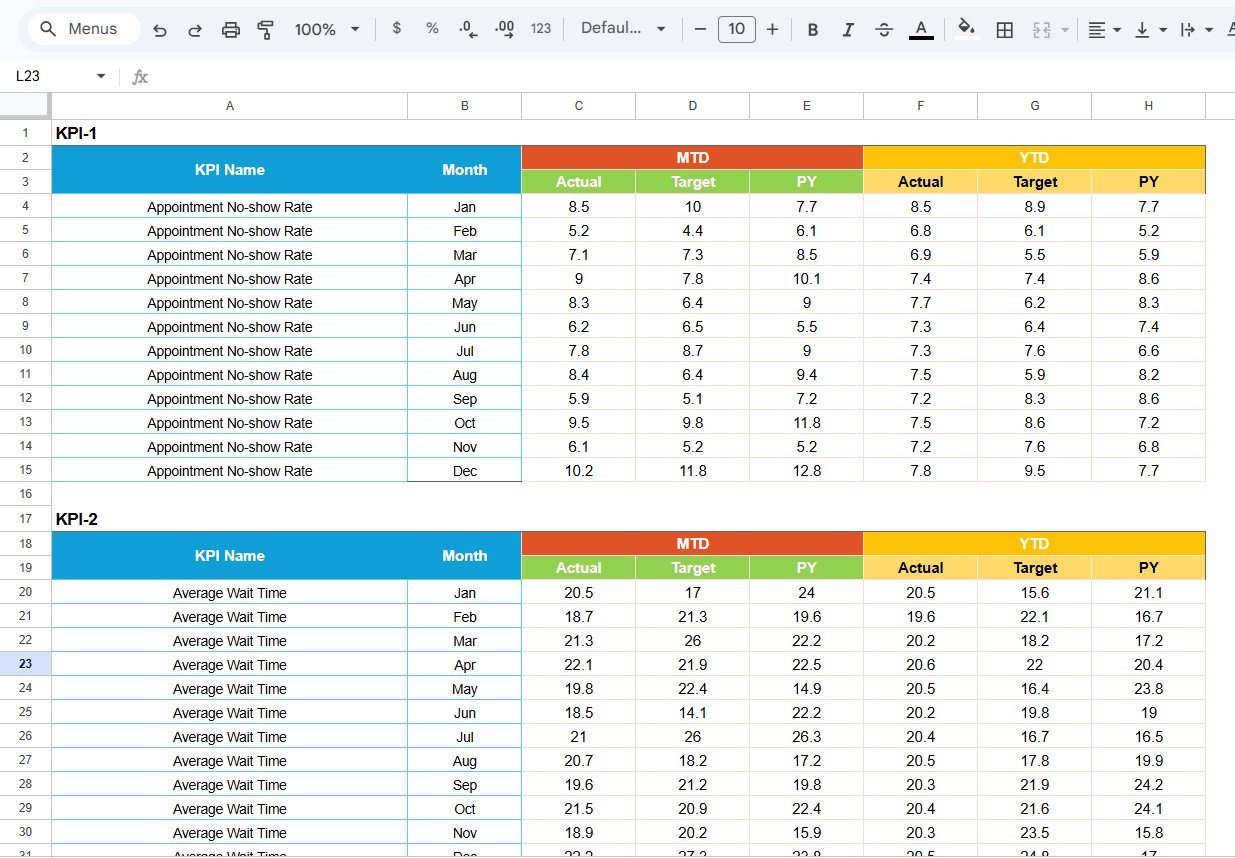
The Input Data sheet is where you enter all KPI data. It is the working sheet behind the scorecard and trend views.
- Data Entry: Record actual values, targets, previous year values, and other metrics for each KPI.
- Flexibility: Easily update data as new results become available, ensuring the scorecard remains current.
- Monthly Tracking: Maintain a structured history of KPI performance across reporting periods.
- Consistent Reporting: Keep data organized so formulas, charts, and scorecard summaries remain reliable.
For best results, one person or one reporting owner should maintain the input data sheet. This keeps the reporting process consistent and reduces the chance of accidental data errors. Teams can also protect formula cells or create a working copy before making major edits.
4. KPI Definition Sheet Tab
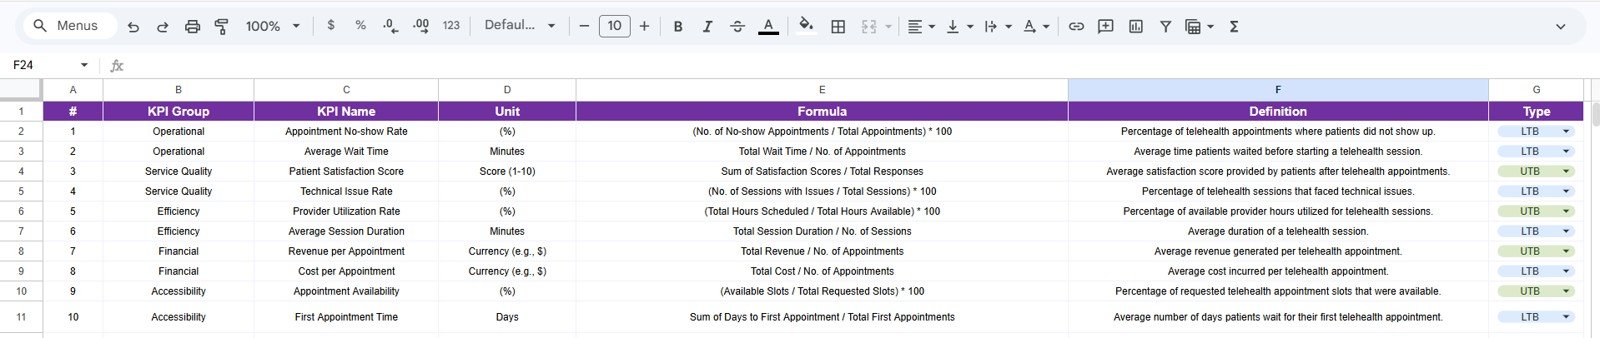
In the KPI Definition sheet tab, you can enter the KPI Name, KPI Group, Unit, Formula, and KPI definition. This sheet is important because every organization may define telehealth metrics slightly differently. For example, one team may define completed visit rate based on scheduled visits, while another may define it based on started visits. A definition sheet helps prevent confusion.
Clear KPI definitions are also useful when multiple departments use the same scorecard. Operations, finance, clinical leadership, and patient access teams can all review the same metric with the same understanding of what it means.
Example Telehealth KPIs You Can Track
The scorecard can be adapted for many common telehealth metrics, including:
- Total telehealth appointments
- Completed virtual visits
- Telehealth no-show rate
- Average virtual wait time
- Provider utilization rate
- Patient satisfaction score
- Technical issue rate
- Average consultation duration
- Follow-up completion rate
- Revenue per telehealth visit
- Claims denial rate for virtual visits
- Patient portal adoption rate
You can keep the default KPI structure, modify the KPI names, or add measures that match your organization’s reporting needs.
Google Sheets Scorecard Vs Excel Dashboard Vs Healthcare SaaS
| Option | Best For | Advantages | Limitations |
|---|---|---|---|
| Google Sheets KPI Scorecard | Teams that need a collaborative, low-cost, easy-to-edit scorecard | Cloud access, simple sharing, fast setup, no advanced BI license required | Manual data updates unless connected to automated workflows |
| Microsoft Excel Dashboard | Analysts who prefer desktop reporting and advanced spreadsheet modeling | Strong formulas, familiar interface, offline use, advanced formatting | Collaboration can be less seamless if files are emailed around |
| Healthcare SaaS Reporting Tool | Large organizations needing system integrations and enterprise controls | Automation, permissions, integrations, enterprise reporting features | Higher cost, longer implementation, less flexible for quick custom changes |
Who Should Use This Template?
- Telehealth program managers
- Healthcare operations teams
- Virtual care coordinators
- Medical practice administrators
- Hospital performance reporting teams
- Healthcare consultants
- Clinic owners and directors
- Analysts building healthcare KPI reports
- Remote patient care teams
Real-World Use Cases
This scorecard can support several practical healthcare reporting workflows. A telehealth operations manager can use it to review monthly appointment completion and no-show trends. A clinic administrator can compare patient access metrics against targets. A quality improvement team can track patient satisfaction and follow-up completion. A finance team can monitor telehealth revenue indicators and reimbursement-related KPIs.
The template can also be useful for consulting projects. If you support healthcare clients, this scorecard gives you a professional structure for KPI discussions without spending hours designing a reporting file from scratch.
Advantages Of A Ready-To-Use Telehealth Scorecard
- Saves setup time: The structure, worksheets, scorecard layout, and trend view are already prepared.
- Improves reporting consistency: KPI definitions and formulas can be managed in one place.
- Supports better meetings: Managers can focus on KPI performance instead of formatting spreadsheets.
- Works in the cloud: Google Sheets makes the file easy to access and share.
- Affordable reporting solution: A one-time template purchase is often more practical than a monthly software subscription for smaller teams.
Opportunities For Improvement
Like any spreadsheet-based reporting tool, the scorecard is most effective when the input data is accurate and updated regularly. Larger healthcare organizations may eventually want to connect reporting directly to scheduling, patient portal, billing, or EHR systems. The Google Sheets scorecard can still be valuable as a fast reporting layer, a prototype, or a management review tool, but it is not a replacement for a full enterprise data warehouse.
Teams can improve the template further by adding automated imports, creating protected ranges, adding additional KPI groups, or linking it to Looker Studio for web-based visualization.
Best Practices For Using The Scorecard
- Update the input data on a fixed reporting schedule.
- Assign one owner for KPI definitions and formula changes.
- Review low-performing KPIs during monthly operating meetings.
- Use the trend sheet before making decisions based on one period of data.
- Keep KPI names short and definitions clear.
- Make a backup copy before major template customization.
- Separate data entry work from management review whenever possible.
Explore Relevant Templates
If you work with healthcare, telehealth, or medical practice reporting, these templates may also be useful:
- Telehealth KPI Scorecard In Google Sheets
- Telehealth Dashboard in Power BI
- Telehealth KPI Dashboard in Excel
- Medical Practice Dashboard in Google Sheets
- Hospital Operations KPI Scorecard in Google Sheets
Frequently Asked Questions
Is this Telehealth KPI Scorecard ready to use?
Yes. The template is designed as a ready-to-use Google Sheets scorecard. You can update the input data and customize KPI definitions based on your reporting needs.
Can I change the KPI names and formulas?
Yes. The KPI Definition sheet allows you to maintain KPI names, groups, units, formulas, and definitions. You can adjust the template to match your organization’s reporting structure.
Does the template support MTD and YTD tracking?
Yes. The scorecard is designed to show month-to-date and year-to-date performance views, including actual vs target comparisons.
Can this be used by hospitals and small clinics?
Yes. The structure is flexible enough for hospitals, medical practices, virtual care programs, specialty clinics, and healthcare consultants.
Do I need advanced Google Sheets skills?
No. Basic spreadsheet knowledge is enough for routine use. Advanced users can further customize formulas, formatting, charts, and reporting logic.
About The Creator
Built by PK – Microsoft Certified Professional with 15+ years of Excel, Google Sheets, and Power BI experience. Founder of NextGenTemplates, reaching 300K+ subscribers across YouTube channels. Every template is hand-built and tested before release.
Conclusion
The Telehealth KPI Scorecard In Google Sheets is a practical reporting template for healthcare teams that need better visibility into virtual care performance. With a scorecard sheet, KPI trend view, input data sheet, and KPI definition sheet, it gives teams a structured way to monitor actuals, targets, MTD results, YTD results, and performance trends.
Instead of building a telehealth reporting file from the beginning, you can start with a professional template and customize it for your organization. Visit the product page here: Telehealth KPI Scorecard In Google Sheets.
For more spreadsheet dashboard tutorials and template walkthroughs, visit the NextGenTemplates YouTube channel.