Print Shop Dashboard in Google Sheets gives a print business 6 worksheet tabs, 4 high-level KPI cards, 16 analysis charts, multiple slicers, and 1 order lookup page in a single shareable spreadsheet. Instead of checking separate files for revenue, order status, service type, customer segment, and payment method, the dashboard puts the main numbers in one view. The template is priced at $9.99 during the current sale and is built for teams that want a Google Sheets dashboard they can duplicate, edit, and share quickly.
This article explains what is inside the dashboard, how each page supports print shop reporting, and where it fits compared with an Excel dashboard or paid print shop management software. You can view the Print Shop Dashboard in Google Sheets product page here.
Key Features of Print Shop Dashboard in Google Sheets
The dashboard is designed around day-to-day print shop decisions: how much revenue came in, how many orders were completed, which services are driving sales, and which customer segments need attention. Because it is built in Google Sheets, it can be shared with team members without installing extra software.
- 4 KPI cards: Total Revenue, Total Orders, Avg Order Value, and Biggest Order.
- 6 worksheet tabs: Overview, Orders Analysis, Customers Analysis, Services Analysis, Search Sheet, and Data Sheet.
- Multiple slicers: Filter the dashboard quickly by the fields that matter to your operation.
- Order lookup: Search by Order ID and instantly display the full order record.
- Service reporting: Analyze revenue, status, and production volume by service type.
- Customer reporting: Review customer segment, order source, payment method, and month-by-month revenue trends.
Dashboard Pages Explanation
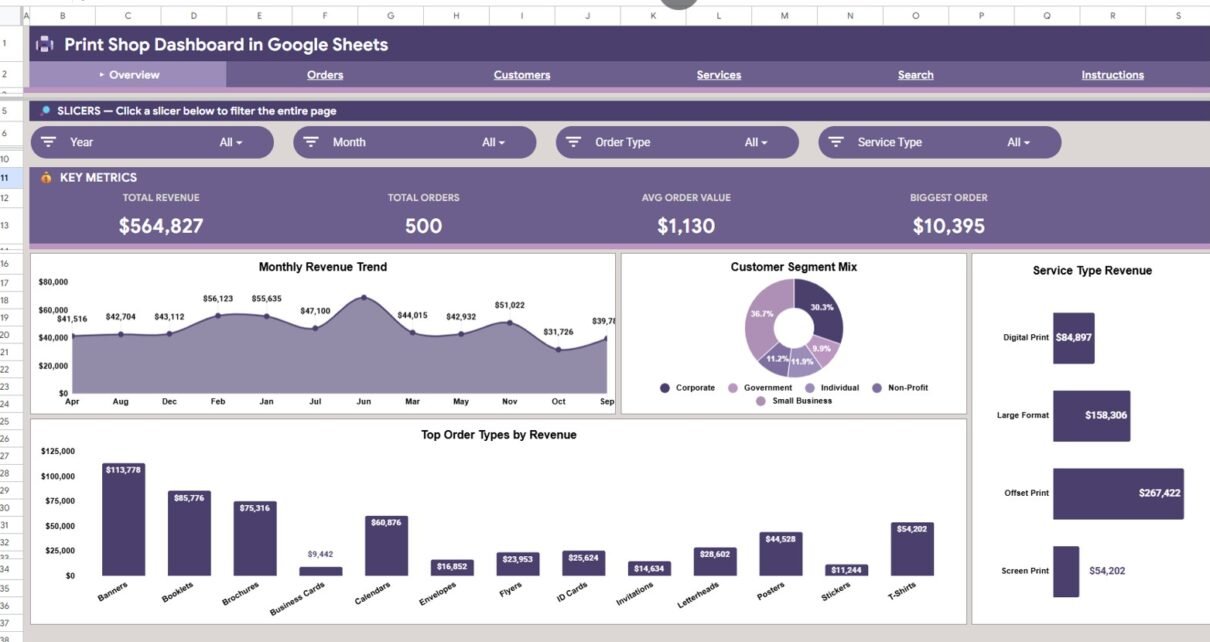
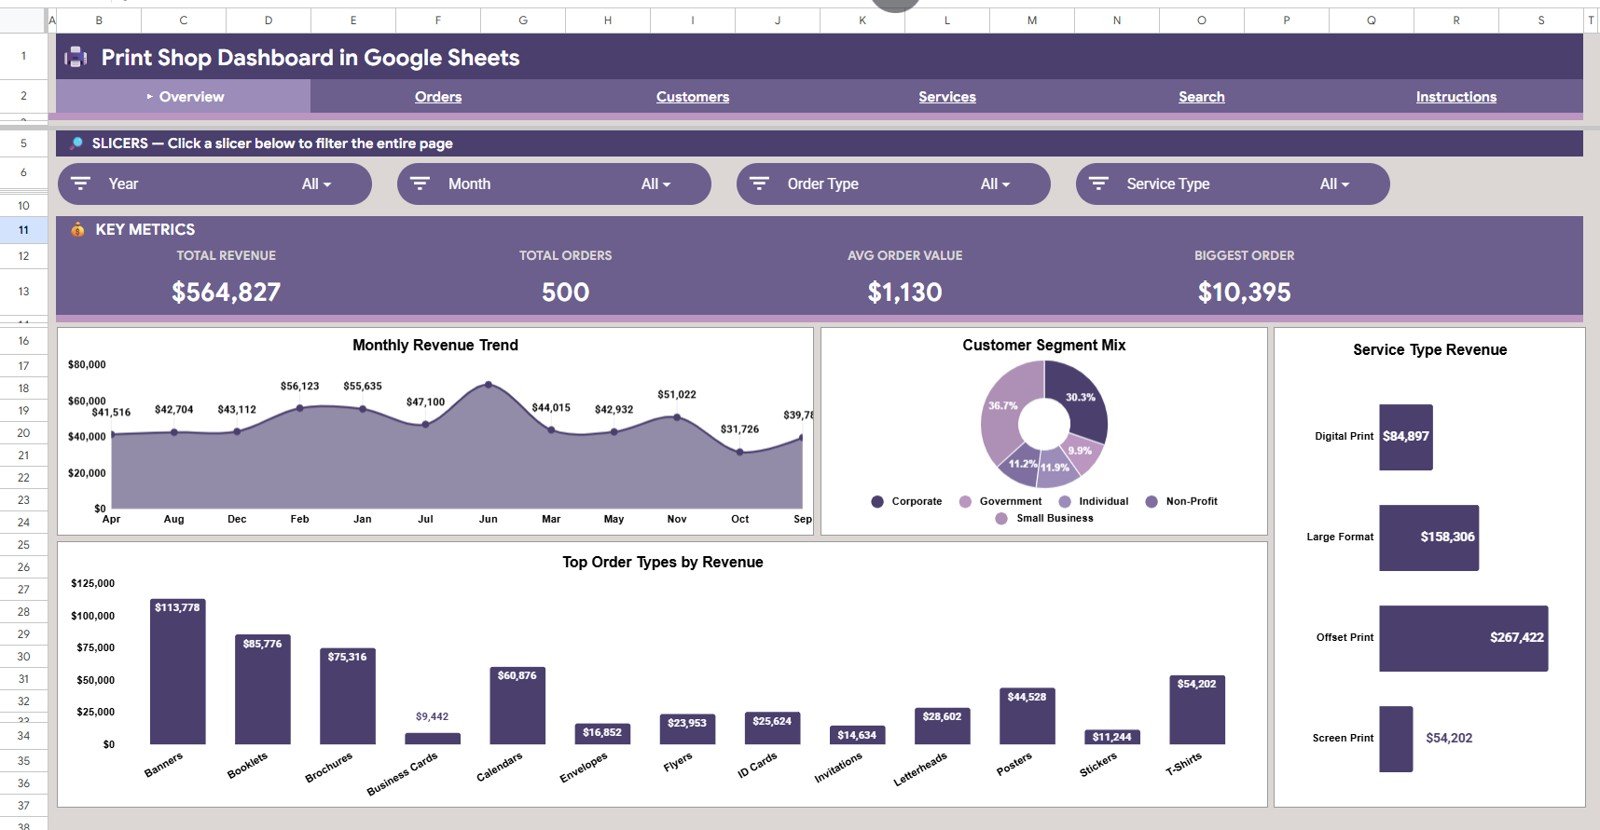
Overview Page
The Overview page is the executive summary of the workbook. At the top, the cards show Total Revenue, Total Orders, Avg Order Value, and Biggest Order so the user can quickly understand the current performance level.
Revenue by Month: This chart shows how revenue changes across the year. It helps identify strong months, slower periods, and seasonal print demand.
Revenue by Customer Segment: This chart compares revenue from customer groups such as corporate, retail, school, event, or agency clients. It helps the shop understand which customer type is contributing the most sales.
Revenue by Service Type: This chart breaks revenue down by printing services such as flyers, business cards, banners, brochures, and other service categories. It helps identify the most valuable services in the mix.
Revenue by Order Type: This chart separates revenue by order category so users can compare recurring jobs, walk-in jobs, custom jobs, and standard print orders. It is useful for deciding where to focus promotions and production planning.
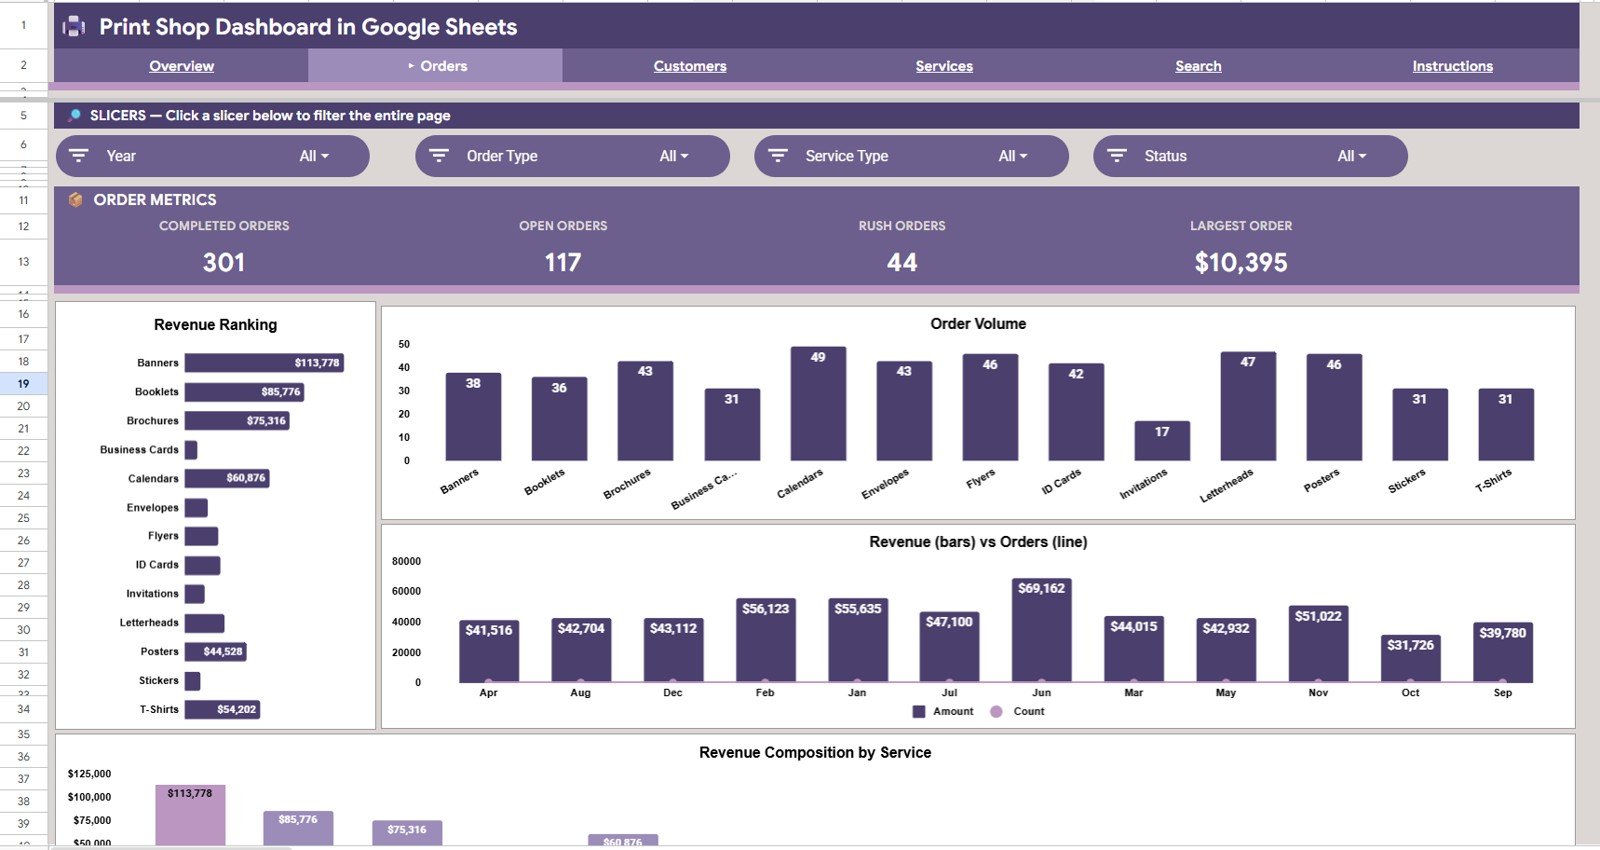
Orders Analysis
The Orders Analysis tab focuses on order performance. It helps managers compare order types, order counts, monthly trends, and service revenue without scrolling through raw data.
Revenue by Order Type: This chart shows which order types produce the highest revenue. It supports pricing and sales decisions by showing where the money is coming from.
Order Count by Order Type: This chart compares the number of orders in each order category. It helps distinguish high-volume work from high-value work.
Revenue and Orders by Month: This combined analysis shows whether revenue is growing because of more orders or larger order values. It is useful for spotting months where volume and revenue move in different directions.
Revenue by Service Type: This chart links order performance back to specific print services. It helps the shop understand which services are generating the strongest revenue inside the order pipeline.
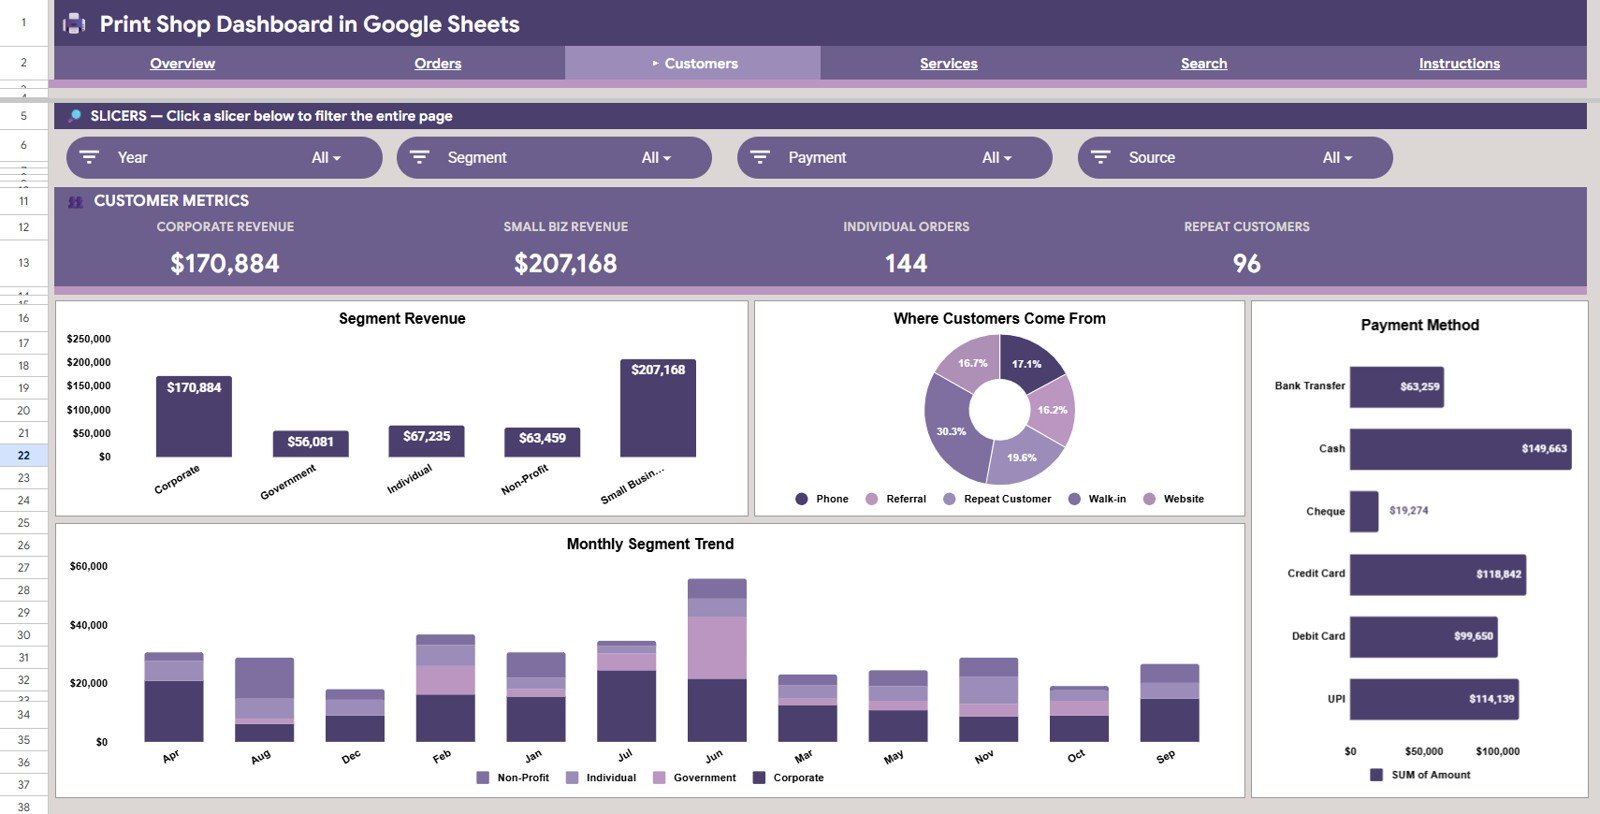
Customers Analysis
The Customers Analysis tab helps print shops understand who is buying, where orders are coming from, and how payment methods affect sales tracking. This is useful for marketing, account management, and customer follow-up.
Revenue by Customer Segment: This chart shows which customer groups contribute the most revenue. It helps the business decide which segments deserve more outreach.
Order Count by Order Source: This chart compares orders from channels such as walk-in, website, referral, social media, and repeat customers. It helps measure which order sources are bringing in the most activity.
Revenue by Payment Method: This chart shows sales by payment type. It helps owners review customer payment behavior and reconcile revenue by method.
Revenue by Customer Segment by Month: This monthly chart tracks customer segment revenue over time. It helps spot shifts in customer demand before they become obvious in the total revenue number.
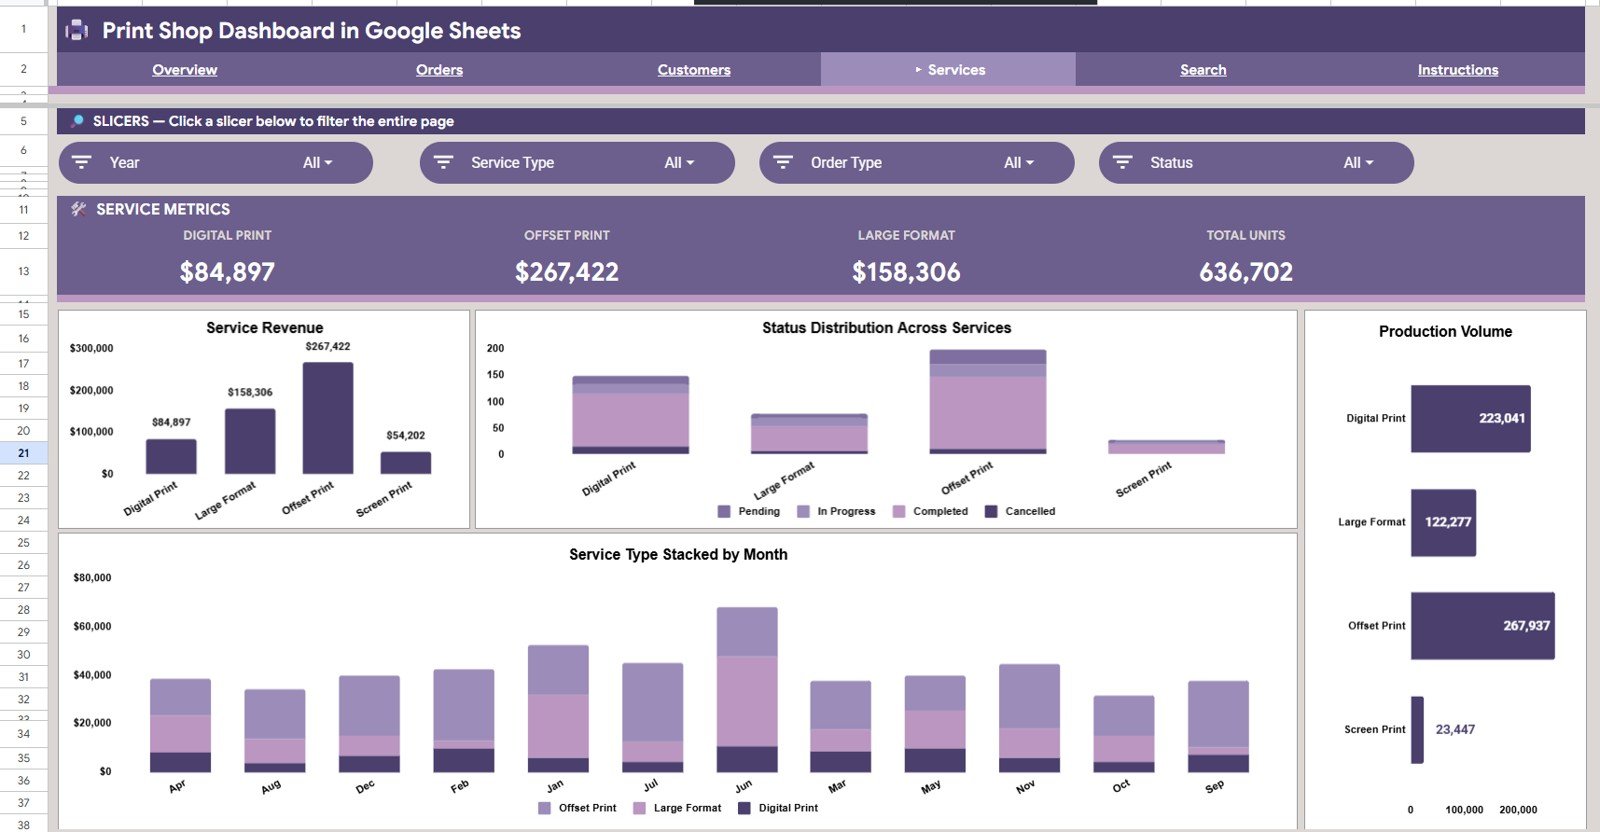
Services Analysis
The Services Analysis tab focuses on the work being produced by the print shop. It is especially useful for reviewing service mix, order status, monthly service demand, and production volume.
Revenue by Service Type: This chart ranks print services by revenue. It helps identify which services deserve more marketing attention or pricing review.
Order Status by Service Type: This chart connects service categories with status values such as completed, pending, in production, or cancelled. It helps managers see where orders may be slowing down.
Production Volume by Service Type: This chart shows volume by service category. It helps production teams understand workload and capacity pressure.
Revenue by Service Type by Month: This monthly view shows how service revenue changes across time. It is helpful for planning seasonal offers and preparing materials.
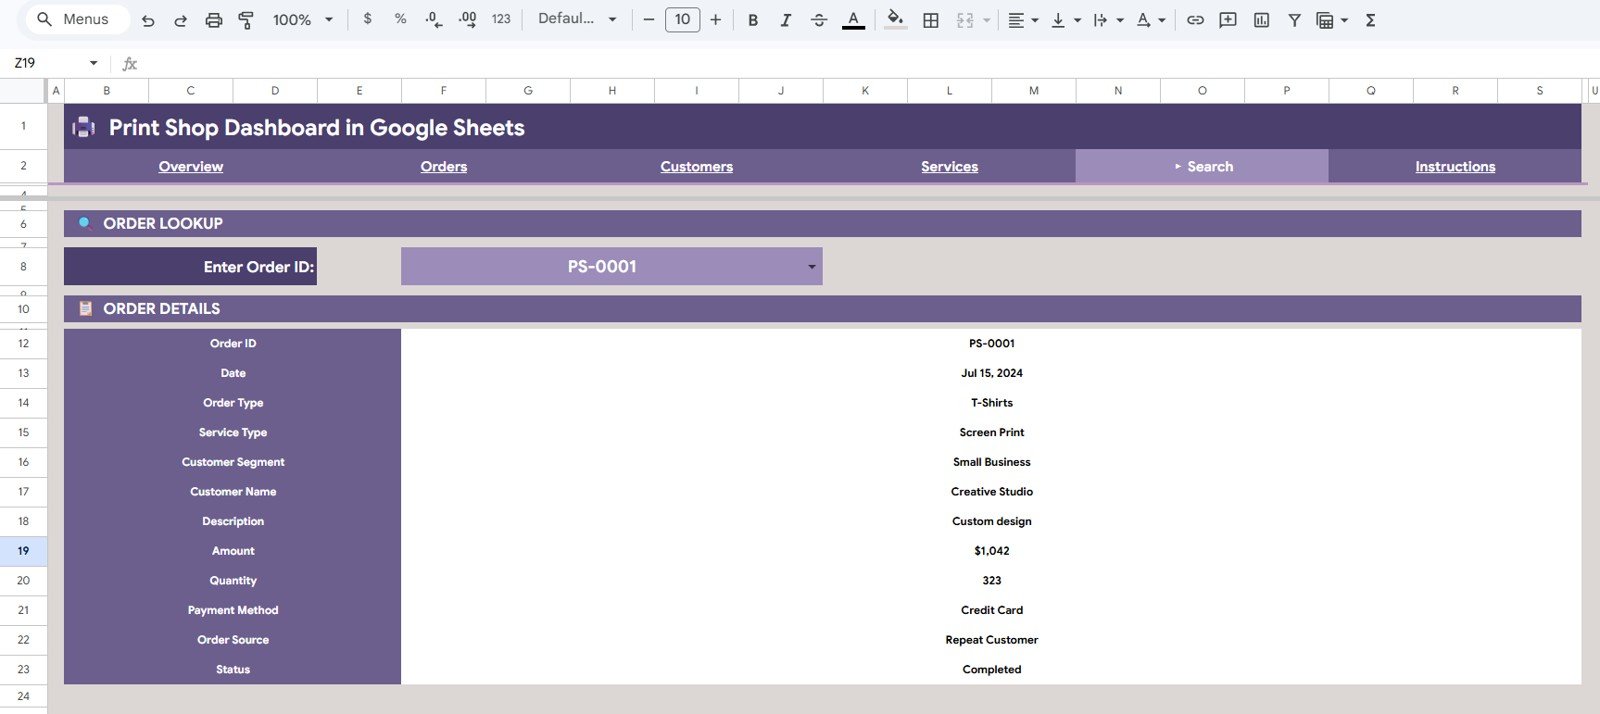
Search Sheet
The Search sheet makes single-order lookup simple. Enter the Order ID at the top of the page and the sheet displays every detail for that order, including Order ID, Date, Order Type, Service Type, Customer Segment, Customer Name, Description, Amount, Quantity, Payment Method, Order Source, and Status.
This is useful when a customer calls with a question, when a manager needs to confirm payment method, or when a production team wants to verify status without searching through the full data sheet.
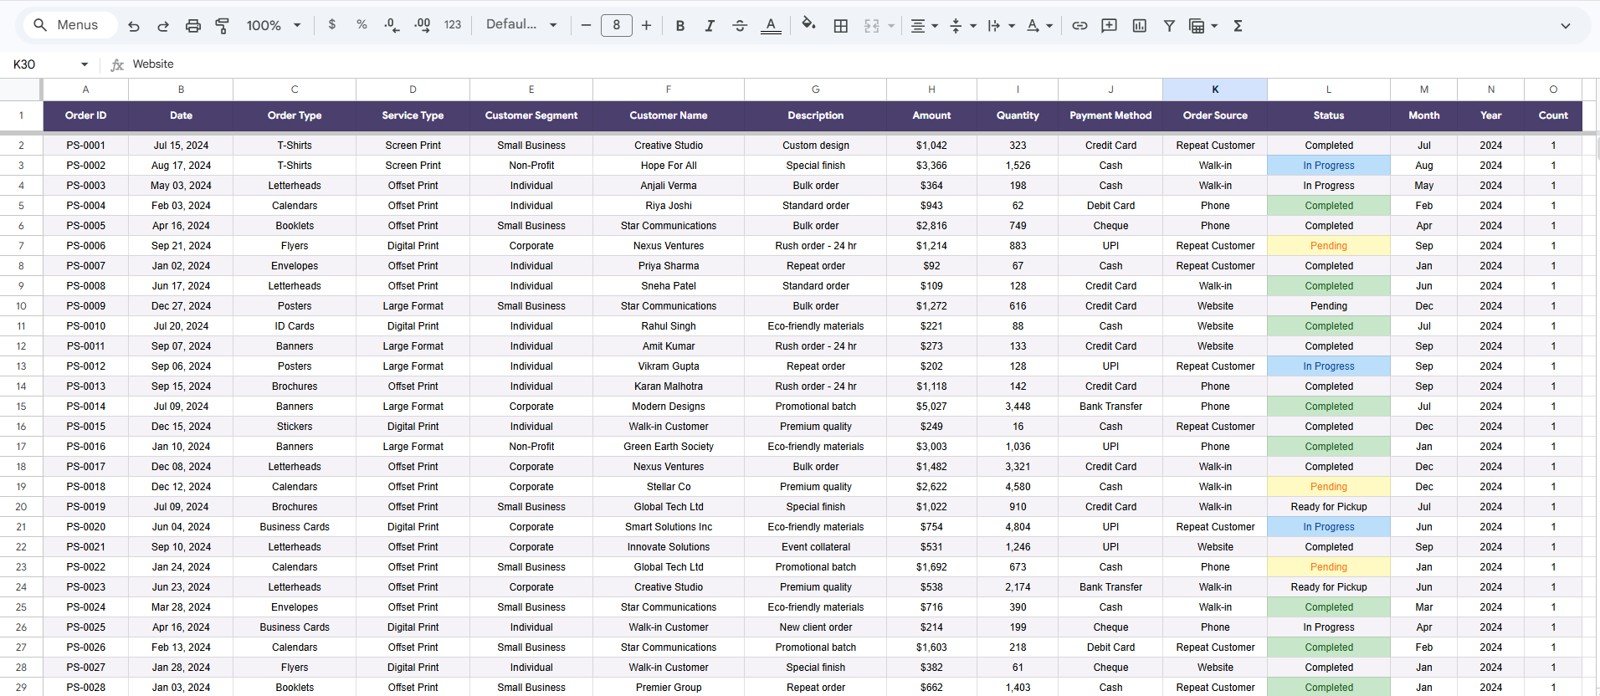
Data Sheet Tab
The Data sheet is where the source data lives. Users add new records in the same format so the dashboard, slicers, cards, and charts can refresh from a clean structure.
Keeping the Data sheet consistent is important. The dashboard works best when each row represents one order and the fields stay aligned with the existing columns.
Print Shop Dashboard in Google Sheets vs. Excel Dashboard vs. Paid CRM/SaaS – Feature Comparison
| Feature | Print Shop Dashboard in Google Sheets | Excel dashboard or paid SaaS alternative |
|---|---|---|
| Cost | One-time template price of $9.99 during sale | Excel may be one-time, while SaaS tools can require monthly subscriptions |
| Platform | Runs in Google Sheets | Excel runs locally or in Microsoft 365; SaaS runs in a vendor platform |
| Setup time | Duplicate the file and start entering order data | SaaS setup often needs configuration, imports, and user onboarding |
| Team collaboration | Share the sheet with team members using Google account permissions | Excel collaboration depends on Microsoft 365; SaaS requires user seats |
| Mobile access | Accessible through Google Sheets mobile apps | SaaS usually has mobile access, but may limit features by plan |
| Customizable fields | Editable columns, formulas, charts, and slicers | SaaS customization may require higher plans or admin setup |
| Year-1 cost at 5 users | Template purchase plus your existing Google Workspace setup | Paid systems can become expensive when priced per user per month |
| Print shop order lookup | Built-in Order ID search sheet | Often available in SaaS, but not always easy to customize |
| Service mix analysis | Built-in charts for revenue, production volume, and status by service type | May require custom reports or exports in other tools |
Who Should Use This Template
This template is a good fit for small and mid-sized print shops, copy centers, design-and-print studios, school print rooms, franchise print counters, and solo operators who want faster reporting without buying a full print management system.
It is especially useful for owners who already track jobs in a spreadsheet and want a cleaner reporting layer. It is not the right fit for teams that need built-in invoicing, automated barcode scanning, production scheduling, inventory purchasing, or direct machine integrations.
Real-World Use Cases
Rajan, print shop owner: Rajan checks the Overview page every Monday to see total revenue, average order value, and the biggest order from the previous week. He uses the service charts to decide which services should be promoted next.
Divya, operations coordinator: Divya uses the Orders Analysis and Services Analysis tabs to understand workload by order type and service type. When a job is delayed, she checks status by service category and follows up with the production team.
Marco, customer account manager: Marco uses the Customers Analysis tab to review revenue by customer segment and order source. He then prioritizes follow-up with the segments that bring repeat or high-value orders.
Advantages of Print Shop Dashboard in Google Sheets
The main advantage is speed. A print shop can begin using the template without a software rollout, and the team can view the file from the same Google Sheets environment they already know.
The second advantage is transparency. The formulas, charts, tables, and source data remain visible, so users can adjust the workbook as their reporting needs change. The third advantage is collaboration, because Google Sheets makes it easy to share a live file with managers, sales staff, or production coordinators.
Opportunities for Improvement
The template is intentionally spreadsheet-based, so it does not replace a full print shop MIS or ERP. Teams that need workflow automation, automatic proof approvals, machine-level production data, or accounting sync will still need connected systems.
Another improvement area is data discipline. The dashboard depends on clean order records. If team members skip fields, use inconsistent service names, or change column headers without updating formulas, the analysis may need adjustment.
Best Practices
Start by keeping the Data sheet clean. Use consistent values for Order Type, Service Type, Customer Segment, Payment Method, Order Source, and Status so slicers and charts stay useful.
Review the Overview page weekly, then use the Orders, Customers, and Services tabs for deeper questions. If a manager only needs one order, use the Search Sheet instead of filtering the full data table.
Google Sheets also supports chart editing, ranges, and formatting controls. For general chart guidance, see the official Google Support page for charts and graphs in Google Sheets.
Explore Relevant Templates
For nearby reporting options, explore the Print Shop Dashboard in Excel, Print Shop Dashboard in Power BI, Printing and Publishing Dashboard in Power BI, Receipt Template in Google Sheets, and Event Management Analysis Dashboard in Google Sheets.
Frequently Asked Questions
What is the Print Shop Dashboard in Google Sheets?
It is a ready-made Google Sheets dashboard for tracking print shop revenue, orders, customer segments, service types, order sources, payment methods, and status.
Does this template work without Excel?
Yes. This version is designed for Google Sheets, so you can use it in a browser with a Google account.
Can I filter the dashboard?
Yes. The dashboard includes multiple slicers so users can quickly filter views and review specific parts of the data.
What does the Search Sheet do?
The Search Sheet lets you enter an Order ID and display the matching order details, including customer name, amount, quantity, payment method, order source, and status.
Can I customize the Data Sheet?
You can edit the workbook, but the safest approach is to keep the existing column structure and add data in the same format. Major field changes may require chart and formula updates.
Is this a replacement for print shop management software?
No. It is best for reporting and analysis. It does not include invoicing, proofing workflows, inventory purchasing, or production automation.
Who is this dashboard best for?
It is best for small and mid-sized print shops, print counters, copy centers, and teams that already use spreadsheets to track orders.
About the Author
Built by PK – Microsoft Certified Professional with 15+ years of Excel, Google Sheets, and Power BI experience. Founder of NextGenTemplates, reaching 300K+ subscribers across YouTube channels. Every template is hand-built and tested before release.
Conclusion
The Print Shop Dashboard in Google Sheets gives print shop owners a practical way to track revenue, orders, customers, services, and individual order details from one workbook. It is simple enough for daily use but structured enough to support better decisions across sales, operations, and production.
Get the Print Shop Dashboard in Google Sheets and start organizing your print shop reporting in one place. For more Google Sheets and automation walkthroughs, visit NeoTech Navigators on YouTube.
Last updated: May 2026.