Managing a franchise network is much easier when revenue, costs, locations, operating performance, and transaction details are visible in one clean reporting system. The Franchise Network Analytics Dashboard in Google Sheets is designed for franchise owners, regional managers, business analysts, and operations teams that need a practical way to monitor performance across multiple locations without building reports from scratch.
This Google Sheets dashboard includes multiple analysis pages, executive KPI cards, interactive slicers, chart-driven reporting, a structured data sheet, and a franchise transaction lookup page. It helps you track revenue, COGS, net profit, transaction volume, location performance, franchise type mix, and operating trends in a single spreadsheet-based template.
View the Franchise Network Analytics Dashboard in Google Sheets
What Is the Franchise Network Analytics Dashboard?
The Franchise Network Analytics Dashboard is a ready-to-use Google Sheets reporting template for analyzing franchise performance. Instead of manually preparing separate reports for sales, operations, locations, and transaction records, the template organizes the core metrics into dedicated tabs with charts, slicers, KPI cards, and lookup functionality.
The dashboard is especially useful for teams that want a lightweight reporting solution in Google Sheets. Google Sheets works well for collaborative spreadsheet reporting, shared data entry, and browser-based dashboard review, while Google’s official file limits guidance helps teams understand how spreadsheet size and file storage should be managed as data grows.
Key Dashboard Pages Included
Get the Franchise Network Analytics Dashboard in Google Sheets
This template includes separate dashboard pages for overview reporting, revenue analysis, operations tracking, location performance, data management, and transaction search. Each page is built around a different business question so users can move from high-level executive review to detailed transaction lookup quickly.
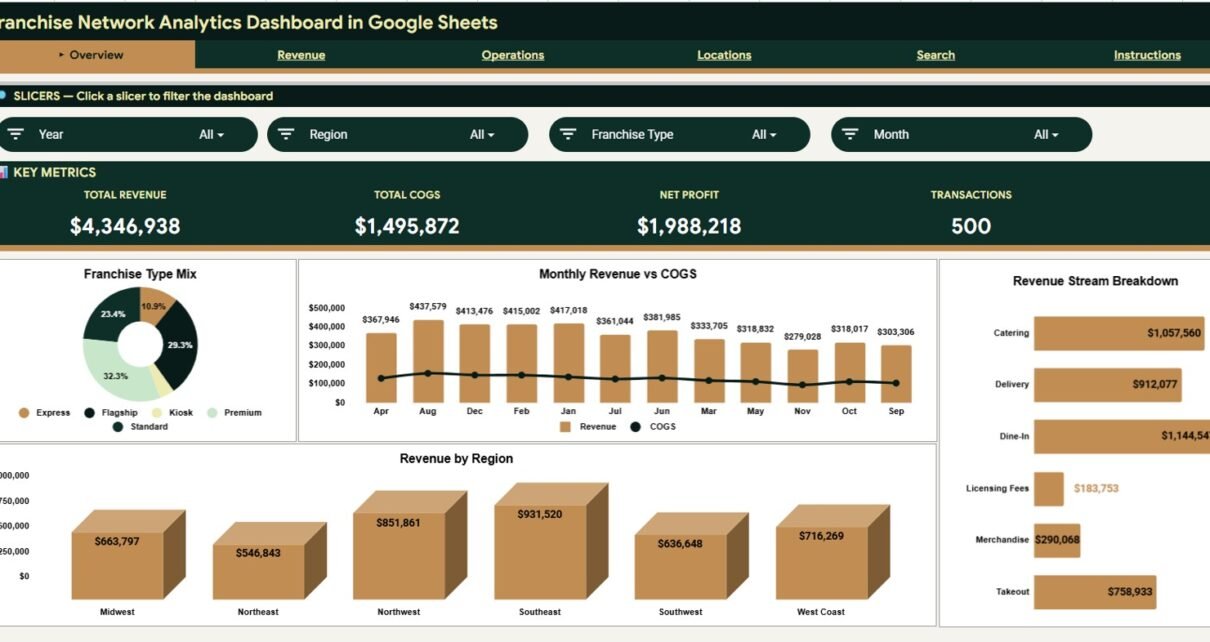
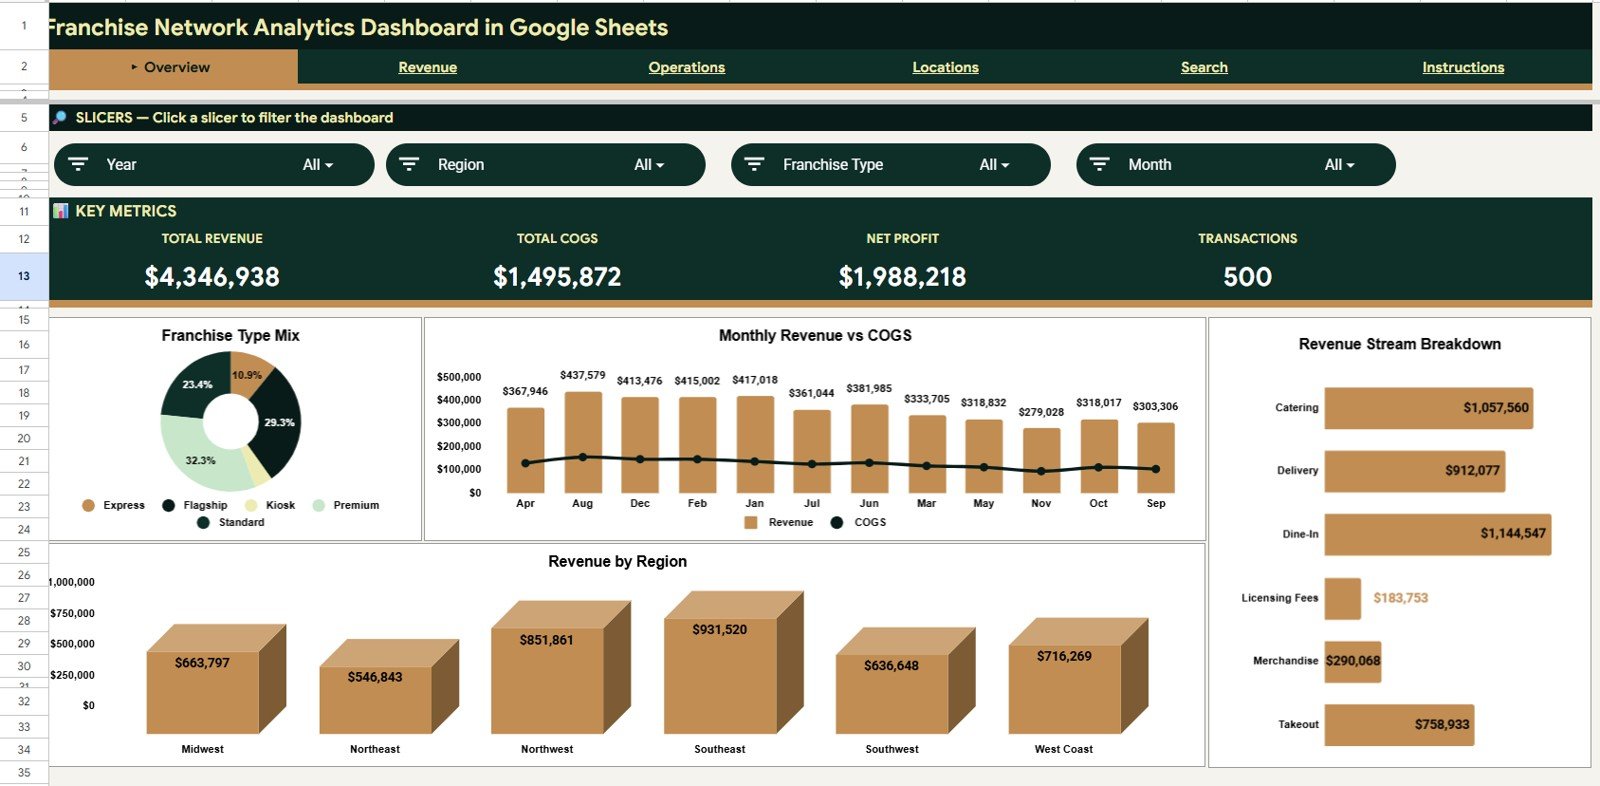
1. Overview Page
The Overview page is the executive summary of the franchise network. At the top of the sheet, the dashboard displays high-level KPI cards for Total Revenue, Total COGS, Net Profit, and Transactions. These cards help users instantly understand the financial position and activity level of the franchise network.
The page also includes slicers so users can filter the dashboard quickly and review performance by selected segments such as region, franchise type, revenue stream, status, or date period depending on how the dataset is structured.
Franchise Type Mix by Franchise Type
This chart shows how the franchise network is distributed across different franchise types. It helps identify whether the business is balanced across concepts or concentrated in a small number of franchise models.
Revenue and COGS by Month
This monthly comparison chart displays revenue beside COGS so users can review margin movement over time. It is useful for spotting seasonal cost pressure, revenue growth, or declining profitability trends.
Revenue by Region
This chart breaks revenue down by region so leadership can compare geographic performance. It helps identify strong regional markets and locations that may require operational support.
Revenue by Revenue Stream
This chart shows how revenue is divided across the available revenue streams. It helps teams understand which revenue categories drive the network and where additional growth opportunities may exist.
Get the Franchise Network Analytics Dashboard in Google Sheets
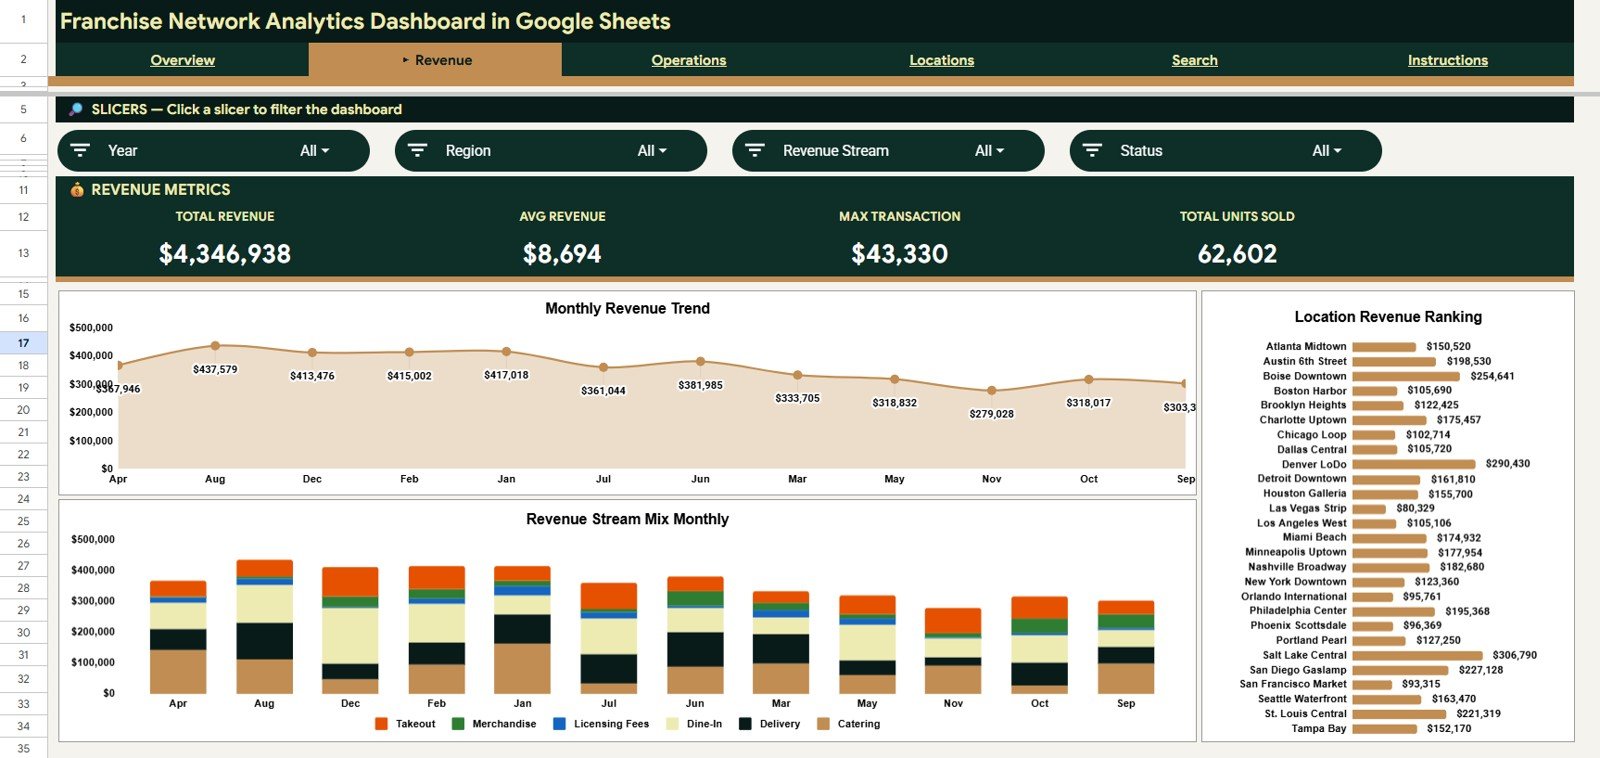
2. Revenue Page
The Revenue page focuses on sales performance across time, revenue streams, and locations. This is where users can review revenue patterns in more detail and understand which parts of the franchise network are generating the most income.
Total Revenue by Month
This chart tracks total revenue month by month. It helps users understand overall growth trends, seasonal changes, and revenue dips that may need follow-up.
Revenue by Revenue Stream and Month
This chart compares revenue streams over time so users can see which streams are growing or shrinking. It is helpful for evaluating product lines, service categories, royalties, fees, or other revenue sources.
Revenue by Location
This chart ranks or compares revenue at the location level. It helps franchise managers identify top-performing branches and locations that may need sales support, marketing attention, or operational review.
Get the Franchise Network Analytics Dashboard in Google Sheets
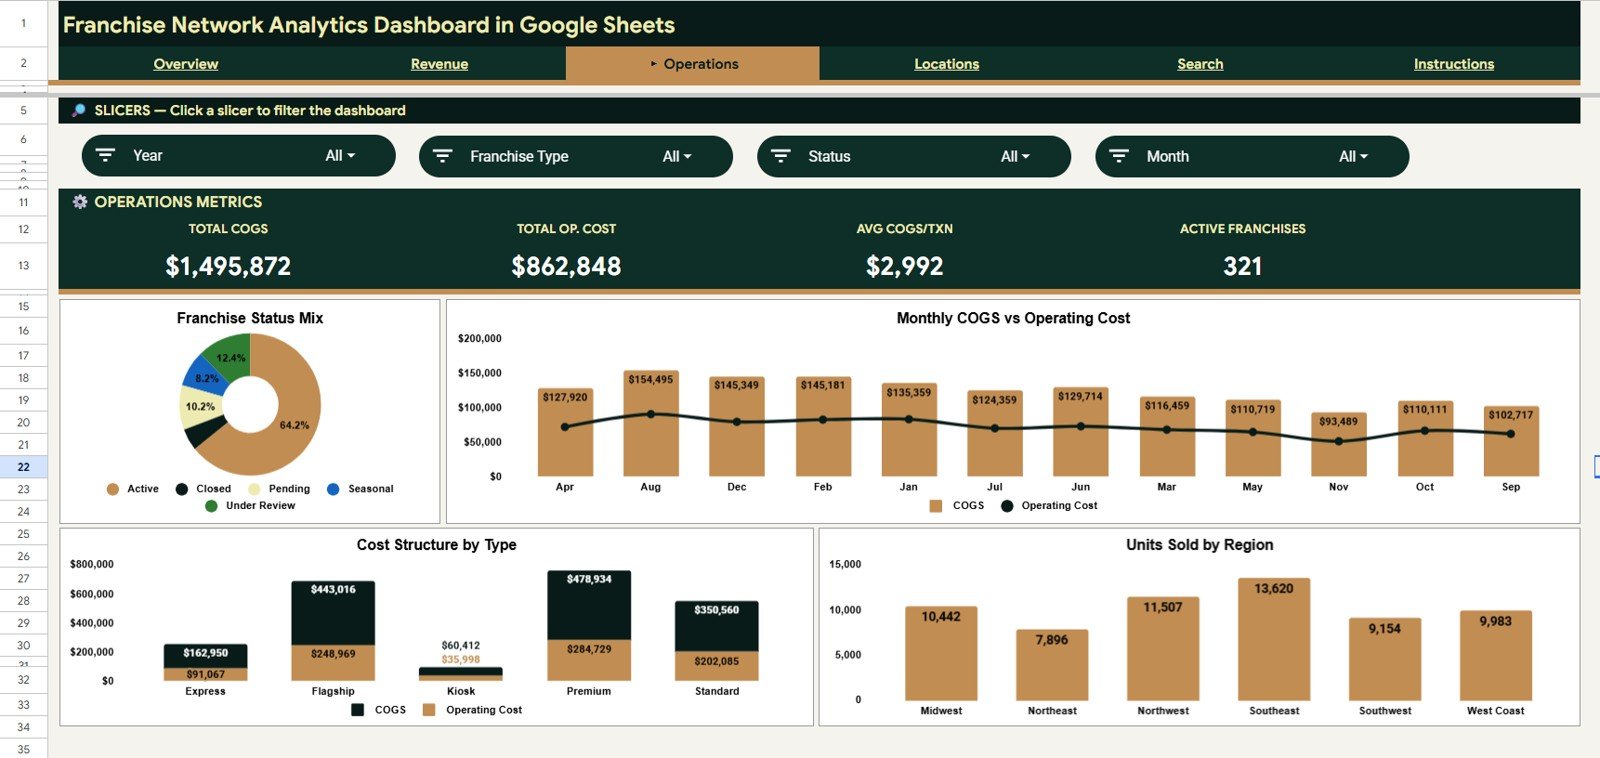
3. Operations Page
The Operations page helps users monitor franchise activity, cost behavior, franchise status, and unit movement. It is useful for connecting financial performance with operational execution across the network.
Franchise Count by Status
This chart shows the number of franchise records by status. It helps users understand whether locations are active, inactive, pending, closed, or categorized under another operational status.
COGS and Operating Cost by Month
This chart compares cost of goods sold and operating cost across months. It helps identify cost increases, efficiency issues, and months where operating expenses may be pressuring profitability.
COGS and Operating Cost by Franchise Type
This chart compares cost structure across franchise types. It is useful for understanding which business models carry higher direct or operating costs.
Units Sold by Region
This chart shows unit movement by region. It helps users compare operational activity across territories and assess whether revenue differences are driven by volume, pricing, or cost behavior.
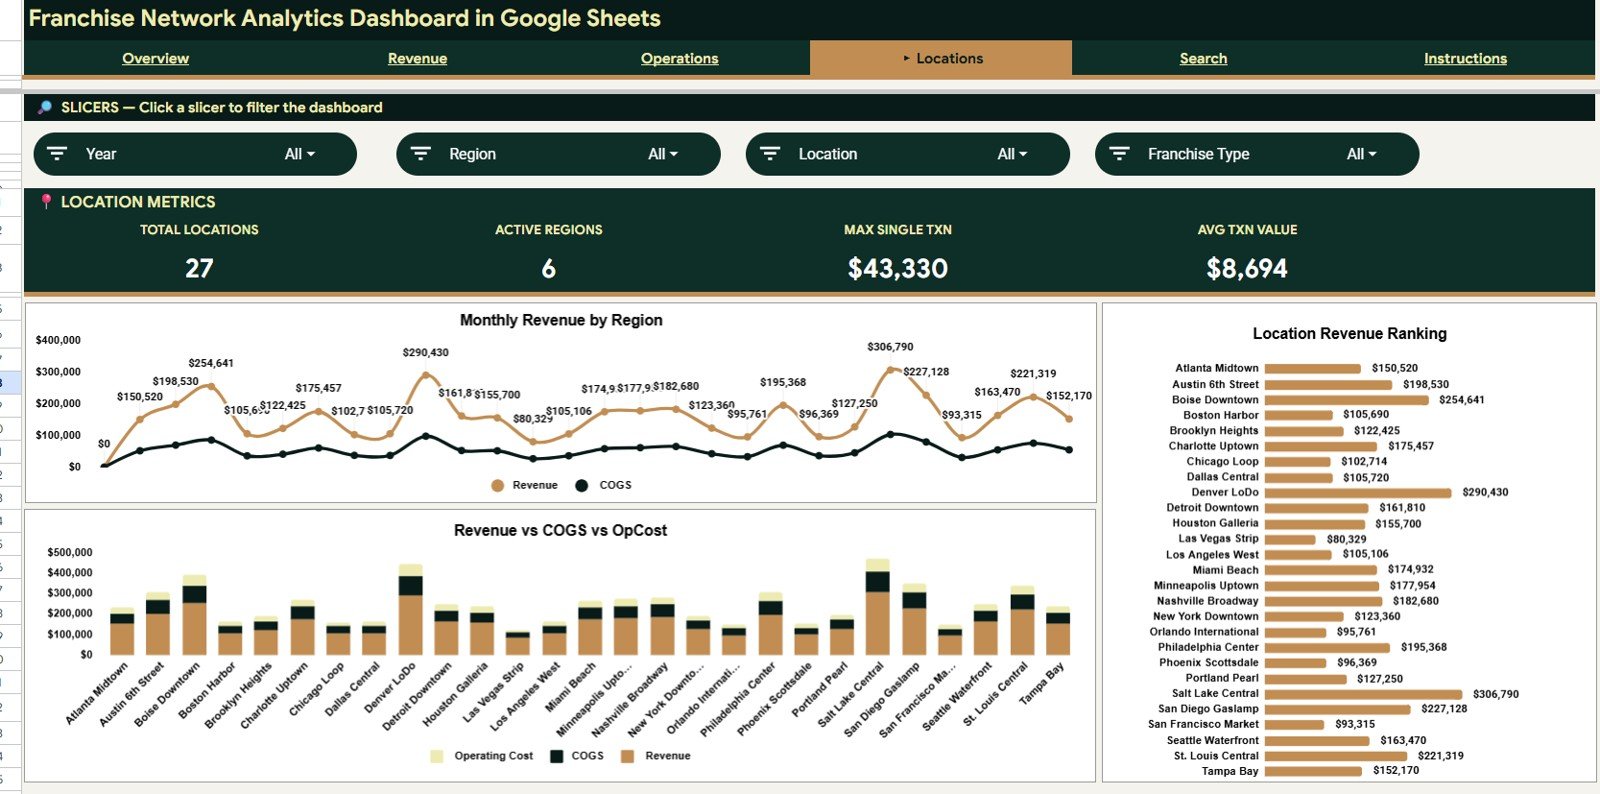
4. Locations Page
The Locations page is built for geographic and branch-level analysis. It helps franchise teams compare performance across regions and individual locations, making it easier to see where the network is strong and where attention is needed.
Revenue and COGS by Region
This chart compares revenue and cost of goods sold by region. It helps users identify high-revenue regions and determine whether strong sales are also translating into healthy gross performance.
Revenue, COGS and Operating Cost by Location
This chart provides a location-level comparison of key financial metrics. It is useful for identifying locations with high revenue but also high costs, or locations that may be underperforming relative to their cost base.
Revenue by Location
This chart focuses specifically on location revenue. It gives managers a fast way to rank branches and compare sales output across the franchise network.
Get the Franchise Network Analytics Dashboard in Google Sheets
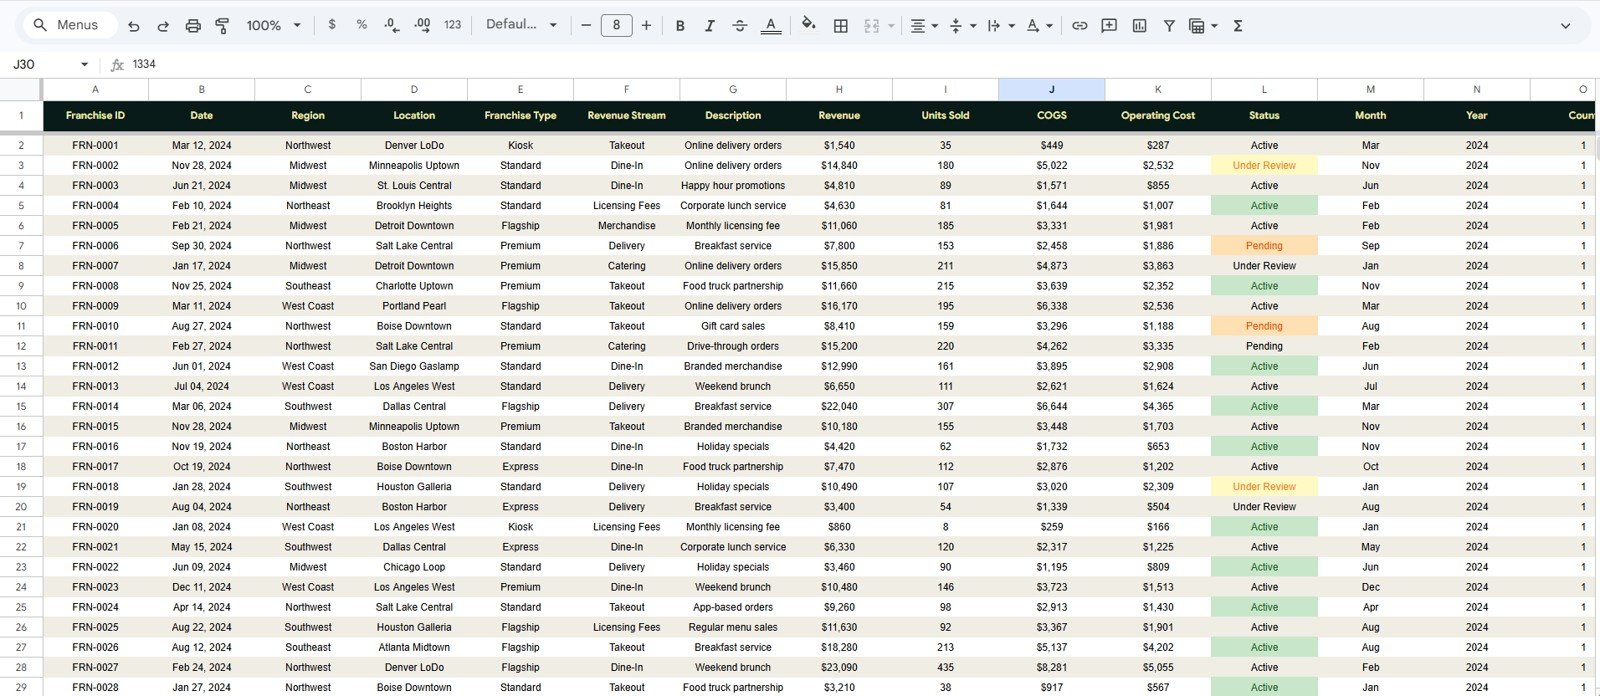
5. Data Sheet Tab
The Data Sheet tab is where the source records are stored in a consistent format. Users can add new franchise transaction data in the same structure and allow the dashboard pages to reflect updated results through the connected calculations, charts, and slicers.
The data structure supports fields such as date, region, location, franchise type, revenue stream, description, revenue, units sold, COGS, operating cost, and status. Keeping the data in a clean tabular format makes the dashboard easier to maintain and improves long-term reporting accuracy.
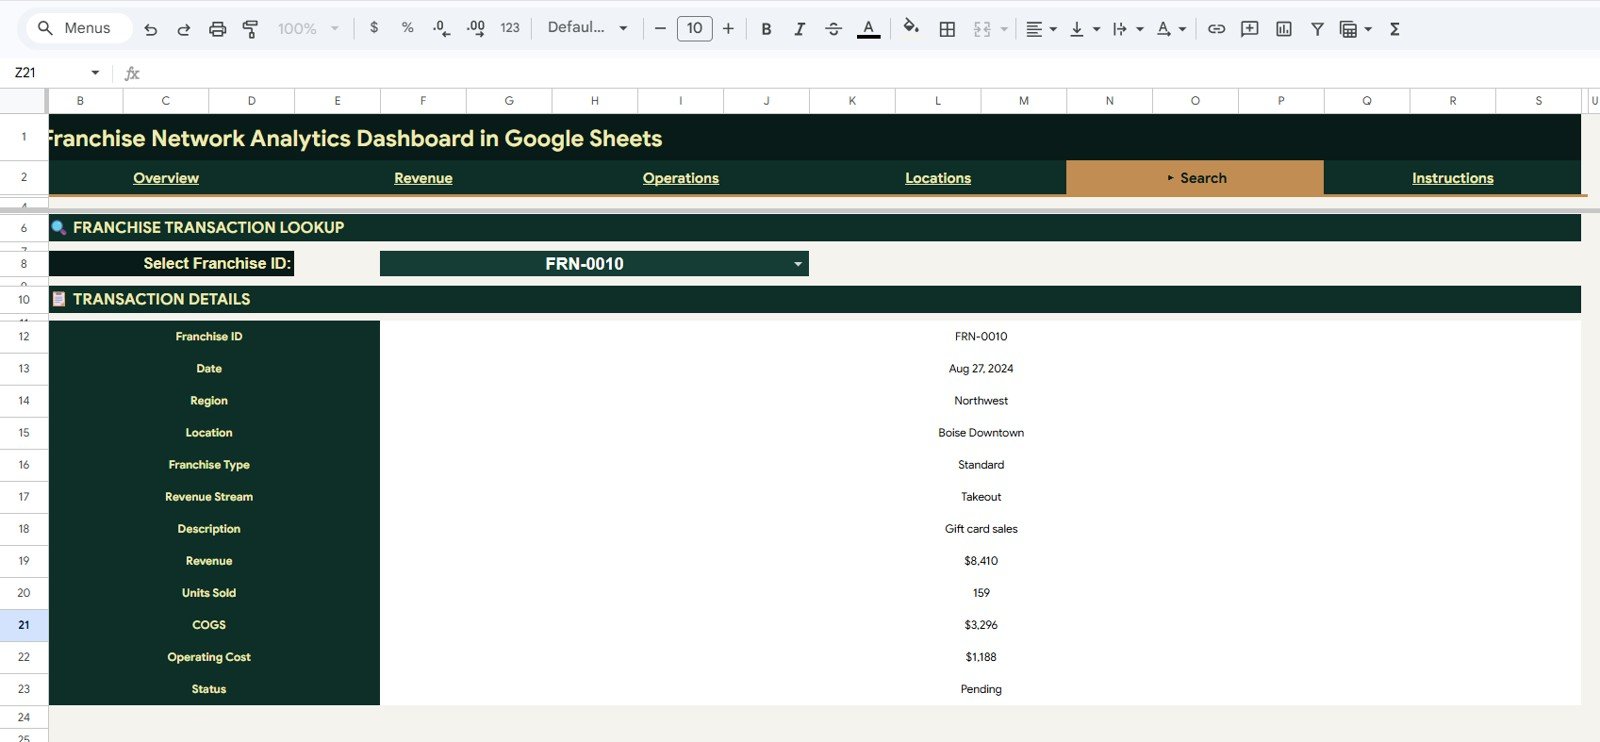
6. Search Sheet Tab
The Search Sheet works as a franchise transaction lookup page. The user can select a Franchise ID and instantly view the full transaction details, including date, region, location, franchise type, revenue stream, description, revenue, units sold, COGS, operating cost, and status.
This page is useful when a manager wants to inspect one record quickly without scrolling through the complete dataset. It can also support internal review, transaction validation, and location-level follow-up.
Who Should Use This Google Sheets Franchise Dashboard?
- Franchise owners who need a clear reporting view across locations
- Regional managers tracking revenue, cost, and branch performance
- Operations teams monitoring franchise status and cost behavior
- Business analysts preparing recurring franchise reports
- Consultants supporting franchise network reporting projects
- Small and mid-sized franchise businesses that prefer Google Sheets over complex software
Comparison: Spreadsheet Dashboard vs Manual Reporting vs Franchise Software
Get the Franchise Network Analytics Dashboard in Google Sheets
| Option | Best For | Main Advantage | Potential Limitation |
|---|---|---|---|
| Franchise Network Analytics Dashboard in Google Sheets | Fast spreadsheet-based franchise reporting | Affordable, editable, collaborative, and easy to customize | Requires consistent data entry discipline |
| Manual Spreadsheet Reports | Very small teams with limited reporting needs | Flexible and familiar | Time-consuming, inconsistent, and harder to scale |
| Dedicated Franchise Management Software | Large franchise networks with complex workflows | Advanced automation and system integrations | Higher cost and longer setup time |
Why This Dashboard Is Useful
The biggest advantage of this dashboard is that it brings financial and operational views together. Revenue alone does not tell the full story of franchise performance. By including COGS, operating cost, units sold, transaction volume, location views, and franchise status, the template gives users a more complete picture of how the network is performing.
Because the dashboard is built in Google Sheets, teams can work with a familiar tool, duplicate the template, update the data, and share the file with stakeholders. This makes it practical for franchise reporting workflows where managers need speed, visibility, and editability.
Best Practices for Using the Template
- Update the Data Sheet tab in the same column structure each time.
- Use consistent names for regions, locations, franchise types, and revenue streams.
- Refresh and review slicers after adding new data.
- Check cost fields carefully because COGS and operating cost affect profit analysis.
- Use the Search Sheet tab to validate specific franchise transaction records.
- Duplicate the file before making major customization changes.
Opportunities for Customization
Users can adapt the dashboard for their franchise model by changing region names, location names, franchise type labels, revenue streams, cost categories, and status values. The template can also be expanded with additional KPIs such as royalty percentage, average transaction value, marketing spend, franchisee contribution, customer count, or same-store growth if those fields are available in the source data.
Explore the Template
If you want a ready-made Google Sheets dashboard for franchise reporting, this template provides a strong starting point. It combines executive metrics, revenue analysis, operations tracking, location performance, structured data entry, and transaction lookup in one workbook.
Get the Franchise Network Analytics Dashboard in Google Sheets
Frequently Asked Questions
Is this dashboard built in Google Sheets?
Yes. This is a Google Sheets dashboard template designed for spreadsheet-based franchise reporting and analysis.
Can I edit the data?
Yes. The Data Sheet tab is designed so users can add or update records in the same format and use the dashboard pages for analysis.
Does the dashboard include charts?
Yes. The dashboard includes multiple charts across overview, revenue, operations, and locations pages.
Can I filter the dashboard?
Yes. The dashboard includes slicers that allow users to apply filters quickly and review filtered dashboard results.
What does the Search Sheet do?
The Search Sheet allows users to select a Franchise ID and view the related transaction details in one place.
Conclusion
The Franchise Network Analytics Dashboard in Google Sheets is a practical template for turning franchise data into clear business insight. With KPI cards, revenue charts, operations analysis, location reporting, a data sheet, and a franchise transaction lookup page, it gives franchise teams a structured way to monitor performance and make better reporting decisions.
Get the Franchise Network Analytics Dashboard in Google Sheets