The Podcast Audience Insights Dashboard in Google Sheets gives podcasters, agencies, media teams, and content marketers one place to review 6 headline KPI cards, 30 chart views, 5 analysis pages, a structured Data Sheet, and a Search Sheet workflow. Instead of jumping between Spotify, Apple Podcasts, YouTube, email reports, sponsor spreadsheets, and campaign exports, this dashboard organizes downloads, listeners, completion rate, demographics, marketing sources, sponsor performance, and revenue in one shareable Google Sheets file.
For $9.99 one-time, it is designed as a practical alternative to podcast reporting tools that can cost $20-$200 per month. It is especially useful for teams that want a browser-based dashboard they can share with co-hosts, clients, managers, or sponsors without buying extra SaaS seats.
Click here to purchase the Podcast Audience Insights Dashboard in Google Sheets
Key Features of Podcast Audience Insights Dashboard in Google Sheets
- 6 KPI cards on the Overview page: Total Downloads, Total Listeners, Average Listening Time, Completion Rate, Subscriber Growth, and Average Episode Rating.
- 30 analysis charts across podcast audience, episode, marketing, sponsor, and revenue views.
- Multiple slicers to filter the dashboard quickly by platform, category, region, campaign, sponsor, or month.
- Listener Demographics tab to analyze age group, gender, country, device, region, and platform behavior.
- Episode Performance tab to compare downloads, completion, drop-off, ratings, and engagement by episode or category.
- Marketing Channel Insights tab to measure subscriber sources, website visits, referral conversions, email clicks, and audience growth.Podcast Audience Insights Dashboard in Google Sheets
- Revenue and Sponsor Insights tab to review sponsor revenue, CPM, ad impressions, sponsor clicks, and revenue per listener.Podcast Audience Insights Dashboard in Google Sheets
- Data Sheet and Search Sheet so users can update records and locate specific podcast, platform, campaign, sponsor, or listener segment details.Podcast Audience Insights Dashboard in Google Sheets
Dashboard Pages Explanation
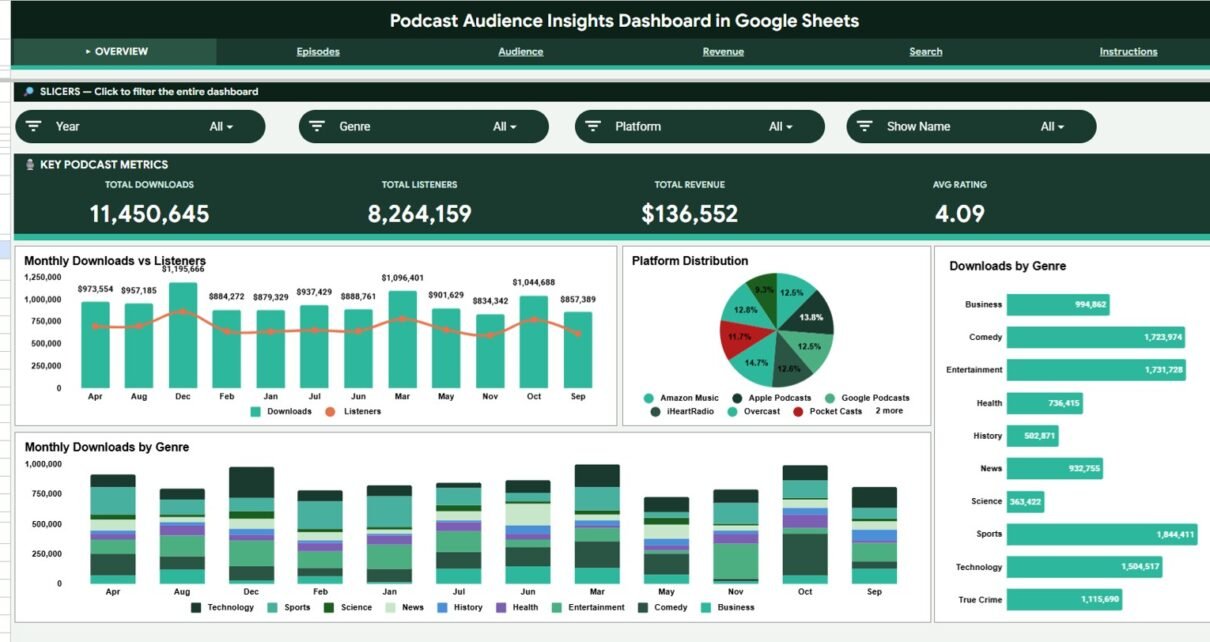
1. Overview Page
The Overview page is the executive summary of the Podcast Audience Insights Dashboard in Google Sheets. At the top, the cards show Total Downloads, Total Listeners, Average Listening Time, Completion Rate, Subscriber Growth, and Average Episode Rating so users can understand overall podcast health in one view.Podcast Audience Insights Dashboard in Google Sheets
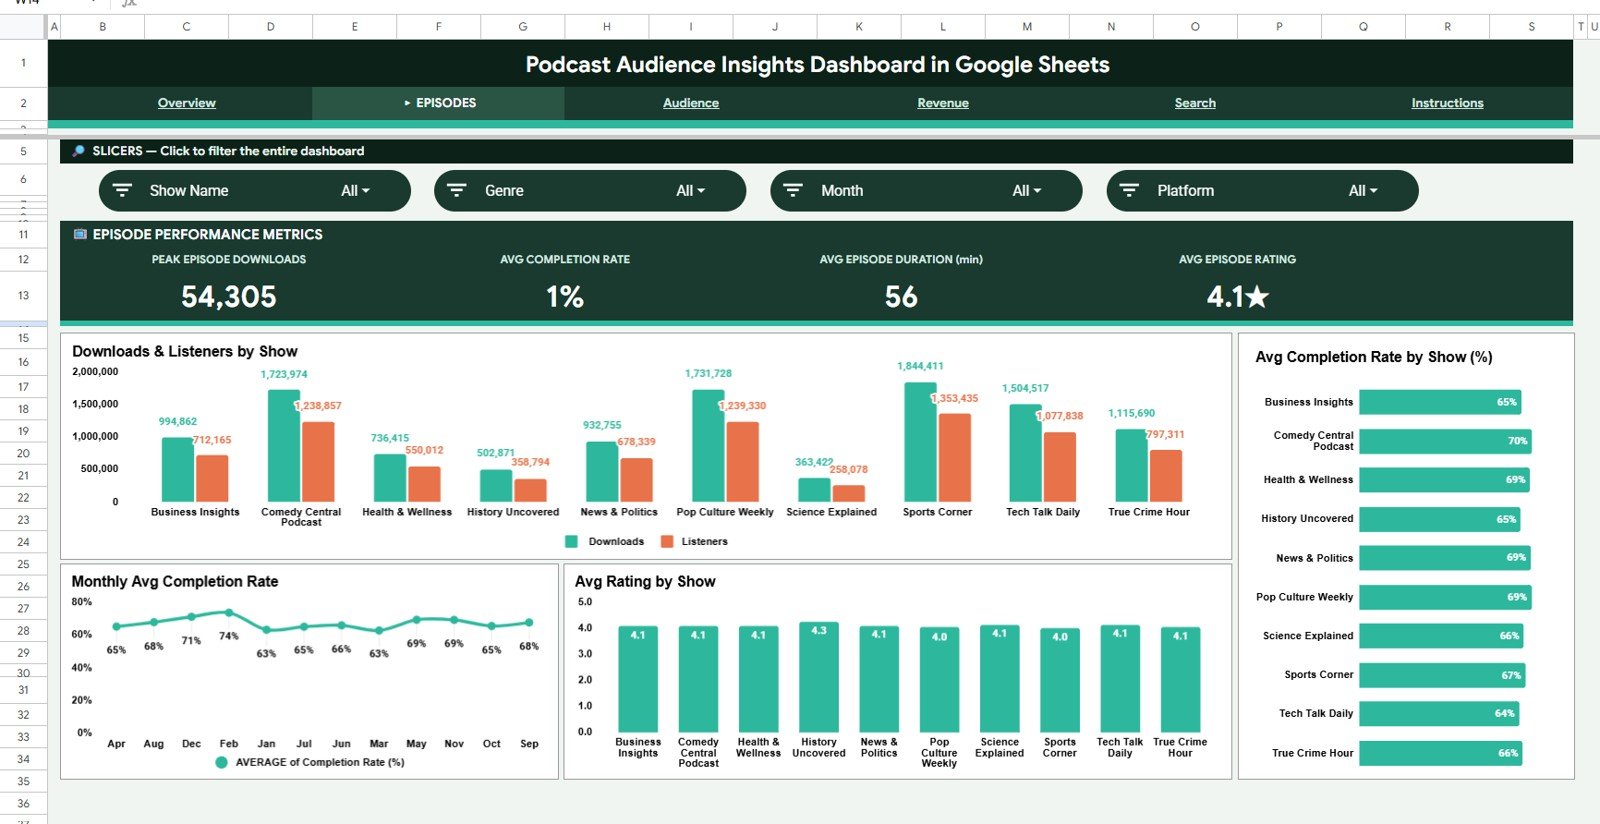
Downloads by Episode Category. This chart compares download volume across content categories such as interviews, tutorials, news, reviews, or storytelling formats.
It helps identify which episode themes attract the strongest initial audience response.
Listeners by Platform. This chart shows how listeners are distributed across Spotify, Apple Podcasts, YouTube, Amazon Music, and other platforms.
It helps podcasters decide where to focus publishing, promotion, and platform-specific optimization work.
Completion Rate by Episode. This chart measures how much of each episode listeners finish.
It helps reveal which topics, hosts, formats, or episode lengths keep audiences engaged until the end.
Audience Share by Age Group. This chart breaks the audience into age segments.
It helps shape episode tone, sponsor messaging, and platform strategy based on the dominant listener age groups.
Subscriber Growth by Month. This chart tracks monthly subscriber growth over time.
It helps teams connect content releases, campaigns, guest appearances, and promotions to subscriber movement.
Engagement by Region. This chart compares engagement across regions or markets.
It helps identify geographic areas where the podcast is gaining stronger attention and sponsor potential.
Podcast Audience Insights Dashboard in Google Sheets
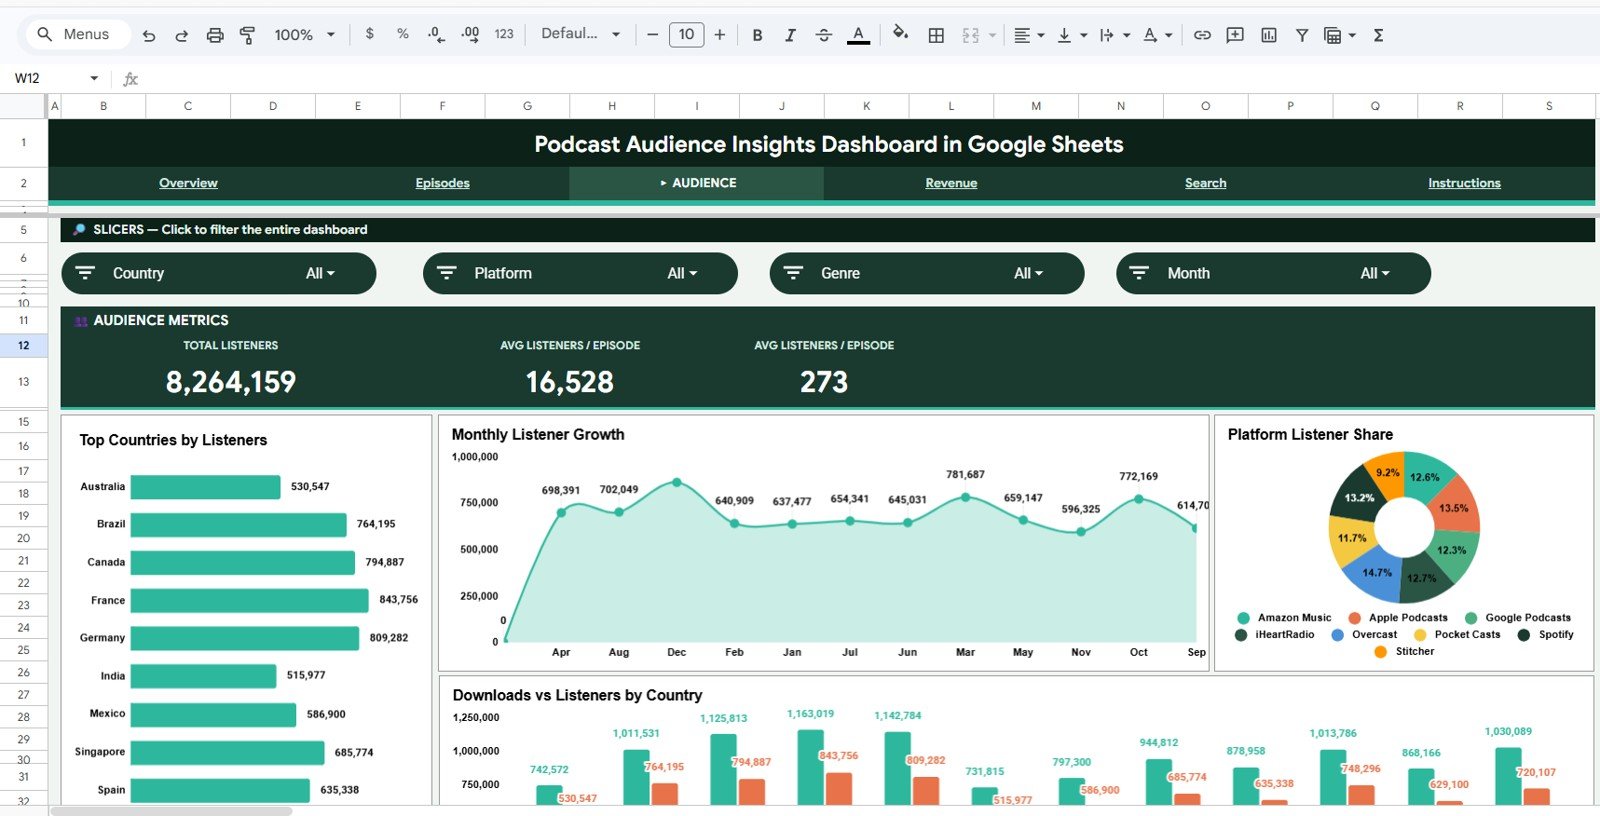
2. Listener Demographics
The Listener Demographics tab explains who the audience is and how different listener groups behave. This is useful for sponsor decks, content planning, localization, and deciding which platforms deserve more focus.
Listeners by Age Group. This chart shows the audience size across different age bands.
It helps podcasters understand whether the show is strongest with younger, mid-career, or older listener segments.
Listeners by Gender. This chart compares audience distribution by gender segments available in the dataset.
It helps improve messaging, sponsor fit, and content planning when demographic balance matters.
Listening Hours by Country. This chart measures total listening time by country.
It helps identify markets where listeners are not only clicking episodes but spending meaningful time with the show.
Listeners by Device. This chart shows whether the audience listens through mobile, desktop, tablet, smart speaker, or other device categories.
It helps optimize episode length, publishing time, and promotional assets for the devices listeners actually use.
Average Listening Time by Region. This chart compares average session depth across regions.
It helps spot markets where listeners stay engaged longer and may respond better to sponsor offers.
Audience Share by Platform. This chart shows platform-level audience share as a percentage of total listeners.
It helps podcasters compare platform reach beyond raw downloads and focus on the highest-value listening channels.
Listener Demographics
3. Episode Performance
The Episode Performance tab focuses on content quality and audience retention. It helps creators see which episodes perform best, where listeners drop off, and which hosts or categories create stronger engagement.
Downloads by Episode. This chart ranks individual episodes by download count.
It helps identify standout episodes that can be reused in promotions, playlists, newsletters, or sponsor pitches.
Completion Rate by Episode. This chart compares listen-through percentage for each episode.
It helps reveal whether high-download episodes also retain attention or simply attract short-lived clicks.
Average Listening Time by Episode. This chart shows how long listeners stay with each episode on average.
It helps find episodes where audience depth is strongest even if download volume is not the highest.
Engagement Rate by Episode Category. This chart compares engagement across episode categories.
It helps teams decide which content pillars deserve more production time and which topics need improvement.
Listener Drop-off by Episode Length. This chart connects episode duration to audience drop-off behavior.
It helps decide whether shorter, standard, or long-form episodes are best for the current audience.
Ratings by Host. This chart compares average listener ratings across hosts.
It helps production teams review host performance, guest pairing, and audience response over time.
Episode Performance
4. Marketing Channel Insights
The Marketing Channel Insights tab connects promotion efforts to audience growth. This is useful for teams running email newsletters, social campaigns, paid promotions, referral links, landing pages, and cross-platform audience building.
New Subscribers by Source. This chart shows which source generates the most new subscribers.
It helps compare organic discovery, social media, referrals, newsletter clicks, guest appearances, and paid campaigns.
Website Visits by Campaign. This chart compares traffic driven by each campaign.
It helps show which marketing campaigns bring people from promotion assets to the podcast website or landing page.
Conversion Rate by Referral Channel. This chart measures how efficiently referral channels turn visits into subscribers or listeners.
It helps identify channels that bring qualified traffic rather than only high-volume traffic.
Social Engagement by Platform. This chart compares likes, comments, shares, or other engagement metrics by social platform.
It helps decide whether LinkedIn, Instagram, X, YouTube, or other channels deserve more promotion effort.
Email Clicks by Campaign. This chart tracks email campaign clicks for podcast promotion.
It helps newsletter teams learn which subject lines, segments, or episode announcements drive action.
Audience Growth by Month. This chart shows monthly growth across the audience base.
It helps connect growth spikes to content releases, guest episodes, sponsor campaigns, or seasonal promotions.
Marketing Channel Insights
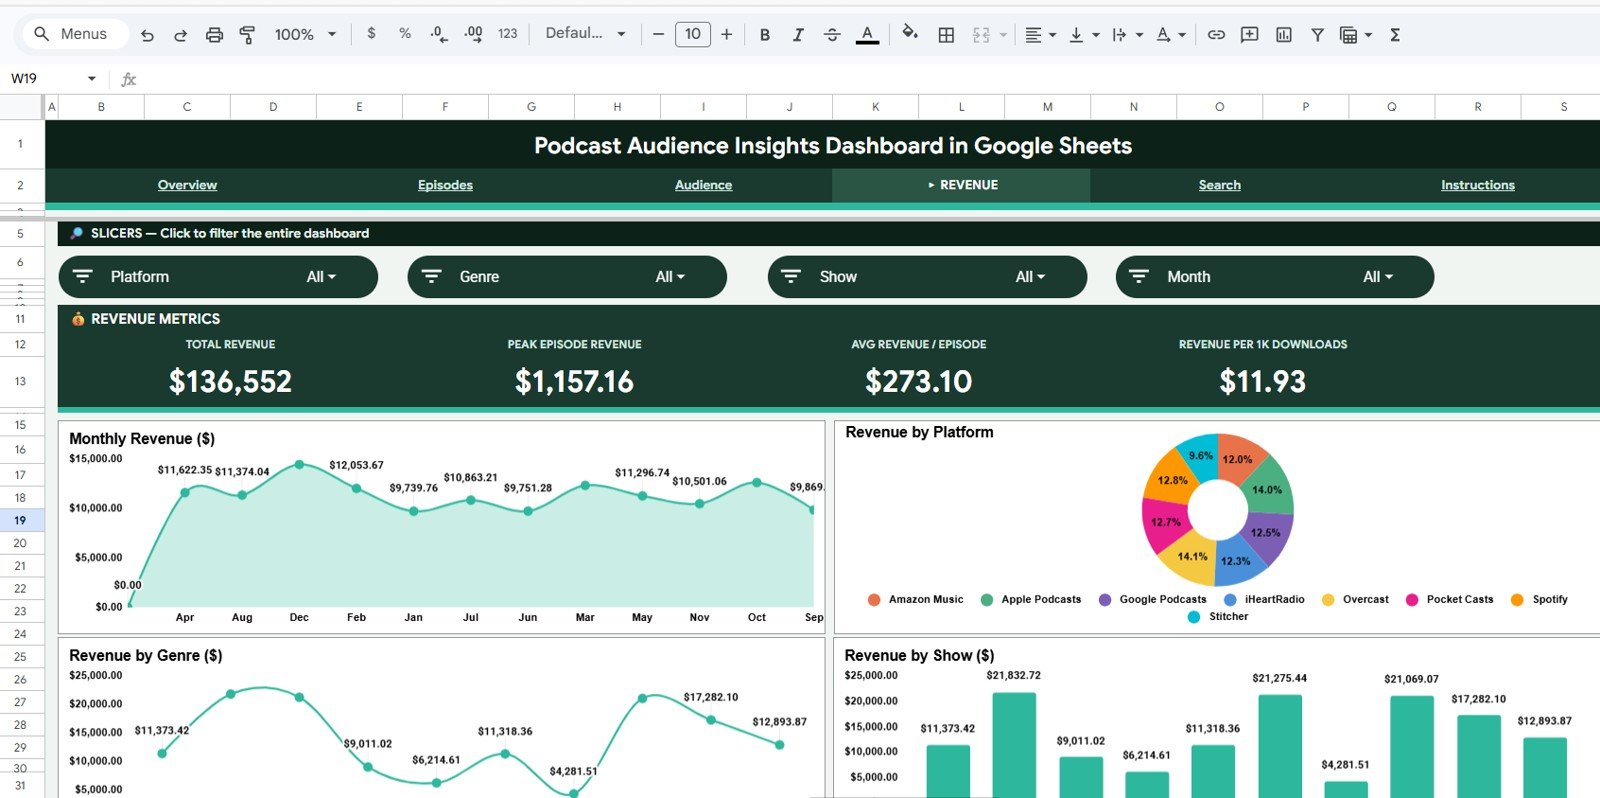
5. Revenue and Sponsor Insights
The Revenue and Sponsor Insights tab helps podcasters understand the commercial side of their audience. It is useful for sponsorship reporting, campaign review, revenue planning, and showing advertisers clear performance signals.Podcast Audience Insights Dashboard in Google Sheets
Revenue by Sponsor. This chart compares total revenue contributed by each sponsor.
It helps identify high-value sponsor relationships and decide where renewal conversations should start.
Revenue by Episode Category. This chart shows which content categories generate the most revenue.
It helps connect editorial choices with commercial performance and sponsor fitPodcast Audience Insights Dashboard in Google Sheets
Ad Impressions by Platform. This chart compares ad exposure across listening platforms.
It helps determine whether sponsor impressions are concentrated in one channel or spread across the audience ecosystem.Podcast Audience Insights Dashboard in Google Sheets
Revenue per Listener by Month. This chart measures monthly revenue efficiency per listener.
It helps show whether monetization is improving even when listener growth is flat or seasonal.Podcast Audience Insights Dashboard in Google Sheets
Sponsor Clicks by Campaign. This chart shows how many sponsor clicks each campaign generated.
It helps advertisers and podcast teams understand which campaign messages and placements produced action.Podcast Audience Insights Dashboard in Google Sheets
CPM by Platform. This chart compares cost per thousand impressions across platforms.
It helps decide where ad inventory is most efficient and where sponsorship pricing may need adjustment.
Revenue and Sponsor Insights
6. Data Sheet Tab
The Data Sheet is the source table for the dashboard. Users should add records in the same format so every KPI card, chart, slicer, and search view can read the information consistentlyPodcast Audience Insights Dashboard in Google Sheets
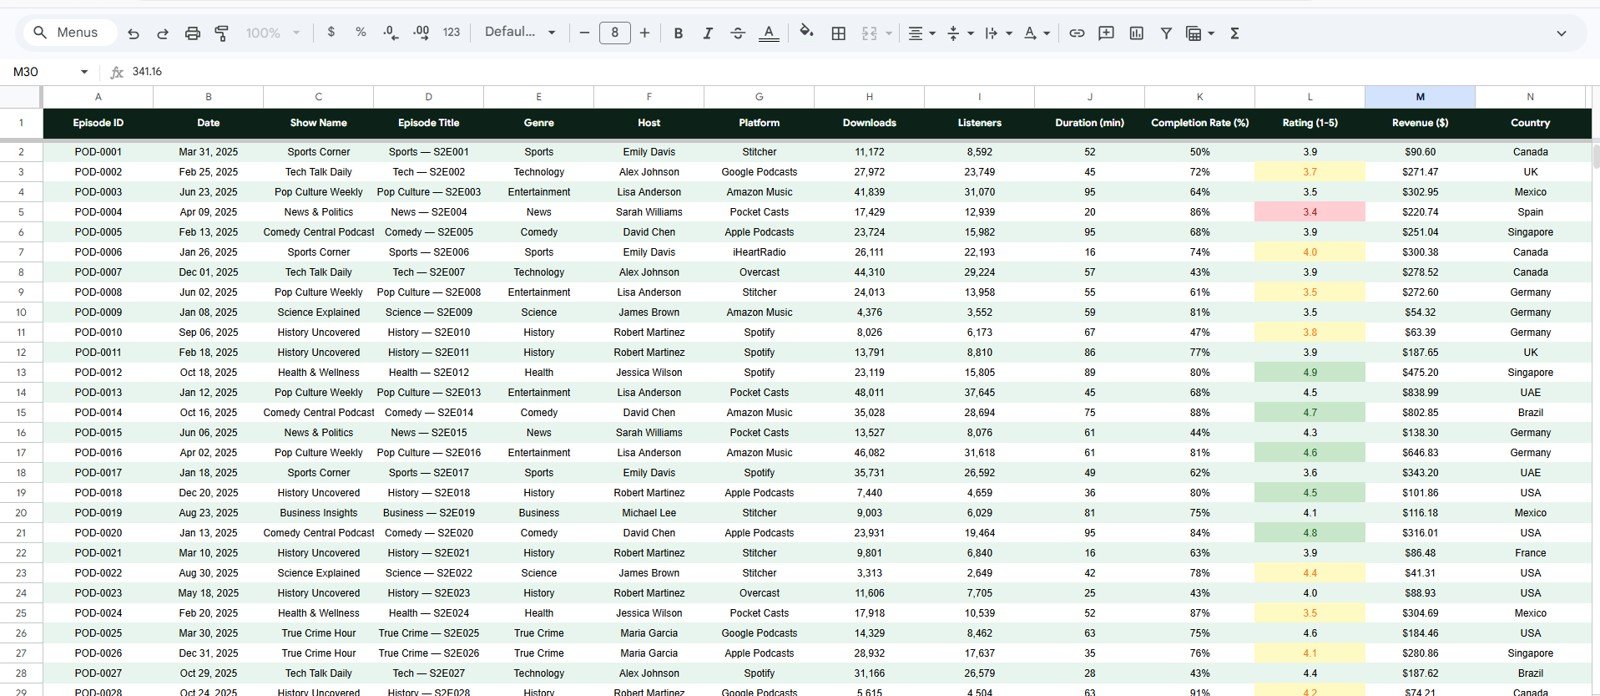
Data Sheet tab
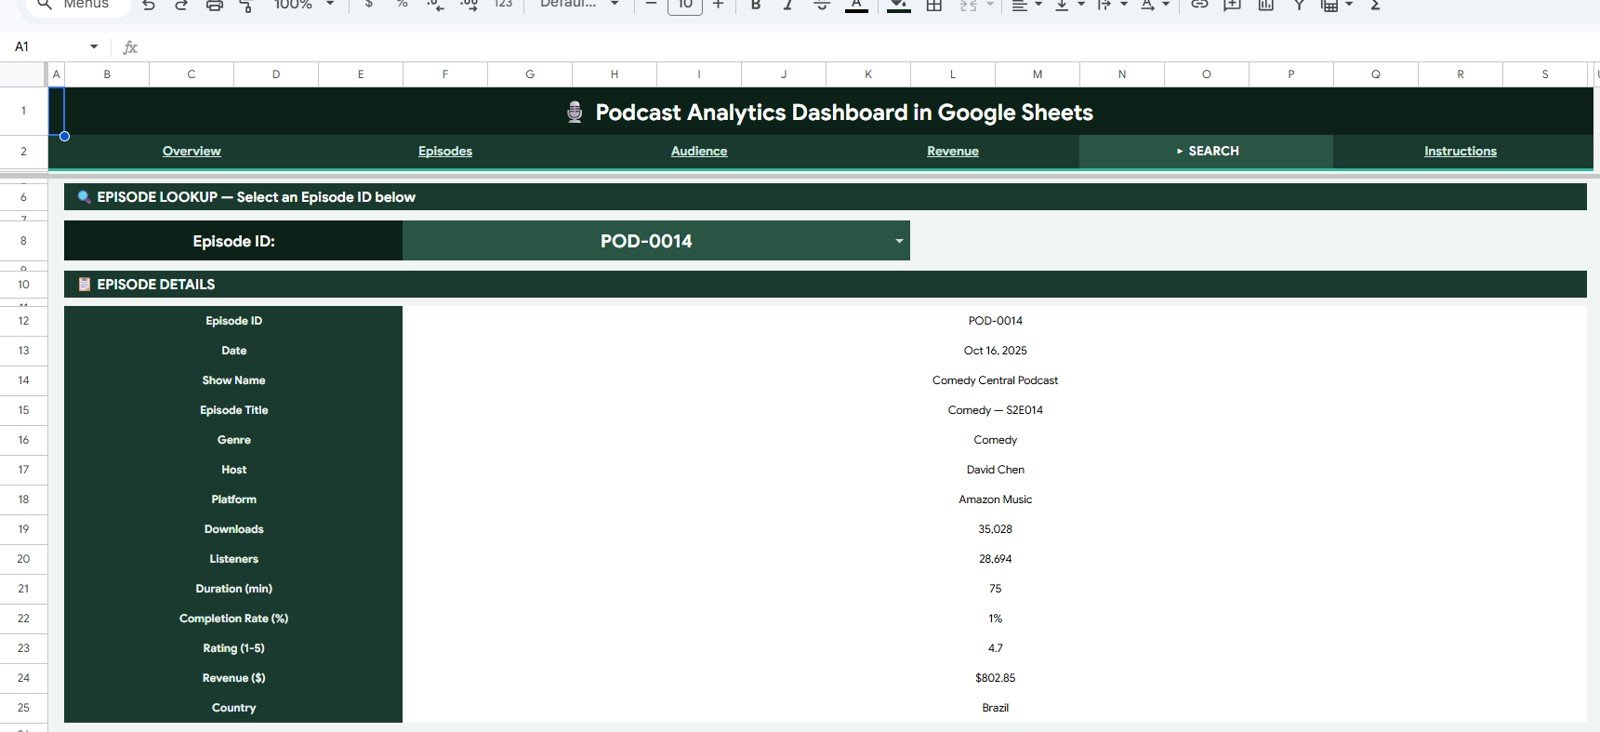
7. Search Sheet Tab
The Search Sheet helps users search specific podcast audience records, episode names, platforms, campaigns, sponsors, regions, or listener segments quickly from the Google Sheets dashboard. This is especially useful during client reviews, sponsor calls, campaign debriefs, and monthly reporting meetings.
Click here to purchase the Podcast Audience Insights Dashboard in Google Sheets
Podcast Audience Insights Dashboard in Google Sheets vs. Microsoft Excel Dashboard vs. Paid Podcast SaaS – Feature Comparison
| Feature | Podcast Audience Insights Dashboard | Microsoft Excel Dashboard | Paid Podcast SaaS |
|---|---|---|---|
| Cost | $9.99 one-time | $9.99-$17.99 one-time | $20-$200/month |
| Platform | Google Sheets in browser | Excel desktop or web | Vendor cloud platform |
| Setup time | Under 10 minutes | Under 10 minutes | Hours or days |
| Real-time collaboration | Native Google Drive sharing | Requires OneDrive or SharePoint | Usually seat-based |
| Mobile access | Google Sheets mobile app | Excel mobile with limitations | Usually available |
| Customizable fields | Fully editable sheet fields | Fully editable workbook | Limited to vendor settings |
| Share with link | Yes | Possible through cloud storage | Often requires user accounts |
| Year-1 cost at 5 users | $9.99 total | $9.99-$17.99 total | $1,200-$12,000 |
| Audience demographics | Included when data is provided | Can be built manually | Often limited by platform |
| Sponsor reporting | Included | Possible with custom work | Often requires higher plan |
Who Should Use This Template
- Independent podcasters who want to review downloads, listeners, completion, ratings, and subscriber growth in one Google Sheet.Podcast Audience Insights Dashboard in Google Sheets
- Podcast agencies managing multiple client shows and needing shareable audience reports.
- Content marketing teams using podcasts for education, community building, demand generation, or brand authority.Podcast Audience Insights Dashboard in Google Sheets
- Creators who pitch sponsors and need simple views for revenue, impressions, sponsor clicks, CPM, and audience demographicsPodcast Audience Insights Dashboard in Google Sheets
- Teams already using Google Sheets Dashboard templates for reporting.
Real-World Use Cases
Maya runs an interview podcast with weekly guest episodes. She uses Downloads by Episode Category, Completion Rate by Episode, and Ratings by Host to decide which topics and guest formats deserve more recording slots next month.
Rahul leads content marketing for a B2B SaaS company. He uses New Subscribers by Source, Website Visits by Campaign, and Conversion Rate by Referral Channel to decide whether email, LinkedIn, partner referrals, or paid campaigns are producing better listeners.
Elena manages sponsor reporting for a podcast agency. She uses Revenue by Sponsor, Sponsor Clicks by Campaign, Ad Impressions by Platform, and CPM by Platform to prepare sponsor renewal reports without building a new spreadsheet every month.
Advantages of Podcast Audience Insights Dashboard in Google Sheets
- One reporting file for audience, episode, marketing, revenue, sponsor, data, and search workflows.
- Cloud collaboration through Google Drive, making it easy to share a view-only dashboard with clients or sponsorsPodcast Audience Insights Dashboard in Google Sheets
- Affordable ownership with a $9.99 one-time price instead of recurring monthly analytics tools.
- Editable structure so teams can adjust fields, duplicate sheets, or extend charts as the podcast grows.Podcast Audience Insights Dashboard in Google Sheets
- Better sponsor conversations because revenue, impressions, clicks, CPM, demographics, and audience growth can be reviewed together.Podcast Audience Insights Dashboard in Google Sheets
Opportunities for Improvement
- The dashboard does not automatically pull live API data from Spotify, Apple Podcasts, or YouTube.
- Users need to keep the Data Sheet clean and consistent for slicers and charts to work correctly.
- Demographic analysis depends on the demographic fields available in the user’s source data.
- Advanced teams may eventually want a Power BI version for deeper data modeling and automated refresh.
Best Practices
- Update the Data Sheet on a weekly or monthly schedule so trends stay meaningful.
- Use consistent platform, campaign, sponsor, category, and region naming to avoid duplicate slicer values.
- Share the dashboard as view-only when sending it to sponsors or clients. Google’s sharing guide explains permission options: Share files from Google Drive.
- Use the Search Sheet during live calls so you can find a specific episode, sponsor, or campaign quickly.
- Duplicate the file before major format changes so you always have a clean backup.
Explore Relevant Templates
Podcast Analytics Dashboard in Google Sheets – broader podcast performance tracking for downloads, listeners, revenue, and ratings.
Podcast Performance KPI Dashboard in Google Sheets – target-based podcast KPI scorecard tracking.
Content Creator Revenue Dashboard in Google Sheets – revenue dashboard for podcasts, videos, blogs, sponsorships, and creator content.
Podcast Analytics Dashboard in Power BI – Power BI option for teams that want DAX-driven reporting.
Browse the full Google Sheets templates and Google Sheets Dashboard templates collections on NextGenTemplates.
Frequently Asked Questions
What does the Podcast Audience Insights Dashboard in Google Sheets track?
It tracks Total Downloads, Total Listeners, Average Listening Time, Completion Rate, Subscriber Growth, Average Episode Rating, listener demographics, episode performance, marketing channels, sponsor results, revenue, and search records.
Can I use this dashboard for multiple podcast shows?
Yes. If your Data Sheet includes fields for show, episode, platform, category, campaign, sponsor, region, and month, the dashboard can support multiple shows or clients in one structured file.
Does the dashboard connect directly to podcast platforms?
No. It is built for manual entry or pasted exports. This keeps the dashboard affordable, editable, and usable across any platform that provides exportable podcast data.
Can I share the dashboard with sponsors?
Yes. Because the template runs in Google Sheets, you can share it as a view-only Google Drive link with sponsors, agencies, managers, or co-hosts.
Is this better than a paid podcast analytics SaaS tool?
It is better for teams that want low-cost, editable, shareable reporting. Paid SaaS may be better if you need live API connections, certified measurement, automated attribution, or enterprise controls.
What if I do not have demographic data?
You can still use the episode, platform, marketing, sponsor, revenue, and search sections. Demographic charts become more useful when your source data includes age, gender, country, region, or device fields.
About the Author
Built by PK – Microsoft Certified Professional with 15+ years of Excel, Google Sheets, and Power BI experience. Founder of NextGenTemplates, reaching 300K+ subscribers across YouTube channels. Every template is hand-built and tested before release.
Conclusion
The Podcast Audience Insights Dashboard in Google Sheets is built for creators and teams who want clear audience reporting without paying for another monthly analytics platform. It brings together listener demographics, episode performance, marketing channels, sponsor activity, revenue, data entry, and search into one editable Google Sheets workflow.
Click here to purchase the Podcast Audience Insights Dashboard in Google Sheets
Visit our YouTube channel for step-by-step tutorials: YouTube.com/@NeoTechNavigators