Coworking Space Dashboard in Google Sheets is a ready-to-use reporting template for coworking founders, shared office managers, community teams, and operators who need to track revenue, bookings, members, locations, and space usage without paying for another monthly analytics tool. The template includes 6 sheet tabs, 4 high-level KPI cards, and 17 analysis charts. For a one-time $9.99 purchase, it gives teams a practical way to replace manual monthly reporting and review booking performance in under 10 minutes after data entry.
The dashboard is built for Google Sheets, so teams can collaborate in the browser, share access through Google Drive, and review live updates from any device. You can view the Coworking Space Dashboard in Google Sheets product page on NextGenTemplates.
Key Features of Coworking Space Dashboard in Google Sheets
Click here to purchase the Coworking Space Dashboard in Google Sheets.
- 6 connected tabs: Overview, Members, Bookings, Revenue, Search, and Data.
- 4 KPI cards: Total Revenue, Total Bookings, Unique Members, and Avg Booking Value.
- 17 charts: Revenue, bookings, member plans, space types, locations, industries, payment methods, and booking status.
- Interactive slicers: Filter the dashboard quickly by key business dimensions.
- Search sheet: Review one booking record at a time without scrolling through the full data table.
- Editable data structure: Replace the sample records with your own coworking booking data.
- Google Sheets collaboration: Share the file with owners, managers, analysts, or team members using standard Drive permissions.
- No code or add-ons required: The template is designed for normal spreadsheet users.
Dashboard Pages Explanation
Click here to purchase the Coworking Space Dashboard in Google Sheets.
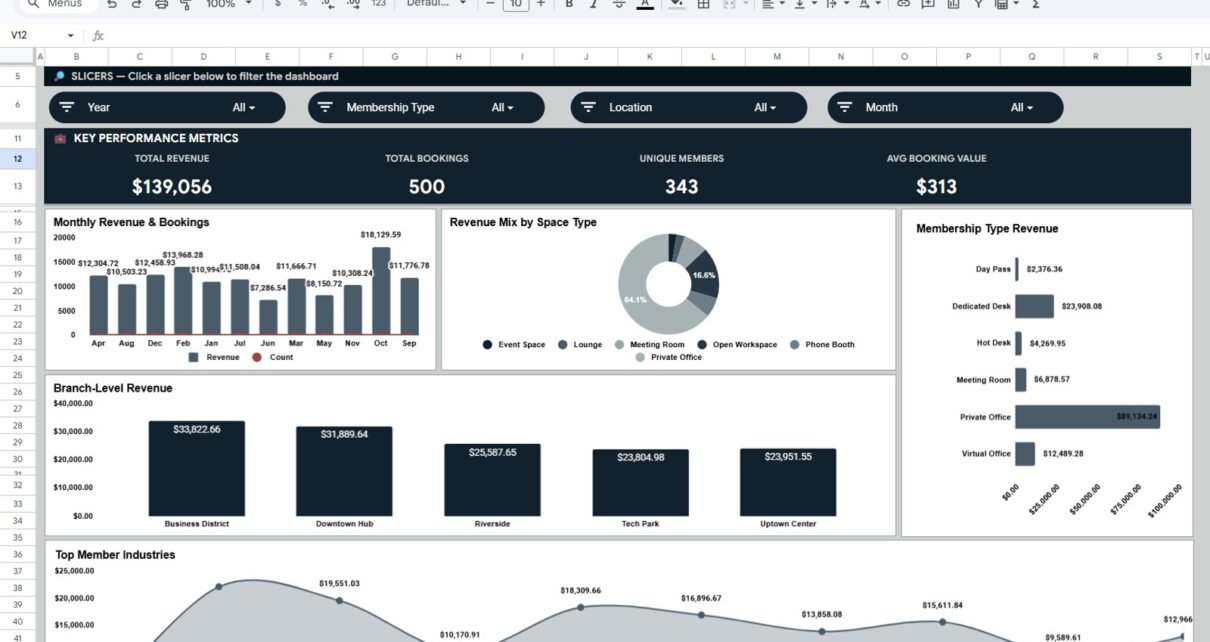
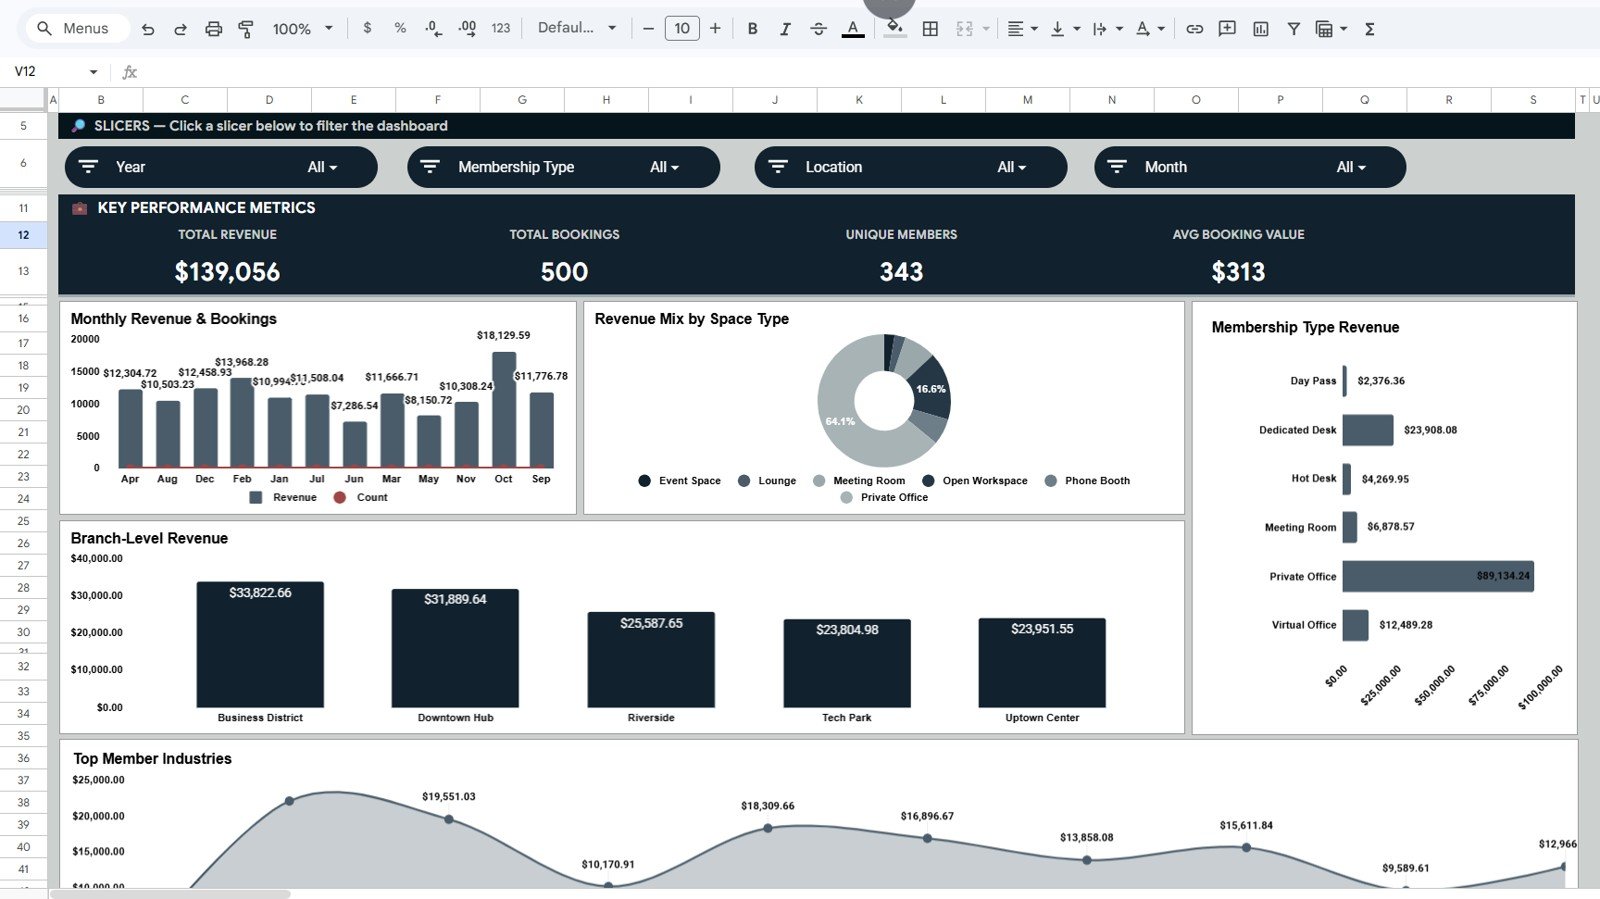
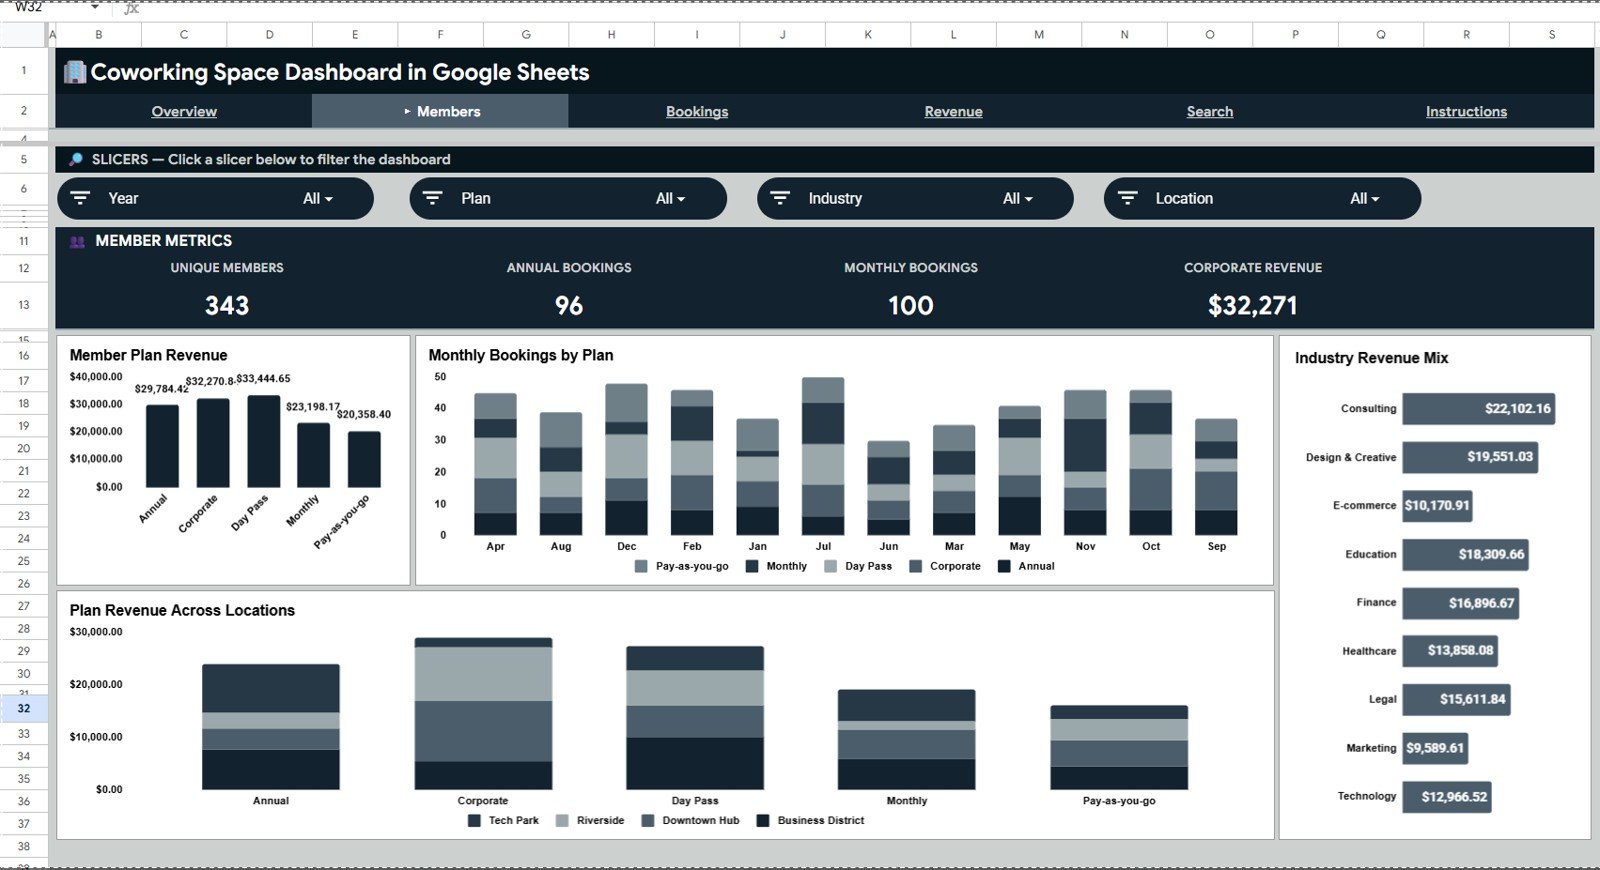
1. Overview Page
The Overview page gives management a quick view of overall coworking business health. The top cards show Total Revenue, Total Bookings, Unique Members, and Avg Booking Value, while slicers let users filter the report quickly.
Revenue and Bookings by Month: This chart compares monthly revenue with total booking volume. It helps you see whether booking activity and revenue are moving together or whether discounts, low-value bookings, or seasonality are affecting results.
Revenue by Space Type: This chart shows how much revenue comes from different space types such as meeting rooms, hot desks, private offices, or event areas. It helps operators understand which spaces are driving income and which may need pricing or usage changes.
Revenue by Membership Type: This chart compares revenue from different membership types. It helps you review whether day passes, flex memberships, dedicated desks, or enterprise memberships are most valuable.
Revenue by Location: This chart shows revenue split across coworking locations. Multi-location operators can use it to compare branches and spot underperforming sites quickly.
Revenue by Industry: This chart breaks revenue down by member industry. It can reveal whether technology firms, consultants, creators, agencies, or other segments are generating the strongest returns.
2. Members Sheet Tab
The Members page focuses on member behavior, plan performance, and segment-level revenue. It is especially useful for coworking teams that want to understand which plans and member groups deserve more marketing attention.
Revenue by Member Plan: This chart ranks member plans by revenue. It helps you decide whether a plan should be promoted, repriced, bundled, or retired.
Monthly Bookings by Plan: This chart shows how booking activity changes month by month for each plan. It helps compare casual usage against recurring membership behavior.
Revenue by Industry: This chart connects member industry with revenue contribution. Use it to identify strong customer niches and plan targeted outreach or community events.
Plan Revenue by Location: This chart compares member plan revenue across locations. It helps explain why one branch may rely on day passes while another performs better with dedicated or corporate plans.
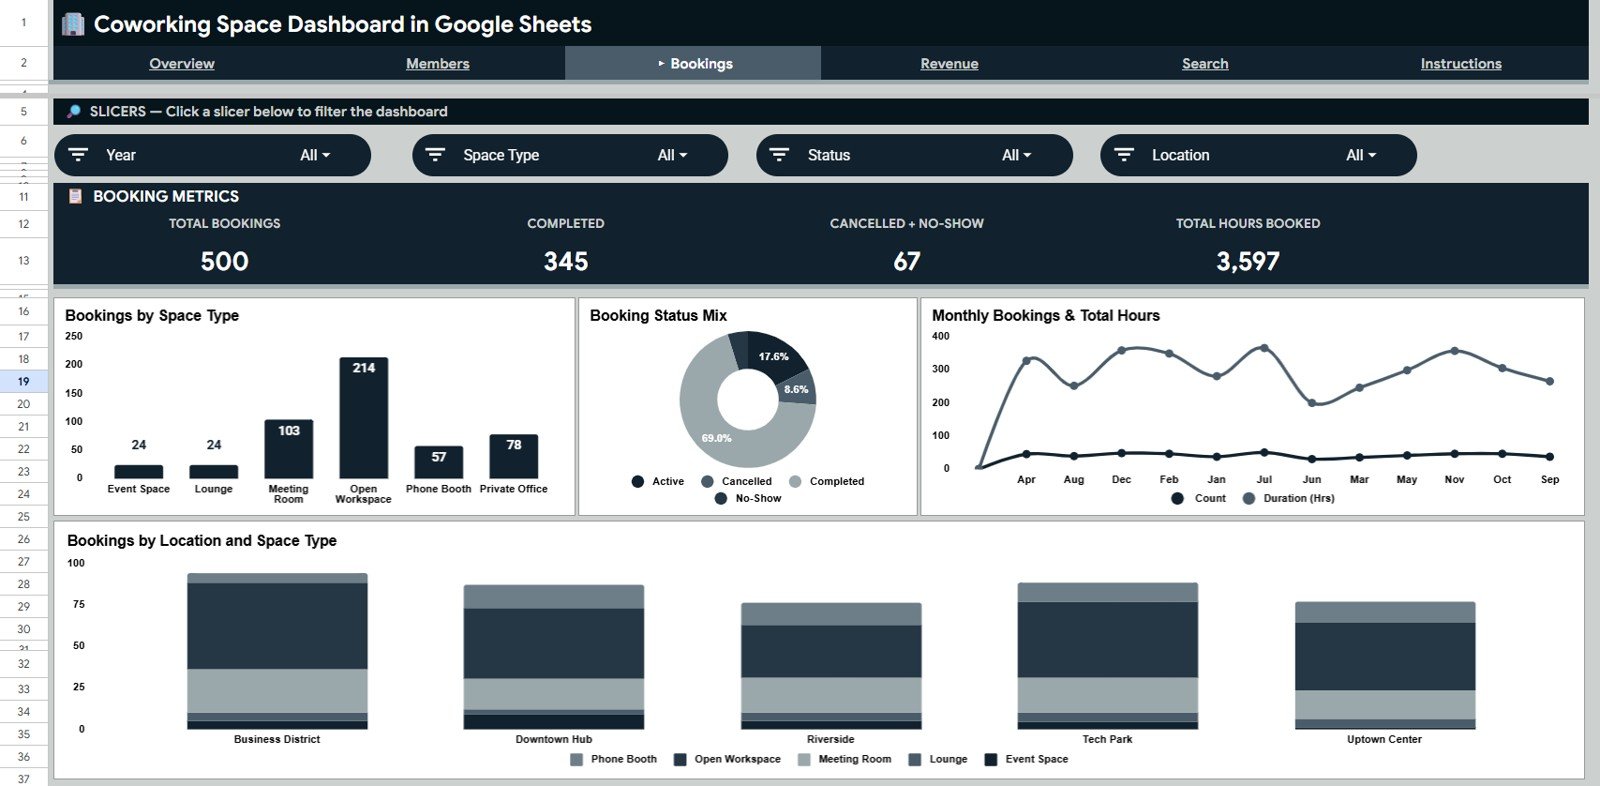
3. Bookings Sheet Tab
The Bookings page is designed for operations and capacity review. It helps managers understand how coworking spaces are being reserved and how demand changes by time, status, location, and space type.
Bookings by Space Type: This chart shows which types of spaces receive the most reservations. It helps teams rebalance room supply, seating layouts, and availability rules.
Bookings by Status: This chart separates completed, confirmed, pending, cancelled, or other booking statuses. It gives a quick view of booking reliability and process leakage.
Bookings and Total Hours by Month: This chart compares booking count with total booked hours. It helps reveal whether demand is driven by many short reservations or fewer long-duration bookings.
Bookings by Location and Space Type: This chart combines location and space type into one operational view. It helps managers identify which branches need more meeting rooms, private offices, or desk capacity.
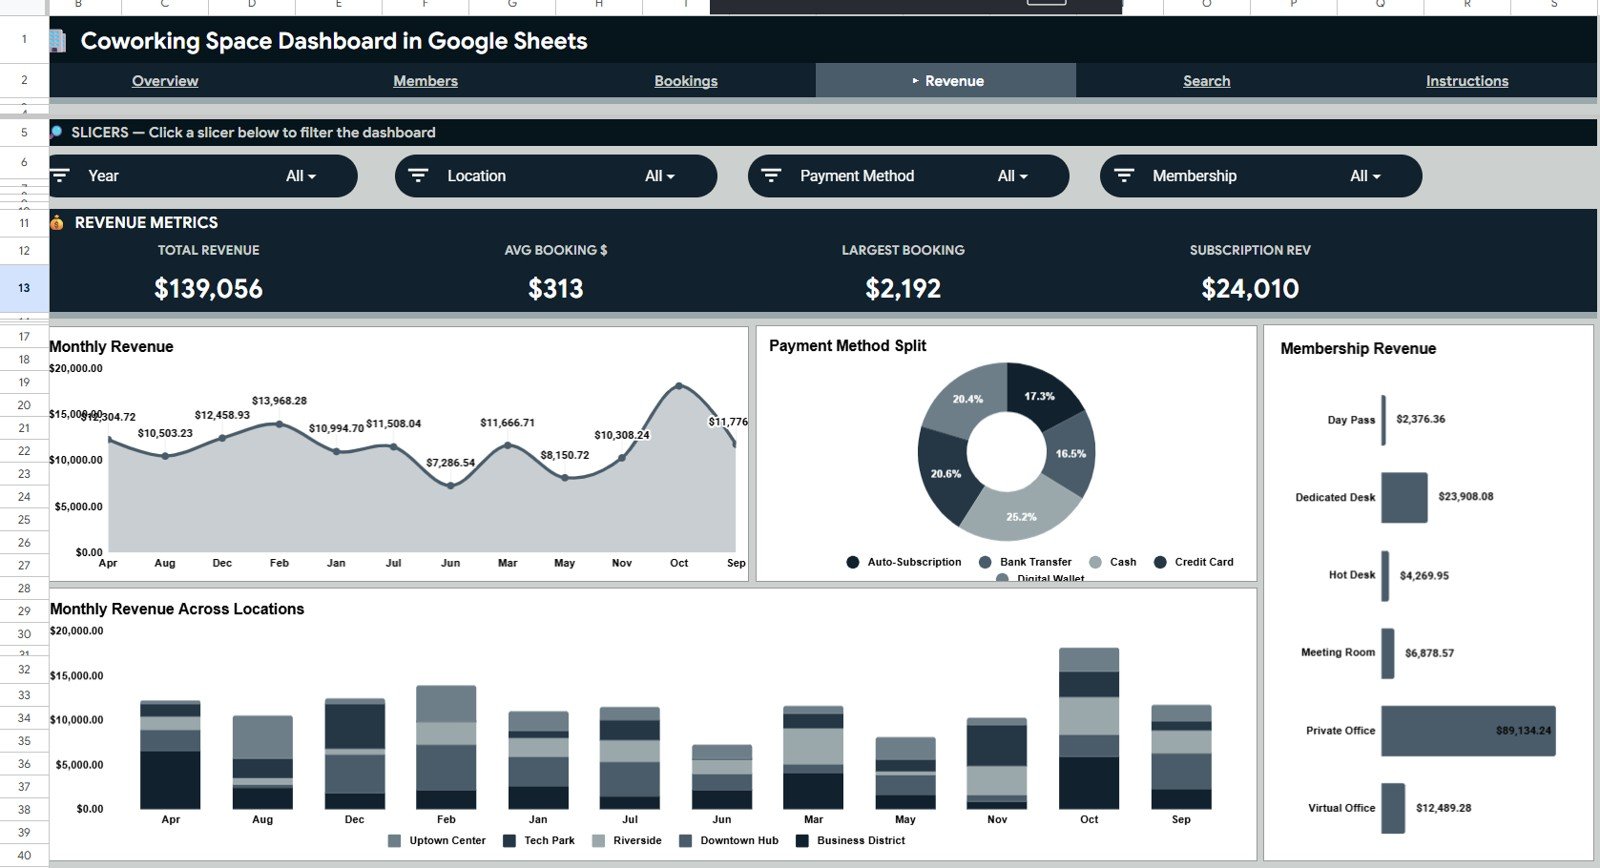
4. Revenue Sheet Tab
The Revenue page focuses on financial performance. It gives owners and finance teams a cleaner way to review revenue movement by month, location, payment method, and membership type.
Revenue by Month: This chart tracks revenue over time. It helps compare current performance against previous months and spot seasonality.
Revenue by Payment Method: This chart shows which payment methods contribute to total revenue. Finance teams can use it for reconciliation, payment behavior review, and collection channel analysis.
Revenue by Membership Type: This chart compares revenue across membership categories. It helps with pricing decisions for flexible, dedicated, corporate, virtual, or day-pass plans.
Revenue by Location and Month: This chart shows branch-level revenue by period. It helps identify whether a revenue change is company-wide or limited to one location.
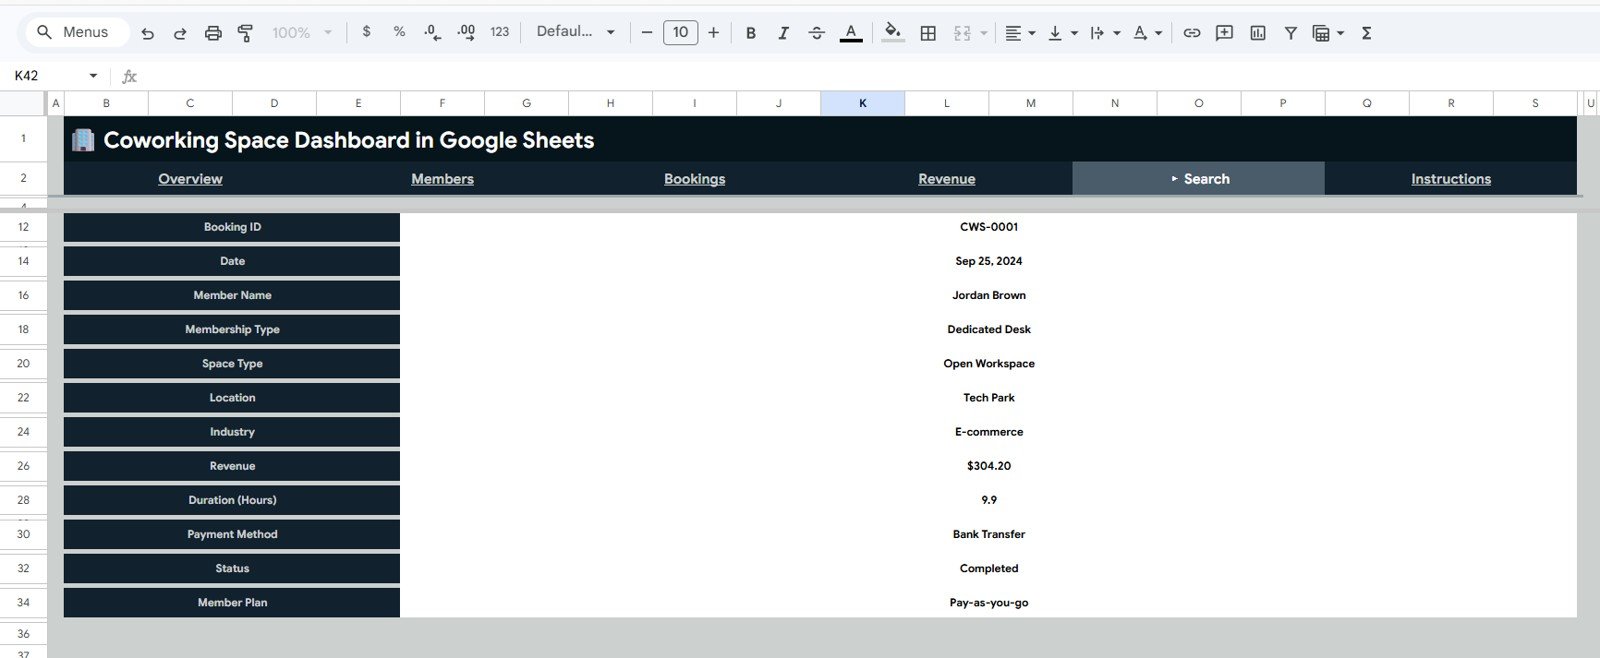
5. Search Sheet Tab
The Search sheet helps users search and review one coworking space booking record at a time. It shows the booking ID, date, member name, membership type, space type, location, industry, revenue, duration, payment method, status, and member plan in a clean lookup view.
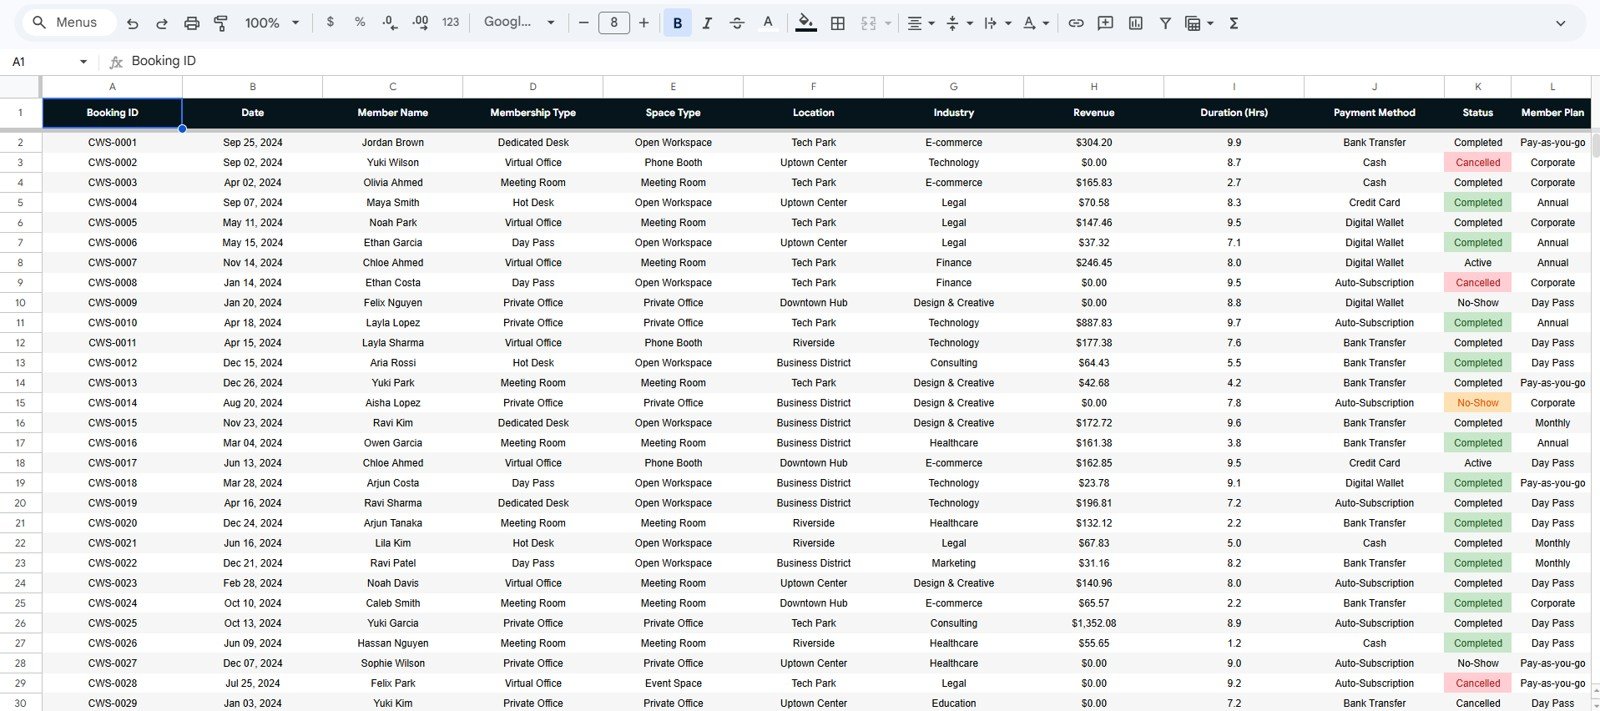
6. Data Sheet Tab
The Data sheet is where the booking records are stored. Add your data in the same format so the charts, slicers, KPI cards, and lookup sheet continue to update correctly.
Coworking Space Dashboard in Google Sheets vs. Excel vs. Paid Coworking Software – Feature Comparison
| Feature | This Google Sheets Dashboard | Excel Dashboard | Paid Coworking SaaS |
|---|---|---|---|
| Cost | $9.99 one-time | One-time template or manual build | Usually monthly subscription |
| Platform | Google Sheets | Microsoft Excel | Vendor cloud platform |
| Setup time | Under 10 minutes after copying the file | Fast if the workbook is already built | Often requires setup or onboarding |
| Real-time team collaboration | Yes | Limited unless using Microsoft 365 | Usually yes |
| Mobile access | Yes, through Google Sheets app | Limited for editing | Usually yes |
| Customizable fields | Fully editable | Fully editable | Often restricted by plan |
| Share with link | Yes, through Google Drive | File sharing or OneDrive | Usually account-based |
| Year-1 cost at 5 users | $9.99 total | Template cost plus setup time | Can run into hundreds or thousands |
| Booking lookup | Built-in Search sheet | Requires setup | Usually included |
| Data ownership | Your Google Drive | Your file storage | Vendor-hosted data |
If your team already works in Google Workspace, you can control sharing through Google Sheets permissions. Google explains those options in its official guide to sharing files from Google Drive.
Who Should Use This Template
Click here to purchase the Coworking Space Dashboard in Google Sheets.
- Coworking founders who need a simple monthly business review dashboard.
- Community managers who want to understand member plan and industry performance.
- Operations teams managing meeting rooms, private offices, hot desks, and event spaces.
- Multi-location coworking brands comparing revenue and usage by branch.
- Shared office teams that export booking data from another system and need a clean reporting layer.
- Consultants building reporting packs for small coworking or flexible workspace clients.
Real-World Use Cases
Click here to purchase the Coworking Space Dashboard in Google Sheets.
Maya runs two coworking locations and reviews the Overview page each Monday. She compares Revenue by Location and Revenue by Space Type before adjusting room availability and promotional offers for the next week.
Arjun manages community growth for a shared workspace. He uses Revenue by Industry and Revenue by Member Plan to understand which member groups should receive targeted events, referral campaigns, and plan upgrades.
Sofia handles operations reporting for a flexible office brand. She uses Bookings and Total Hours by Month to identify whether demand is shifting toward short meetings or long room reservations.
Advantages of Coworking Space Dashboard in Google Sheets
- Low cost: One-time $9.99 instead of a recurring analytics subscription.
- Fast setup: Copy the sheet, paste data, and review the dashboard.
- Collaborative: Multiple team members can view or edit through Google Sheets.
- Editable: Add fields, adjust charts, and customize the dashboard for your business.
- Operationally useful: Review bookings, duration, status, and space demand from one file.
- Financially useful: Track revenue by month, member type, location, industry, and payment method.
Opportunities for Improvement
Click here to purchase the Coworking Space Dashboard in Google Sheets.
This dashboard is intentionally simple and spreadsheet-based. For teams that want to extend it, the next improvements could include automated imports from a booking platform, Google Forms intake for manual bookings, protected ranges for formula areas, a calendar-style booking view, or a Looker Studio report connected to the Data sheet.
For larger coworking businesses, the biggest opportunity is automation. If your team has hundreds of bookings per week, consider exporting data from your coworking system on a fixed schedule and pasting it into the Data sheet with consistent column names.
Best Practices
Click here to purchase the Coworking Space Dashboard in Google Sheets.
- Keep the Data sheet structure stable. Do not rename fields unless you also update dependent formulas or charts.
- Use consistent labels. Standardize member plans, locations, space types, industries, payment methods, and statuses.
- Update weekly. Weekly data entry keeps trends useful and prevents month-end cleanup from becoming painful.
- Protect formula areas. Use protected ranges so accidental edits do not break dashboard logic.
- Review revenue and hours together. High booking count does not always mean strong revenue, so compare volume with value.
- Make monthly snapshots. Save a copy at month-end for historical reporting and audit trails.
Explore Relevant Templates
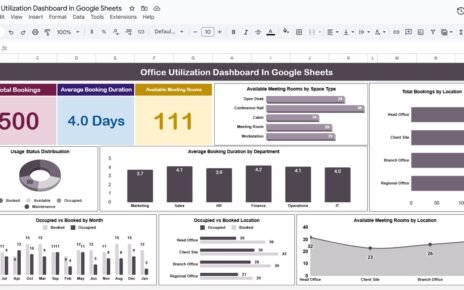
- Space Utilization Dashboard in Google Sheets – useful for broader space and facility usage analysis.
- Property Management Dashboard in Google Sheets – helpful for rent, occupancy, property, and maintenance reporting.
- Event Management Analysis Dashboard in Google Sheets – useful for venue and event booking analysis.
- Real Estate Investment Trusts KPI Dashboard in Excel – a real estate finance KPI companion.
You may also like the NeoTechNavigators walkthrough for the Space Utilization Dashboard in Google Sheets.
Frequently Asked Questions
What does the Coworking Space Dashboard in Google Sheets track?
It tracks revenue, bookings, unique members, average booking value, member plans, space types, locations, industries, payment methods, booking duration, booking status, and detailed booking records.
Is this dashboard beginner-friendly?
Yes. The dashboard is designed for normal Google Sheets users. You update the Data sheet and use the existing dashboard tabs for analysis.
Can I use this for multiple coworking locations?
Yes. The dashboard includes location-based revenue and booking analysis, making it useful for multi-branch coworking teams.
Can I customize member plans and space types?
Yes. Add your own member plans, membership types, locations, industries, and space types in the Data sheet while keeping the column format consistent.
Does this replace coworking management software?
No. It is a reporting dashboard. Use it alongside booking software, payment tools, or manual booking logs when you need a clean analytics layer.
Can my team collaborate on the dashboard?
Yes. Because it runs in Google Sheets, you can share the file using view, comment, or edit permissions through Google Drive.
About the Author
Built by PK – Microsoft Certified Professional with 15+ years of Excel, Google Sheets, and Power BI experience. Founder of NextGenTemplates, reaching 300K+ subscribers across YouTube channels. Every template is hand-built and tested before release.
Conclusion
The Coworking Space Dashboard in Google Sheets gives flexible workspace teams a simple way to monitor bookings, revenue, member plans, space types, locations, and detailed booking records in one collaborative file. It is not a full coworking management system, but it is a useful reporting layer for teams that want faster decisions without adding another subscription.
Click here to purchase the Coworking Space Dashboard in Google Sheets.
Visit our YouTube channel for step-by-step tutorials: YouTube.com/@NeoTechNavigators
Last updated: May 19, 2026