The Credit Union Dashboard in Google Sheets turns a credit union data table into a 6-tab reporting workbook with 4 executive KPI cards, 16 dashboard charts, multiple slicers, a member record lookup, and a structured Data Sheet. It is built around the day-to-day numbers credit union teams review most often: deposits, loans disbursed, transactions, branch activity, product mix, member segments, channels, loan balance, interest rate, officer, and credit score.
Credit union reporting often starts in exports from core banking, lending, card, branch, and digital-channel systems. Without a clean dashboard, every monthly review can become a round of manual pivots, copied charts, and inconsistent member-level lookups. This Google Sheets template gives branch leaders, lending heads, operations teams, finance analysts, and member services teams a reusable view they can share securely and update with approved data. More than 8,400 teams in 40+ countries use NextGenTemplates for spreadsheet and BI templates.
Click here to purchase Credit Union Dashboard in Google Sheets
Key Features of Credit Union Dashboard in Google Sheets
- Executive overview cards: Track Total Deposits, Loans Disbursed, Transactions, and Avg Credit Score from one high-level page.
- Built-in slicers: Filter the dashboard quickly by branch, product, member segment, channel, transaction type, officer, and date-based views where applicable.
- Branch performance analysis: Compare amount, members, monthly volume, and product mix across credit union locations.
- Loan and product reporting: Review loans disbursed, loan balance share, average interest rate, and monthly transaction activity.
- Member and channel insights: Understand how segments and service channels contribute to activity, amount, and credit score patterns.
- Search Sheet lookup: Select a Member ID and view a complete matching member record without rebuilding filters.
- Structured Data Sheet: Add new credit union records in the same format so the dashboard stays consistent as the sample data is replaced.
Dashboard Pages Explanation
1. Overview Page
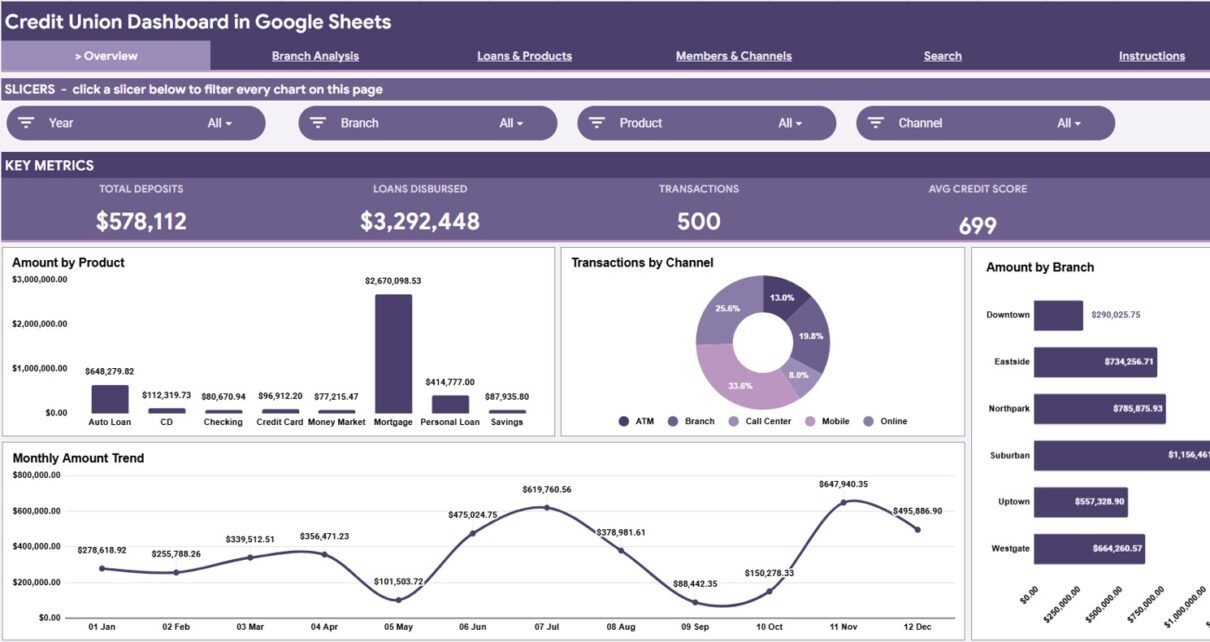
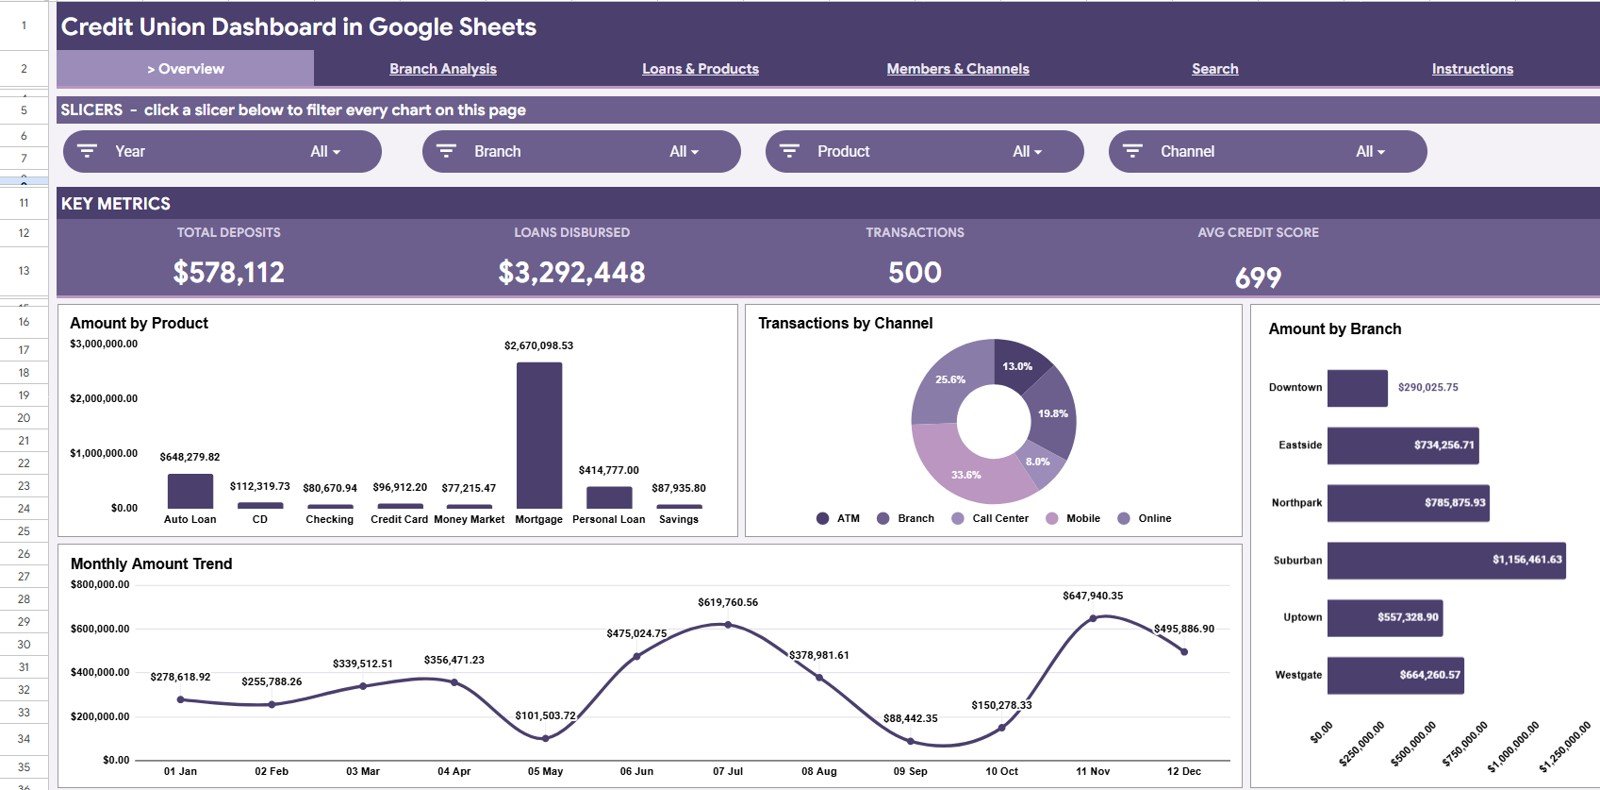
The Overview Page is designed for quick leadership review. At the top, it shows 4 KPI cards: Total Deposits, Loans Disbursed, Transactions, and Avg Credit Score. These cards help a credit union team understand volume, lending activity, member transaction activity, and credit quality before looking deeper into the charts.
Amount by Product: This chart shows which financial products contribute the highest amount. It is useful for comparing deposits, loans, cards, and other product groups in one visual.
Transactions by Channel: This chart shows how activity is distributed across branch, mobile, online, ATM, and other service channels. It helps teams identify where member engagement is strongest.
Amount by Branch: This chart compares total amount across branches. It quickly highlights high-performing locations and branches that may need closer investigation.
Monthly Amount by Month: This chart tracks amount over time by month. It helps reveal seasonal movement, growth trends, and possible changes caused by campaigns or policy shifts.
Credit Union Dashboard in Google Sheets
Get the Credit Union Dashboard in Google Sheets template
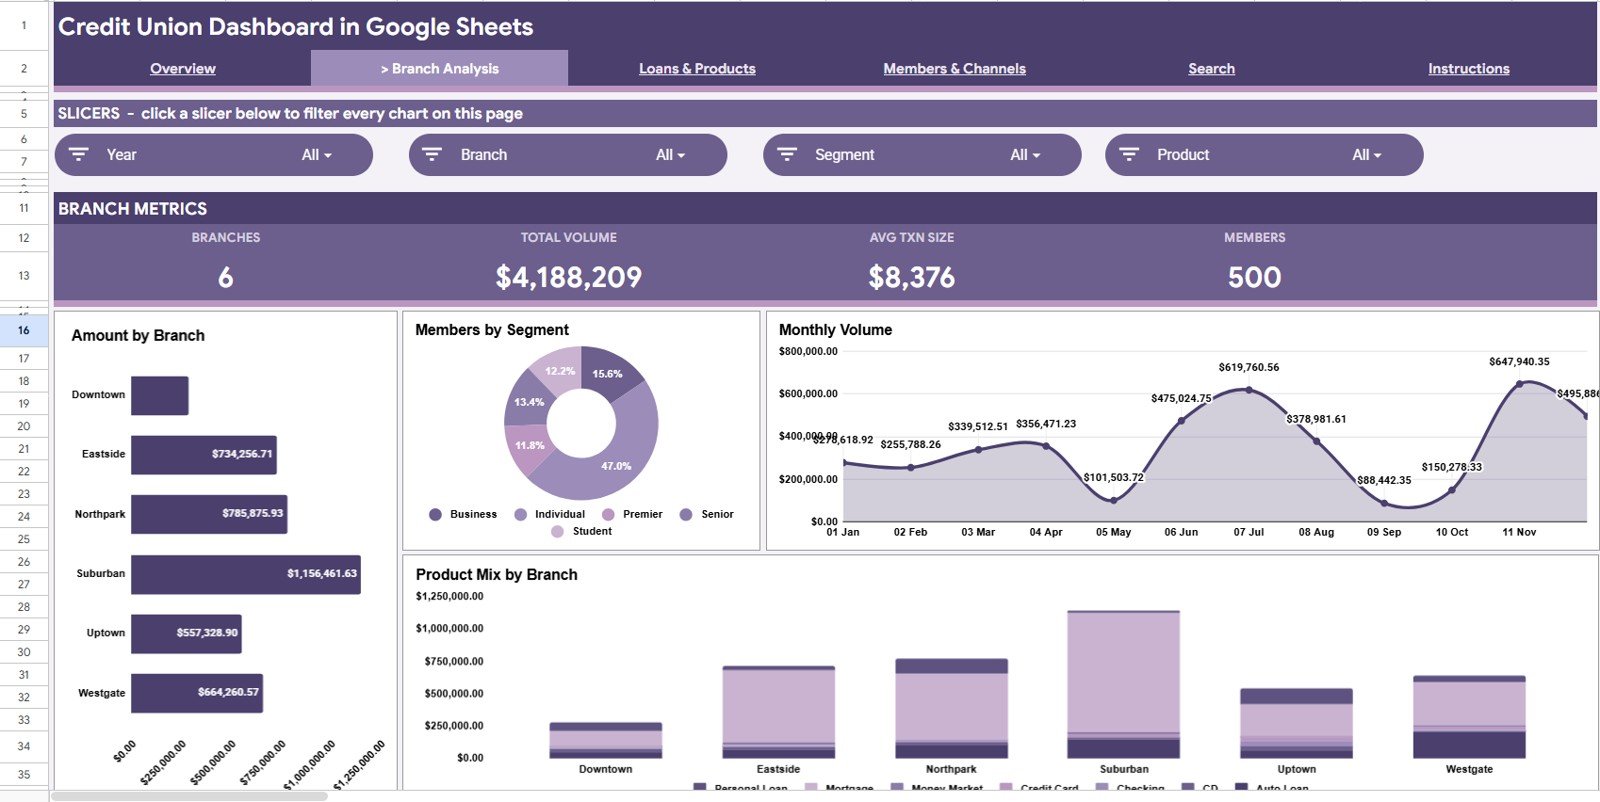
2. Branch Analysis
The Branch Analysis tab focuses on location-level performance. It helps managers compare branches without building separate pivot reports for each location.
Amount by Branch: This chart compares the total financial amount by branch. It is helpful for identifying which branches are driving the largest deposits, loan balances, or transaction amounts.
Members by Segment: This chart shows the member base by segment. It helps teams understand whether a branch is serving more retail, business, premium, youth, senior, or other member groups.
Monthly Volume by Month: This chart shows branch activity volume over time. It supports review of month-to-month movement and branch campaign performance.
Product Mix by Branch: This chart compares product usage across branches. It helps identify branches that are stronger in loans, deposits, cards, or other product areas.
Branch Analysis
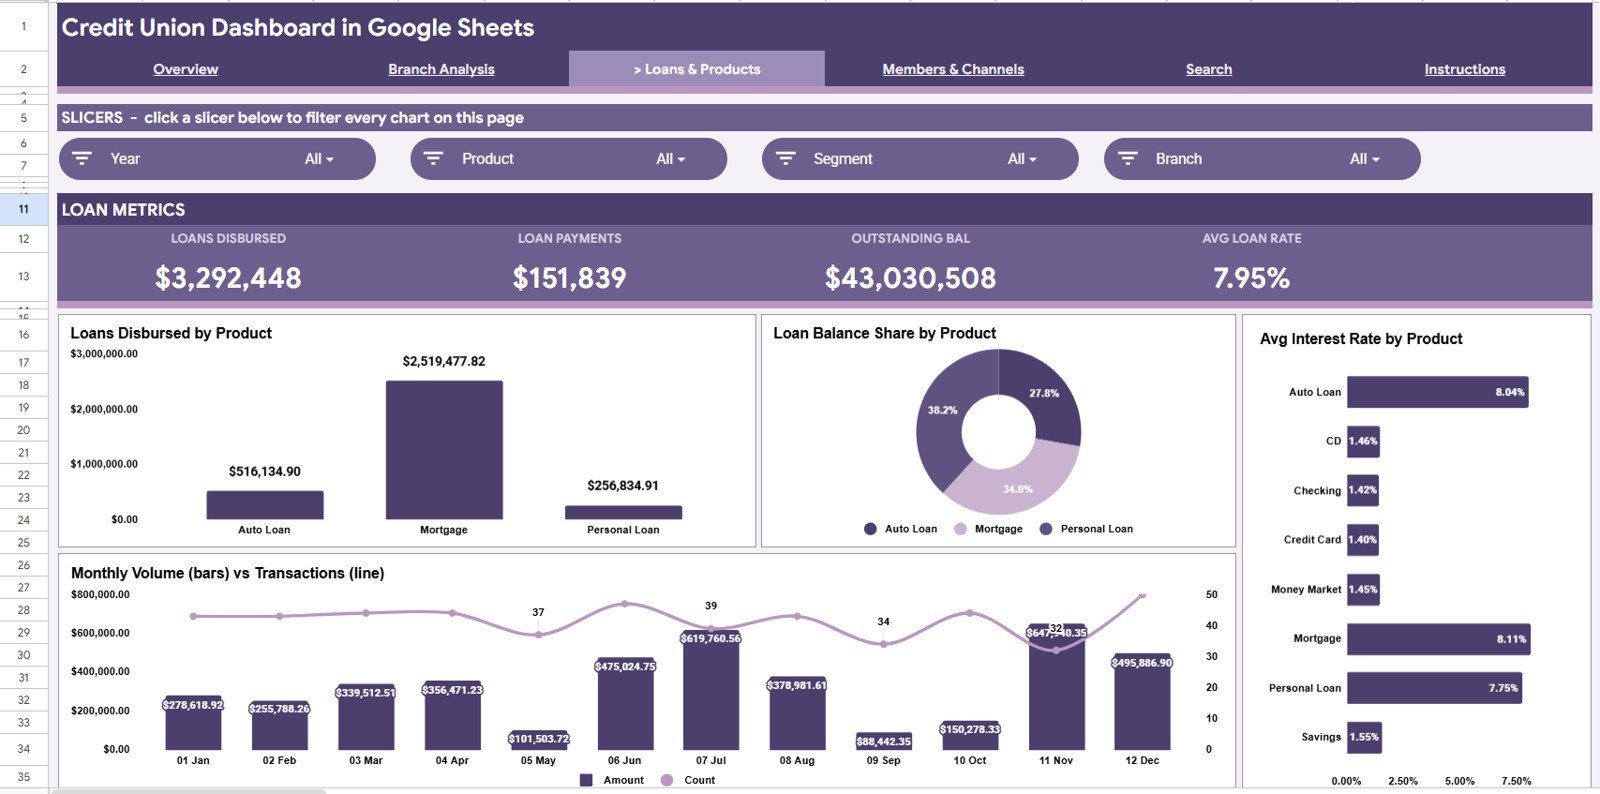
3. Loans & Products
The Loans & Products tab is built for lending and product portfolio review. It helps teams monitor the mix of loans and financial products while keeping credit and rate context visible.
Loans Disbursed by Product: This chart shows which product categories are receiving the most loan disbursement activity. It helps lending teams compare products such as personal loans, auto loans, mortgages, and other lending lines.
Loan Balance Share by Product: This chart shows how outstanding loan balance is distributed across products. It is useful for understanding portfolio concentration and exposure.
Avg Interest Rate by Product: This chart compares average interest rate by product. It helps teams see whether pricing varies appropriately by loan type or product category.
Monthly Volume and Transactions by Month: This chart combines volume and transaction movement over time. It helps reveal whether monthly changes are driven by larger transaction sizes, higher transaction count, or both.
Loans & Products
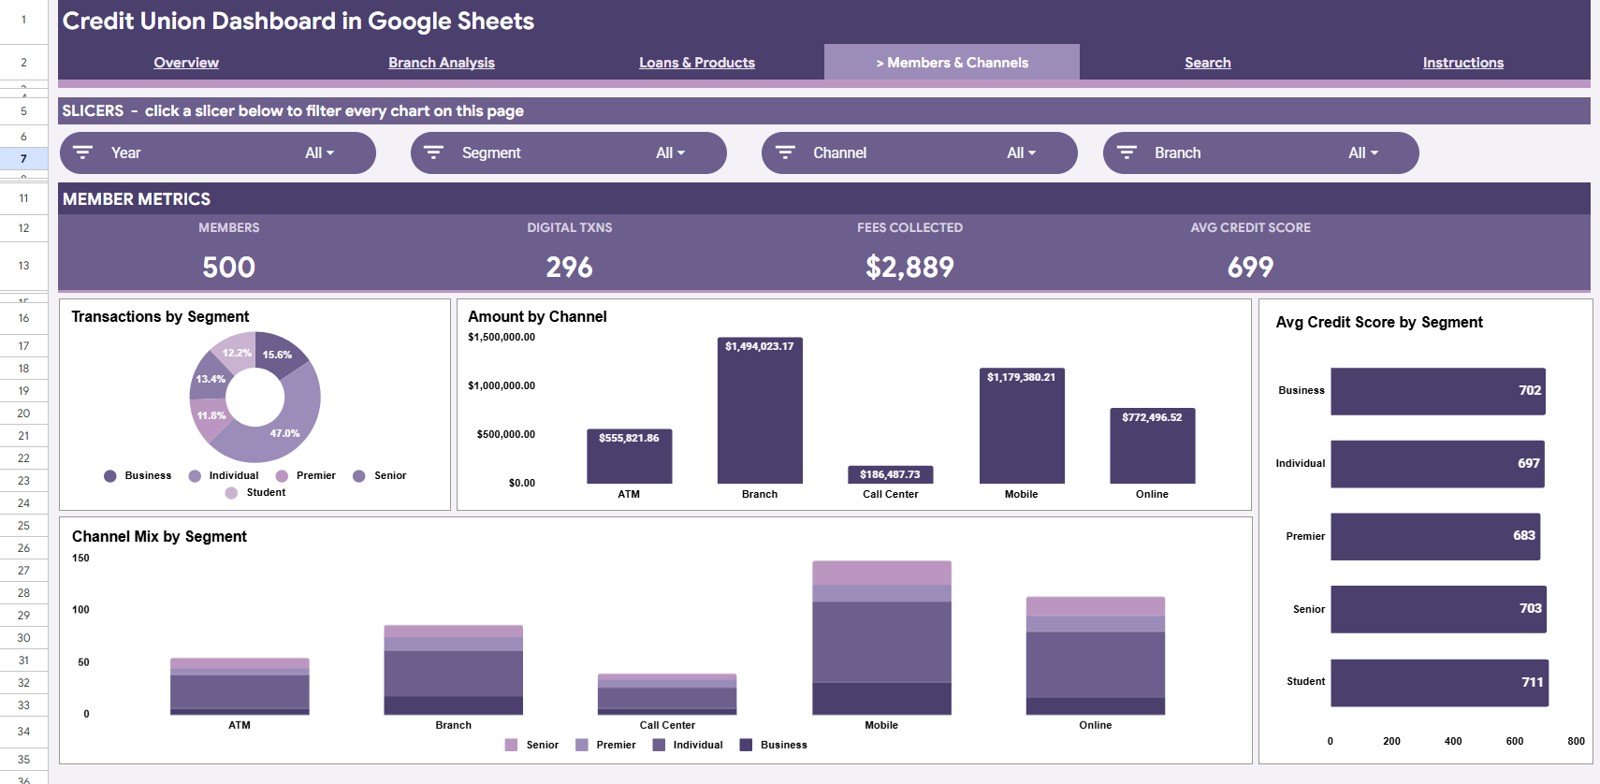
4. Members & Channels
The Members & Channels tab connects member behavior with service-channel usage. It helps teams understand how different segments interact with the credit union.
Transactions by Segment: This chart compares transaction activity across member segments. It can reveal which member groups are most active and which may need targeted engagement.
Amount by Channel: This chart shows the amount handled through each channel. It helps teams compare branch, mobile, online, ATM, and other channels from a financial activity perspective.
Avg Credit Score by Segment: This chart compares average credit score across member segments. It can support lending discussions and credit-risk review at a segment level.
Channel Mix by Segment: This chart shows how different segments use different channels. It helps branch, digital, and member service teams align support to actual behavior.
Members & Channels
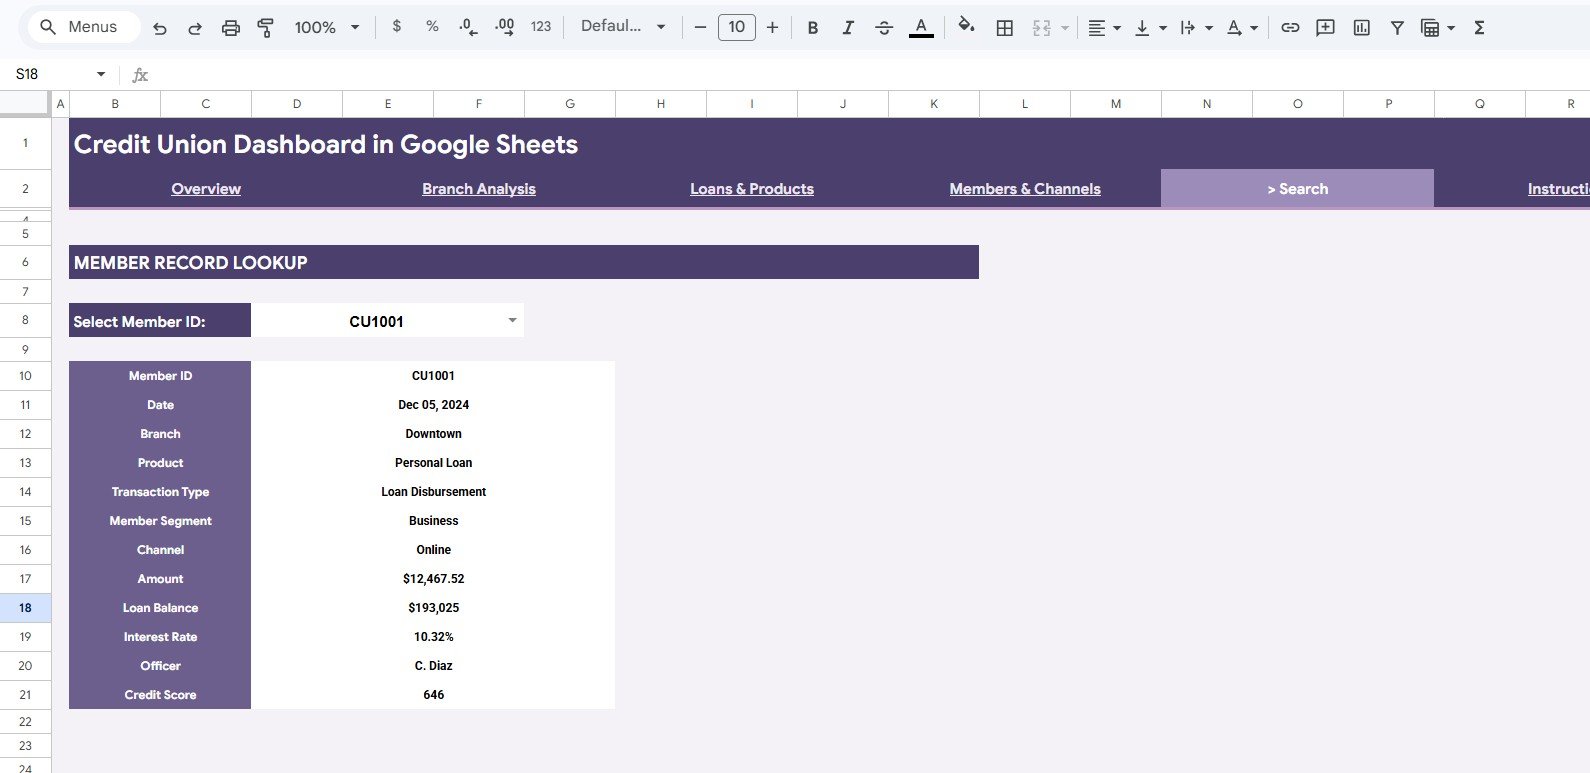
5. Search Sheet Tab
The Search Sheet tab provides a member record lookup. Users can select a Member ID and quickly see the matching details, including Date, Branch, Product, Transaction Type, Member Segment, Channel, Amount, Loan Balance, Interest Rate, Officer, and Credit Score. This is useful when a manager needs a fast record-level view without filtering the main data table.
Search Sheet tab
6. Data Sheet Tab
The Data Sheet tab is where users add or replace credit union records in the same structured format. Keeping the same columns and data types allows the cards, charts, slicers, and lookup sheet to refresh cleanly as new branch, product, member, and channel data is added.
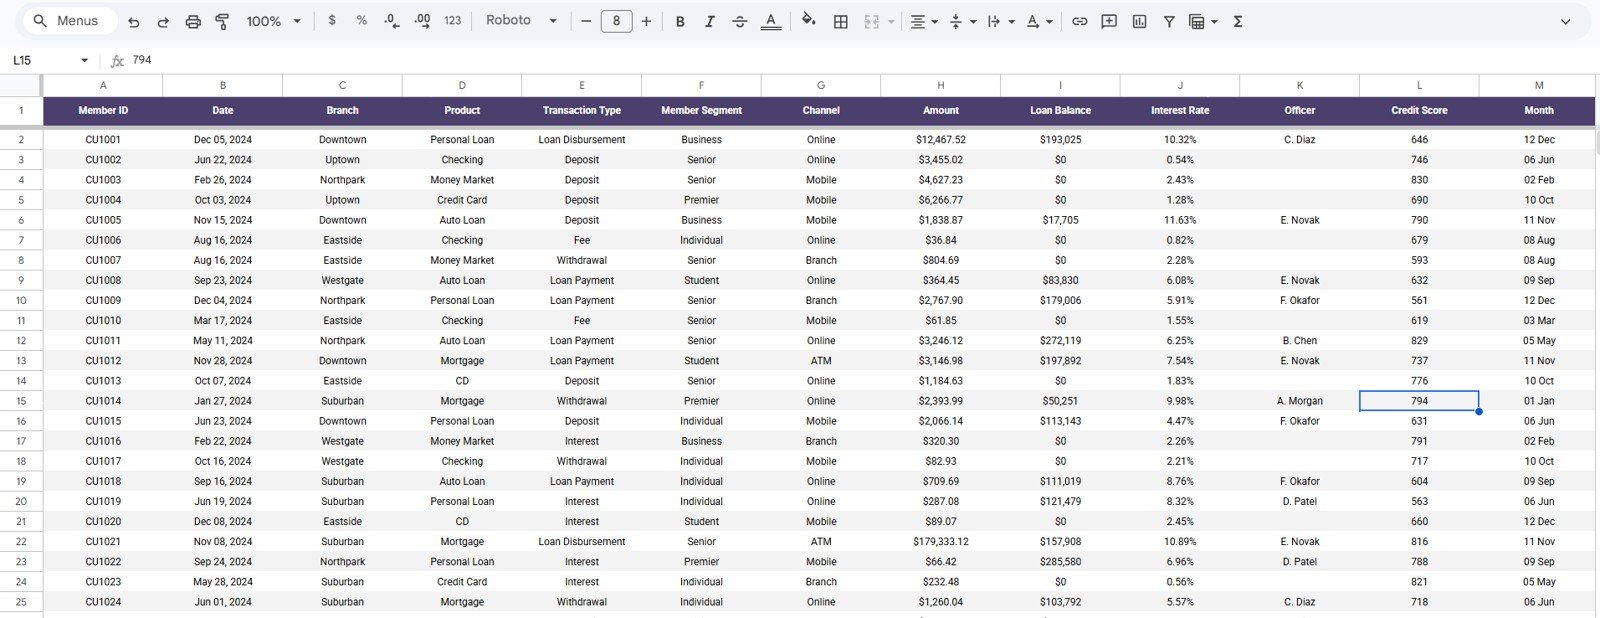
Data Sheet tab
Credit Union Dashboard in Google Sheets vs. Microsoft Excel Dashboard vs. Paid Banking SaaS – Feature Comparison
| Feature | Credit Union Dashboard in Google Sheets | Microsoft Excel Dashboard | Paid Banking SaaS |
|---|---|---|---|
| Setup speed | Fast template setup after copying into Google Sheets | Fast if users are comfortable with Excel files | Usually requires onboarding and configuration |
| Collaboration | Strong cloud collaboration with controlled sharing | Good with OneDrive or SharePoint, weaker with emailed files | Strong, but depends on user licenses and permissions |
| Cost | Low one-time template cost | Low if Excel is already available | Higher recurring software cost |
| Customization | Easy to adapt formulas, tabs, filters, and charts | Very flexible for advanced spreadsheet users | Can be limited by vendor configuration |
| Member lookup | Included Search Sheet by Member ID | Can be built manually | Usually included in operational systems |
| Best fit | Credit unions wanting a shareable, affordable reporting template | Teams already committed to Excel workflows | Larger institutions needing system integrations and governance |
Who Should Use This Template
- Credit union executives who want a quick overview of deposits, loans, transactions, and credit score trends.
- Branch managers who need to compare location performance, member segments, and product mix.
- Lending teams that monitor loans disbursed, loan balance share, and average interest rate by product.
- Operations teams that track channel usage across branch, mobile, online, ATM, and other transaction paths.
- Finance and analytics teams that want a structured Google Sheets reporting model before moving to a larger BI platform.
- Consultants and trainers creating credit union reporting examples for operational reviews.
Real-World Use Cases
Maria, Branch Operations Manager: Maria reviews branch amount, member segment distribution, and product mix before her weekly leadership meeting. Instead of asking each branch to send separate summaries, she updates the Data Sheet and uses slicers to compare locations.
Devon, Lending Analyst: Devon uses the Loans & Products tab to review loans disbursed by product and loan balance share. When an interest rate pattern looks unusual, he checks the average rate chart and then uses the Search Sheet to inspect member-level records.
Priya, Member Experience Lead: Priya monitors channel mix by segment to understand how different member groups use digital and branch services. She uses those insights to plan member education, staff coverage, and digital adoption campaigns.
Advantages of Credit Union Dashboard in Google Sheets
- Accessible collaboration: Google Sheets makes it easier for approved users to review a shared dashboard from the browser. Google also documents how file owners can control whether people can view, comment, or edit shared files in Google Drive sharing permissions.
- Lower cost: A template can be a practical starting point before investing in full banking analytics software.
- Easy editing: Teams can adjust formulas, chart titles, slicers, and source records directly in the workbook.
- Fast reporting cycle: Once the data format is stable, monthly and weekly updates can be completed much faster.
- Useful training model: The workbook can help new analysts understand the relationship between branch, product, member, channel, and credit metrics.
Opportunities for Improvement
- No live core banking integration: The template is designed for imported or pasted data, not automatic connection to a core banking platform.
- Requires clean input data: Branch names, product names, dates, channels, and member IDs should be standardized before analysis.
- Not a regulatory reporting system: It supports internal analysis and management reporting, but compliance reporting should follow your institution’s official process.
- Permission discipline matters: Because the dashboard can contain sensitive member-level data, teams should use controlled sharing and avoid public links.
Best Practices
- Keep the Data Sheet column names and order unchanged so the dashboard calculations continue working.
- Replace the sample data with approved internal data that has been reviewed for privacy and accuracy.
- Use consistent branch, product, segment, channel, and officer names to prevent duplicate categories in charts.
- Review outliers before presenting results, especially unusually high loan balances, interest rates, or credit scores.
- Restrict edit access to people responsible for maintaining the workbook, and give viewers read-only access where possible.
- Create a monthly backup copy before refreshing the Data Sheet so older reporting periods remain available.
Explore Relevant Templates
- Credit Union Dashboard in Power BI – useful if your team wants a BI-style credit union reporting model.
- Loan Portfolio KPI Dashboard in Google Sheets – focused on loan portfolio tracking and lending performance.
- Banking Report in Excel – useful for Excel-based banking analysis and reporting.
- Digital Microloans Dashboard in Power BI – designed for microloan performance and digital lending analysis.
- Browse Google Sheets templates for more cloud-based spreadsheet dashboards.
Frequently Asked Questions
What does the Credit Union Dashboard in Google Sheets track?
It tracks Total Deposits, Loans Disbursed, Transactions, Avg Credit Score, amount by product, transactions by channel, branch performance, monthly volume, product mix, member segments, loan balance, interest rate, and member lookup details.
Can I replace the sample data with my own credit union data?
Yes. The Data Sheet tab is designed for adding records in the same format. Once your data follows the required columns, the dashboard pages can update from the source table.
Does the template include a member lookup?
Yes. The Search Sheet lets users select a Member ID and view matching fields such as Date, Branch, Product, Transaction Type, Member Segment, Channel, Amount, Loan Balance, Interest Rate, Officer, and Credit Score.
Is this template better than a paid banking SaaS platform?
It depends on the use case. This Google Sheets dashboard is best for affordable, customizable internal reporting. A paid banking SaaS platform may be better for live integrations, formal governance, and enterprise-scale workflows.
Can I share the dashboard with branch managers?
Yes, but access should be controlled carefully. Because credit union data can include sensitive member information, share only with approved users and consider giving read-only access to people who do not need to edit the workbook.
Does this template work in Microsoft Excel?
This product is designed for Google Sheets. Some formulas and chart behavior may need adjustment if you download the workbook into Microsoft Excel.
About the Author
Built by PK – Microsoft Certified Professional with 15+ years of Excel, Google Sheets, and Power BI experience. PK is the founder of NextGenTemplates and has helped teams create practical dashboards, templates, and business reporting systems across spreadsheet and BI tools.
Conclusion
The Credit Union Dashboard in Google Sheets is a practical reporting template for teams that want clearer branch, loan, product, member, channel, and credit score analysis without starting from a blank workbook. With KPI cards, slicers, dashboard pages, a Search Sheet, and a structured Data Sheet, it gives credit union teams a faster way to prepare recurring reports and review operational performance.
Click here to purchase Credit Union Dashboard in Google Sheets
For step-by-step spreadsheet and automation tutorials, visit YouTube.com/@Ne
oTechNavigators.