A coaching business can create hundreds or thousands of session records every year: date, coach, client, program, package tier, revenue, duration, payment status, referral source, and session outcome. The Coach Performance and Revenue Dashboard in Google Sheets turns that raw session data into a shareable reporting workbook with 6 tabs, 4 KPI cards, 14 charts, slicers, a Session ID search sheet, and one editable Data Sheet.Coach Performance and Revenue Dashboard in Google Sheets
This guide walks through the full dashboard structure, explains every page, compares the template with Excel and paid coaching SaaS tools, and shows where it fits best for solo coaches, coaching teams, training consultants, and coaching operations managers. Because it runs in Google Sheets, you can share the same live file with team members, filter it in a browser, and review coaching revenue without a monthly subscription.Coach Performance and Revenue Dashboard in Google Sheets
Get the Coach Performance and Revenue Dashboard in Google Sheets
Coach Performance and Revenue Dashboard in Google Sheets
Key Features of Coach Performance and Revenue Dashboard in Google Sheets
- 6 connected tabs for Overview, Revenue, Clients, Programs, Search Sheet, and Data Sheet.
- 4 headline KPI cards showing Total Revenue, Completed Sessions, Avg Session Value, and Unique Clients.Coach Performance and Revenue Dashboard in Google Sheets
- 14 ready-built charts for revenue, package tiers, coaches, session types, payment methods, programs, referral sources, session volume, and status.Coach Performance and Revenue Dashboard in Google Sheets
- Interactive slicers for fast filtering during monthly reviews, team meetings, or client-performance discussions.
- Session ID lookup so you can select one session and instantly see date, coach, client, program, package tier, revenue, duration, status, and source details.
- Editable Data Sheet where you replace the sample records using the same coaching-session format.Coach Performance and Revenue Dashboard in Google Sheets
Dashboard Pages Explanation
Overview Page
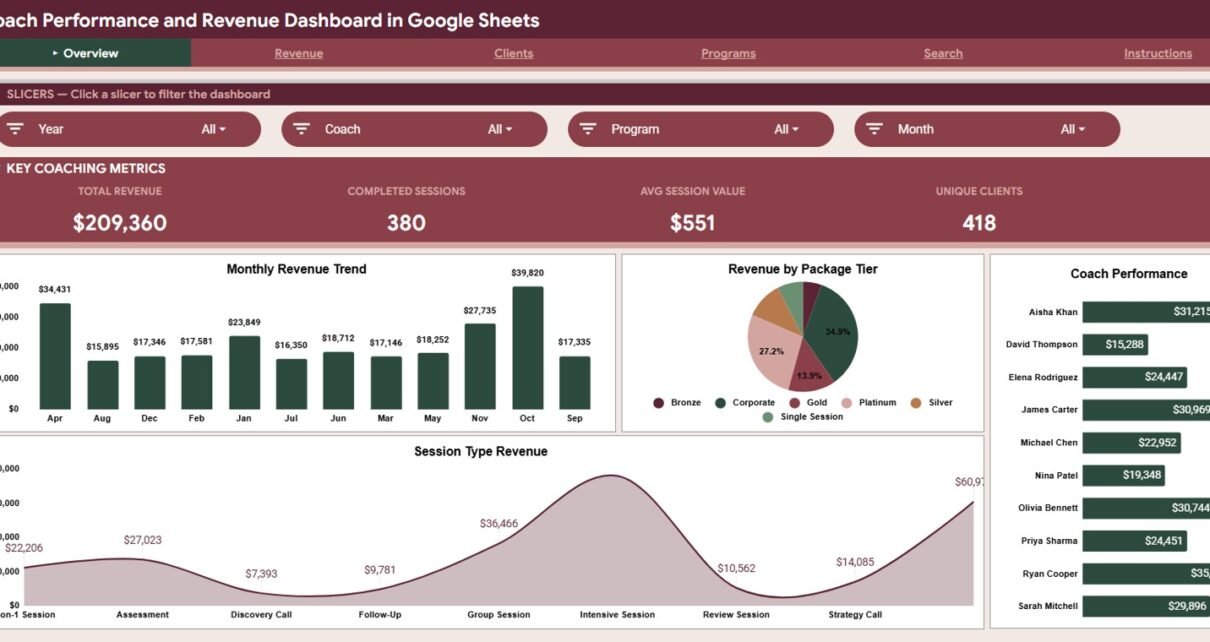
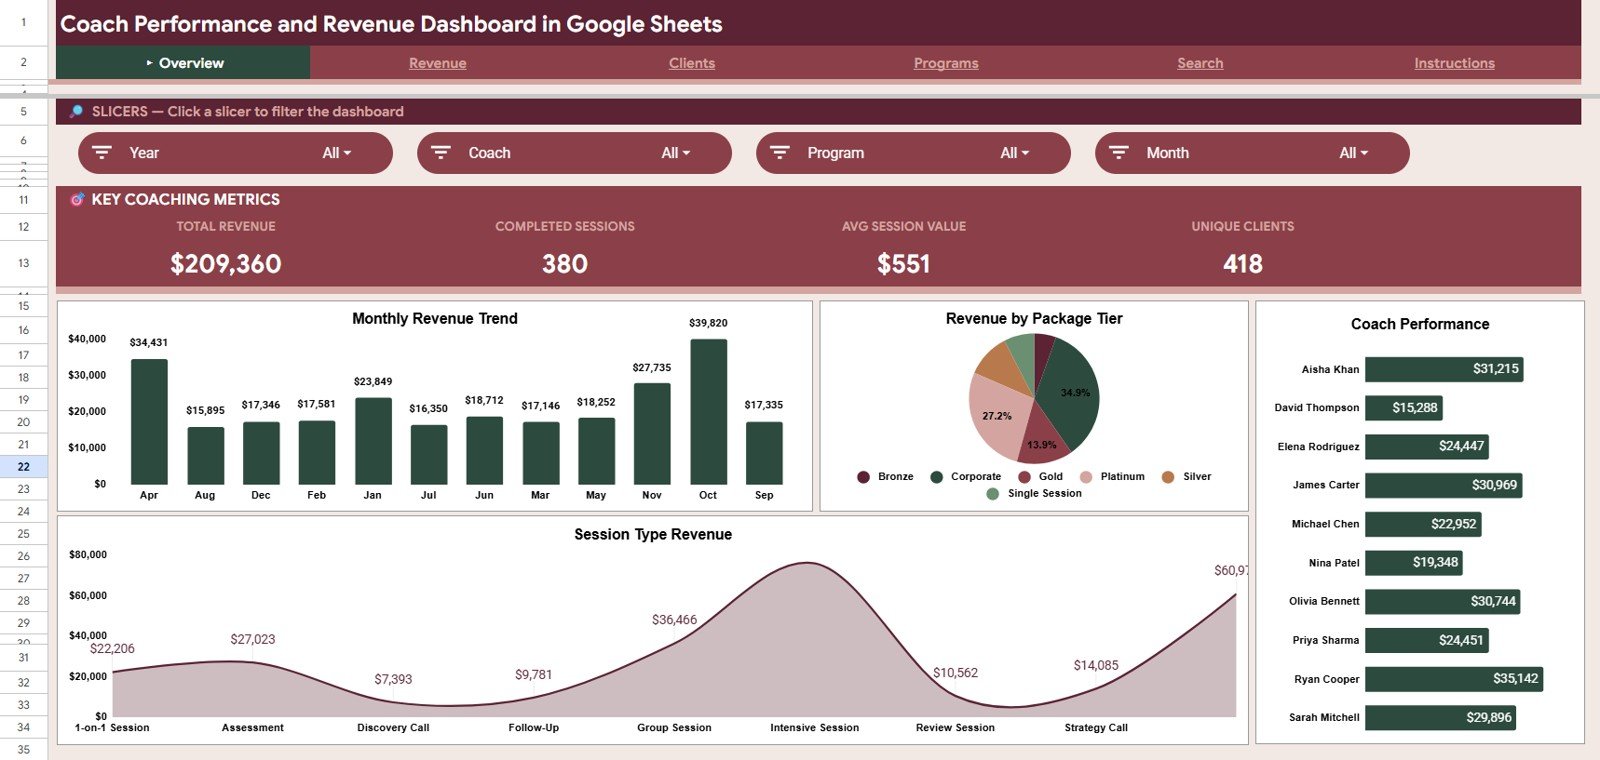
The Overview page is the command center for coaching performance. The top cards show Total Revenue, Completed Sessions, Avg Session Value, and Unique Clients, giving owners a fast read before they drill into the Revenue, Clients, and Programs tabs.Coach Performance and Revenue Dashboard in Google Sheets
Monthly Revenue by Month: This chart shows how revenue changes across months. Use it to spot seasonal dips, campaign-driven spikes, and months where follow-up activity needs more attention.Coach Performance and Revenue Dashboard in Google Sheets
Revenue by Package Tier: This chart compares revenue across package levels. It helps you see whether lower-tier, mid-tier, or premium packages are carrying the business.
Coach Performance by Coach: This chart compares coach-level contribution. It helps managers review individual coach revenue and identify where training, workload balancing, or recognition may be needed.Coach Performance and Revenue Dashboard in Google Sheets
Session Type Revenue by Session Type: This chart breaks revenue down by session format. It is useful for comparing one-on-one sessions, group sessions, workshops, assessments, or any other session types in your data.Coach Performance and Revenue Dashboard in Google Sheets
Coach Performance and Revenue Dashboard in Google Sheets
Revenue
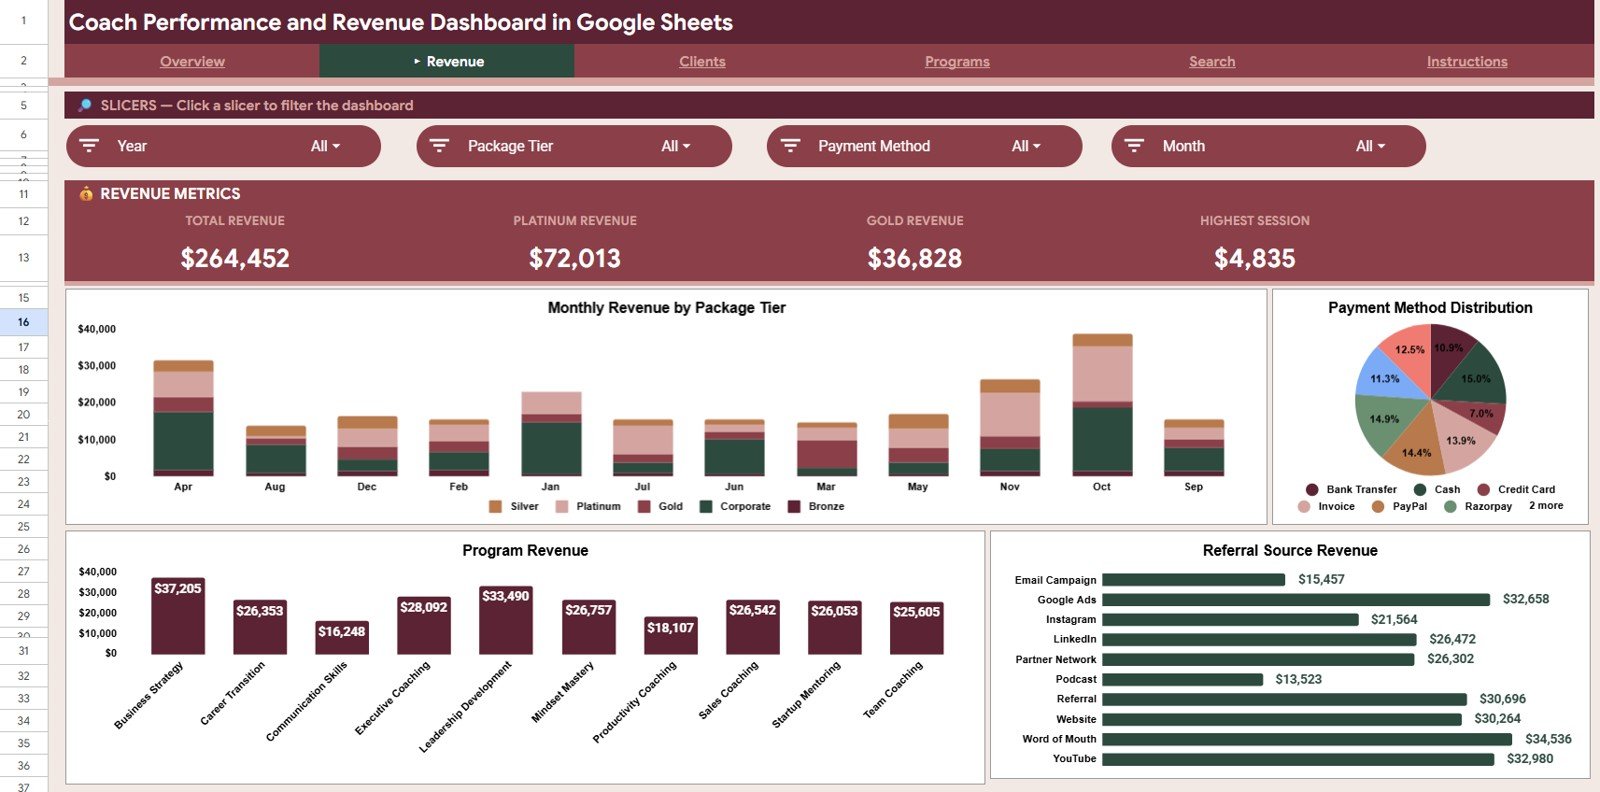
The Revenue tab gives a more focused view of financial performance. It helps coaching teams connect revenue to package tiers, payment methods, programs, and referral sources instead of reviewing total revenue alone.
Monthly Revenue by Package Tier: This chart shows how each package tier contributes to monthly revenue. It helps reveal whether month-over-month movement is coming from more sessions or a shift toward higher-value packages.
Payment Method Distribution by Payment Method: This chart shows how clients pay for coaching sessions. It helps finance and operations teams understand payment preferences and simplify reconciliation.
Program Revenue by Program: This chart ranks coaching programs by revenue contribution. Use it to decide which programs to promote, refine, expand, or retire.
Referral Source Revenue by Referral Source: This chart links revenue to acquisition channels. It helps distinguish sources that generate many clients from sources that generate high-value clients.
Revenue
Clients
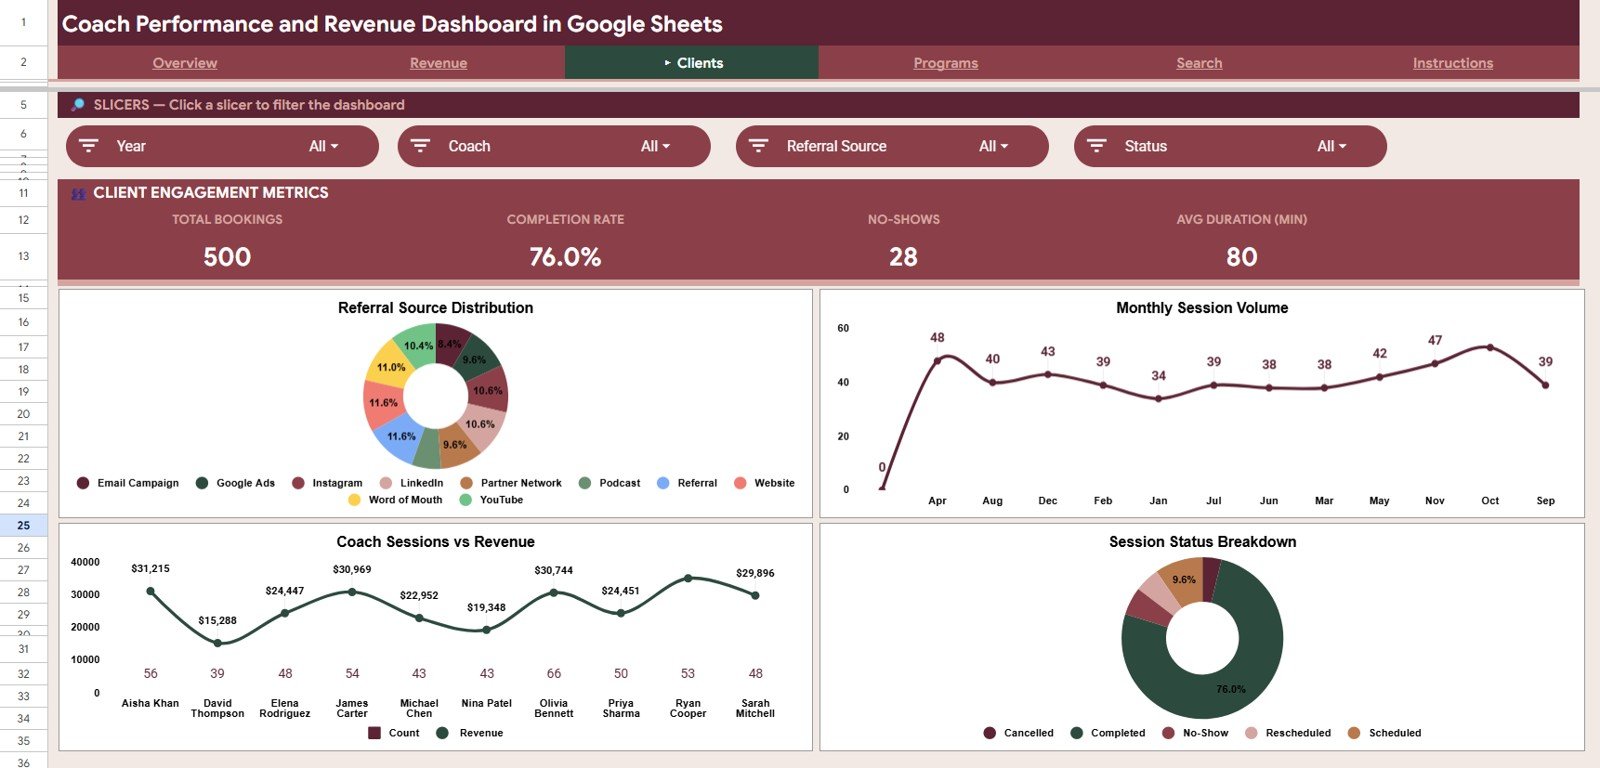
The Clients tab focuses on client flow, session volume, coach contribution, and status distribution. It is useful for weekly operations reviews because it shows both demand and completion patterns.
Referral Source Distribution by Referral Source: This chart shows where clients come from by source. It helps teams understand whether referrals, organic traffic, ads, partnerships, social content, or email campaigns are shaping the client base.
Monthly Session Volume by Month: This chart tracks session count over time. It helps reveal demand changes even when revenue is stable or changing because of package mix.
Sessions and Revenue by Coach: This chart compares session volume and revenue together by coach. It is better than a pure session-count chart because it adds financial context to activity levels.
Session Status Breakdown by Status: This chart separates sessions by status, such as completed, pending, cancelled, no-show, or rescheduled. It helps coaching teams monitor operational quality and reduce lost sessions.
Clients
Programs
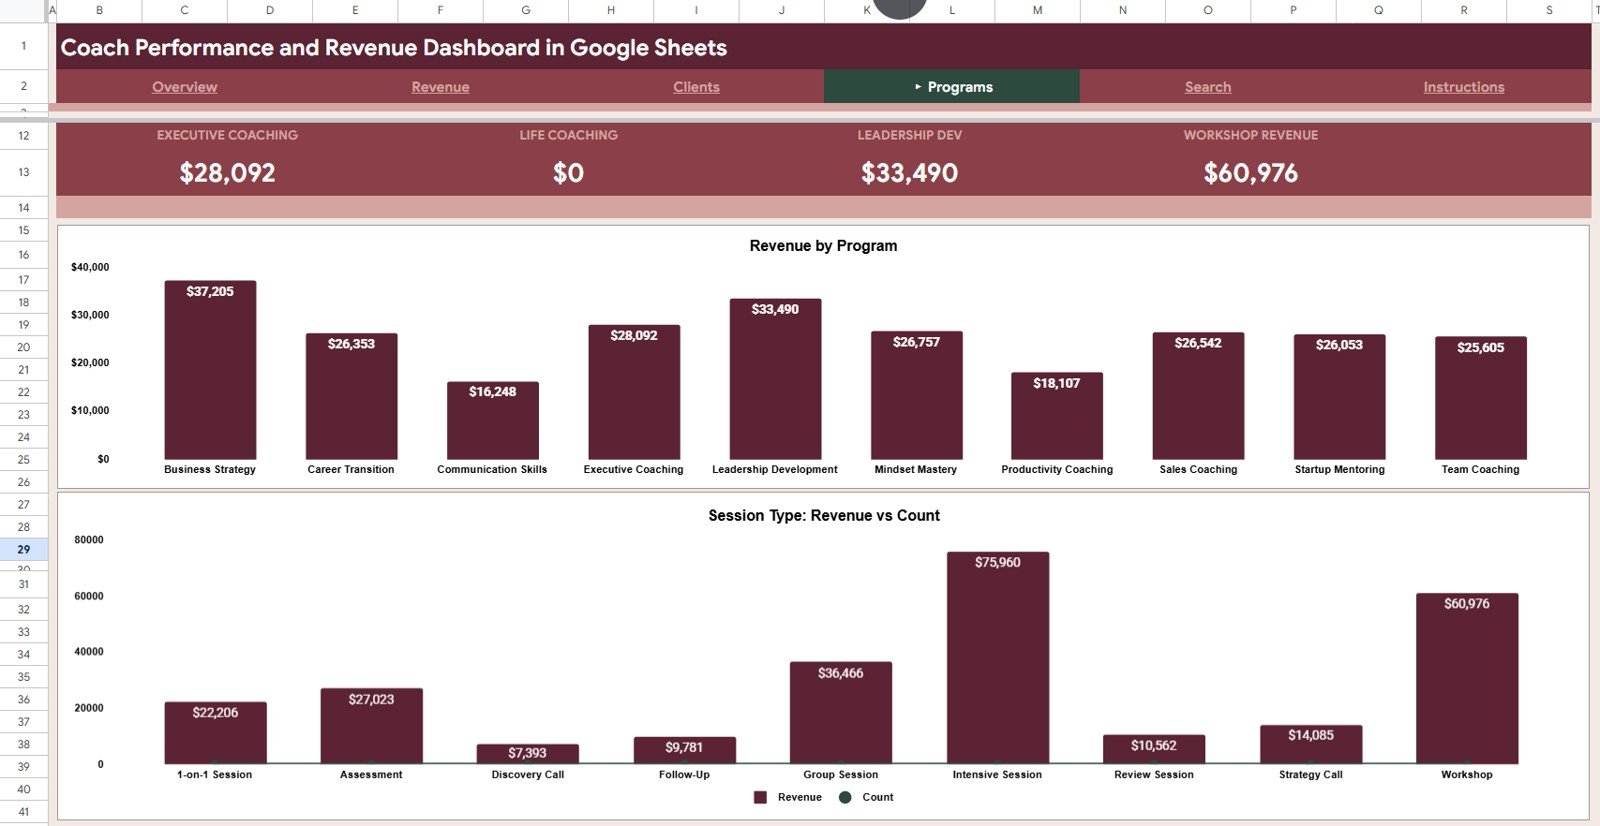
The Programs tab is built for offer review. It helps you compare which coaching programs and session formats produce the most revenue and which areas may need better positioning or pricing.
Revenue by Program: This chart compares revenue across coaching programs. It helps identify the strongest offers and programs that need repositioning, pricing changes, or more promotion.
Revenue and Count by Session Type: This chart combines session count and revenue by session type. It helps show whether a session format is frequent, profitable, both, or neither.
Programs
Search Sheet
The Search Sheet lets users select a Session ID and quickly view the matching session details. The returned fields include date, coach name, client name, program, session type, package tier, revenue, duration, payment method, status, referral source, client segment, and month.
This is helpful when a client asks about a specific session, when a manager needs to audit a record, or when finance wants to confirm a payment and package tier without filtering the main Data Sheet.
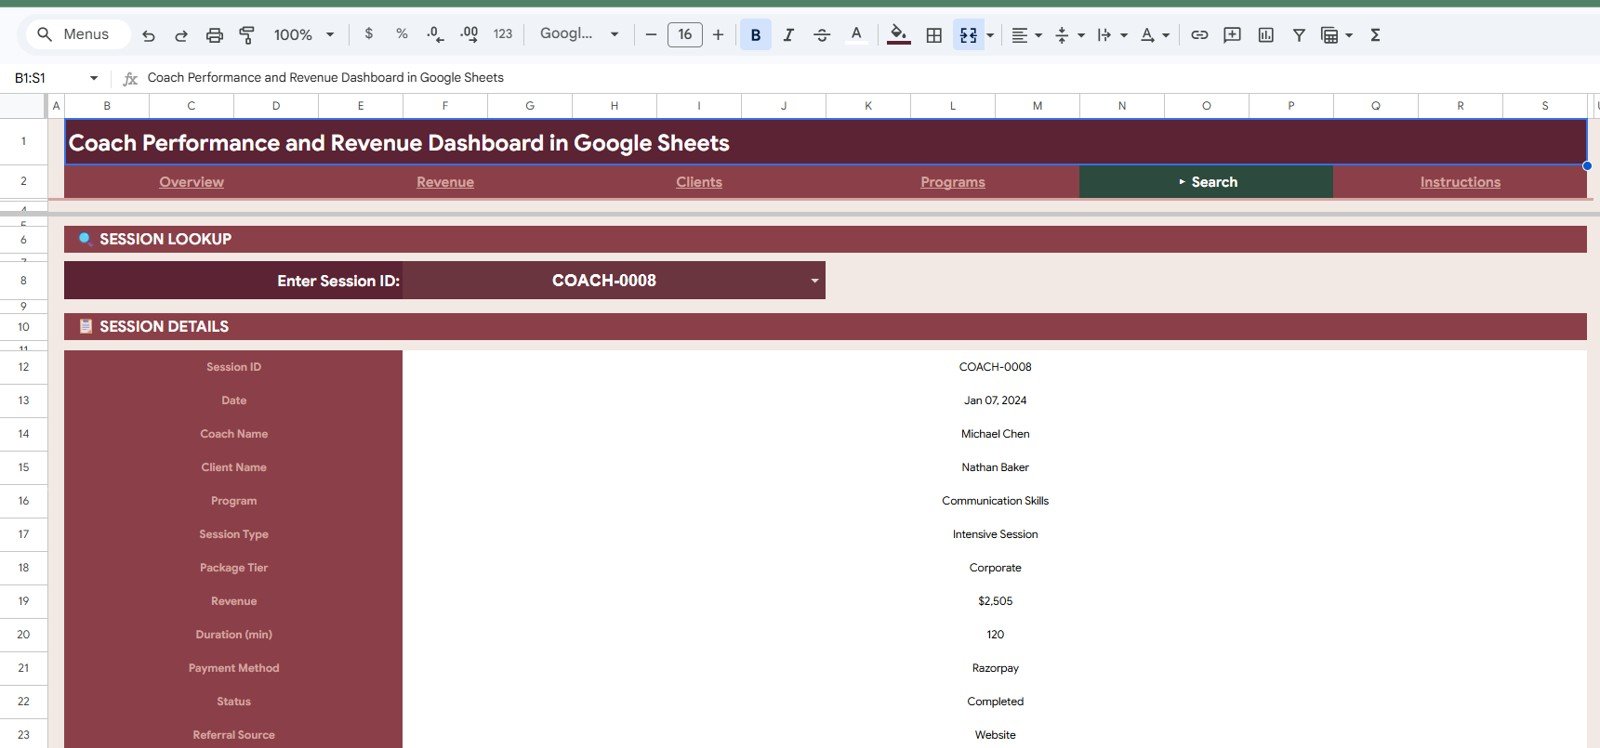
Search Sheet tab
Data Sheet
The Data Sheet is the single source table for the dashboard. Add your coaching session records in the same format and the KPI cards, charts, slicers, and Search Sheet update from that structured data.
Keep the headers and column order unchanged. For best results, use one row per session and keep names, program labels, package tiers, and referral sources consistent.
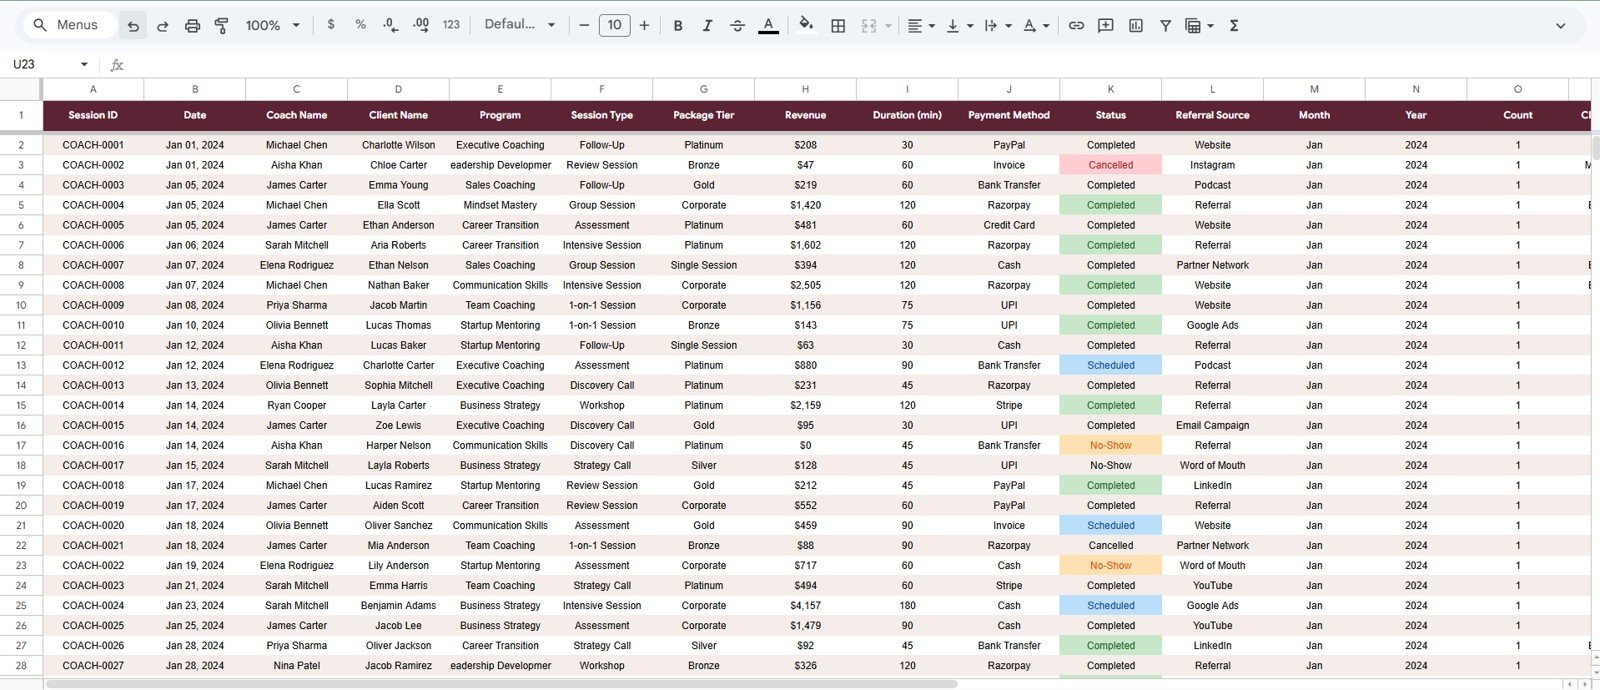
Data Sheet tab
Coach Performance and Revenue Dashboard in Google Sheets vs. Microsoft Excel Dashboard vs. Paid CRM/SaaS – Feature Comparison
| Feature | Coach Performance Dashboard in Google Sheets | Microsoft Excel dashboard | Paid coaching SaaS |
|---|---|---|---|
| Cost | $9.99 one-time | Template cost or workbook build time | $20 to $100+ per month depending on plan |
| Platform | Google Sheets in browser | Excel desktop or web | Vendor-hosted web app |
| Setup time | Copy sheet, paste rows, review charts | Open workbook, replace data, refresh | Configuration, imports, and onboarding |
| Real-time team collaboration | Built into Google Drive sharing | Best with Microsoft 365 | Usually included by paid seats |
| Mobile access | Google Sheets app or browser | Excel mobile with workbook limits | Vendor app or browser |
| Customizable fields | Editable formulas, charts, slicers, and source fields | Editable workbook | Limited by vendor permissions |
| Share with link | Yes, using Google permissions | Possible through Microsoft cloud | Login controlled |
| Session lookup | Built-in Search Sheet by Session ID | Manual filters or lookup formulas | Usually part of client records |
| Year-1 cost at 5 users | $9.99 plus any Google Workspace cost | Template cost plus Microsoft licensing if needed | Often hundreds or thousands |
Who Should Use This Template
This template is a strong fit for solo coaches, business coaches, executive coaches, wellness coaches, tutoring and coaching teams, training consultants, and coaching operations managers who need a shared reporting layer for sessions, revenue, clients, programs, package tiers, referral sources, and coach performance.
It is not a full coaching operations platform. If you need client portals, appointment booking, intake forms, contracts, automated reminders, or payment processing, use this dashboard alongside a dedicated tool such as CoachAccountable, Practice Better, Calendly, Acuity, or your existing CRM.
Real-World Use Cases
Priya runs a wellness coaching practice with four coaches. She uses the Overview and Revenue tabs every Monday to compare package tier revenue, monthly trends, and coach contribution before planning the week’s client follow-up.
Daniel manages an executive coaching program for corporate clients. He checks Program Revenue by Program and Revenue and Count by Session Type before deciding which coaching offers should receive more sales attention next quarter.
Meera handles operations for a coaching team. She uses the Search Sheet during support questions to pull up a single session by Session ID, confirm the payment method, and verify the status without scrolling through the Data Sheet.
Advantages of Coach Performance and Revenue Dashboard in Google Sheets
The first advantage is speed. You do not need to design charts, write lookup formulas from scratch, or build slicer views before you can start reviewing coaching performance. Replace the sample rows with your own records and the structure is ready.
The second advantage is collaboration. Google Sheets makes it easy to share a live link with managers, coaches, finance, or partners. For help controlling who can view or edit the file, see the official Google Docs editors sharing guide.
The third advantage is ownership. Your dashboard remains an editable spreadsheet in your Google Drive, so you can adapt fields, colors, formulas, sheet names, chart types, and reporting views as your coaching practice changes.
Opportunities for Improvement
This dashboard is intentionally focused on analysis and reporting. It does not book appointments, send reminders, collect payments, or manage a client portal. Teams that need those workflows should connect this reporting process to the system where sessions are booked and paid.
Like any spreadsheet dashboard, it also depends on clean data. Inconsistent coach names, program labels, package tiers, or referral-source names can split charts into duplicate categories. Very large datasets may also require a database or BI tool if performance becomes slow.
Best Practices
- Keep one row per coaching session in the Data Sheet.
- Do not rename or reorder source columns unless you also update the connected charts and formulas.
- Standardize coach names, program names, package tiers, status labels, and referral-source values.
- Use view-only sharing for stakeholders who should not edit source data.
- Duplicate the file at month-end or quarter-end if you want a clean historical archive.
- Use slicers before meetings so each discussion starts with the right coach, program, package tier, or time period.
Explore Relevant Templates
If you track coaching revenue and client activity, these related templates may also help:
- Coaching Business Dashboard in Google Sheets – a broader coaching analytics dashboard for revenue, sessions, clients, and programs.
- Tutoring Business Dashboard in Google Sheets – a related education-service dashboard for tutoring revenue and sessions.
- Executive Coaching Dashboard in Excel – desktop Excel reporting for executive coaching programs.
- Executive Coaching Dashboard in Power BI – Power BI analytics for leadership coaching.
- Browse all Google Sheets dashboard templates.
Want to build dashboards like this step by step? The Excel Pivot Tables & Dashboards course on NextGenTemplates Academy walks you through the method with practice files.
Get the Coach Performance and Revenue Dashboard in Google Sheets
Frequently Asked Questions
What KPIs does the Coach Performance and Revenue Dashboard in Google Sheets track?
It tracks Total Revenue, Completed Sessions, Avg Session Value, and Unique Clients on the Overview page, plus detailed charts for package tiers, coaches, programs, payment methods, referral sources, monthly revenue, session volume, and status.
How many tabs are included?
The template includes 6 Google Sheets tabs: Overview, Revenue, Clients, Programs, Search Sheet, and Data Sheet.
Can I use this for multiple coaches?
Yes. The dashboard includes coach-level analysis, so a coaching practice can compare sessions and revenue by coach when the Data Sheet includes a consistent Coach Name field.
Does the dashboard include a search function?
Yes. The Search Sheet lets you select a Session ID and return the matching date, coach, client, program, session type, package tier, revenue, duration, payment method, status, referral source, client segment, and month.
Do I need paid software to use it?
No. It runs in Google Sheets. A free Google account can open and edit Google Sheets files, although Google Workspace may be useful for teams that need business-level sharing controls.
Can I customize the dashboard?
Yes. You can edit formulas, charts, colors, labels, sheet names, slicers, and source columns. If you change the Data Sheet structure, review the connected charts and formulas afterward.
About the Author
Built by PK – Microsoft Certified Professional with 15+ years of Excel, Google Sheets, and Power BI experience. Founder of NextGenTemplates, reaching 300K+ subscribers across YouTube channels. Every template is hand-built and tested before release.
Conclusion
The Coach Performance and Revenue Dashboard in Google Sheets gives coaching teams a clear way to review revenue, sessions, clients, package tiers, programs, referral sources, coach performance, and session status in one editable workbook. It is a practical fit when you want a low-cost reporting layer without moving your whole operation into a new SaaS platform.
Instant download – One-time payment – No subscription
Last updated: July 7, 2026.