The Investment Management Dashboard in Google Sheets is built for investors, finance teams and advisors who want one clear place to track portfolio value, invested amount, net gain or loss, average return, allocation, regions, risk levels, funds and individual holdings. Instead of checking separate statements or rebuilding charts every month, the template turns your investment data into a Google Sheets dashboard with KPI cards, slicers, 16 charts and a Holding ID lookup.
It is designed for practical portfolio review, not just presentation. Update the data sheet and you can immediately see where value is concentrated, which funds are performing and where risk may need attention.
🎥 Watch the Video Tutorial
Get the Investment Management Dashboard
Key Features of the Investment Management Dashboard in Google Sheets
- Dashboard tabs for Overview, Asset Allocation, Performance, Regional & Risk and Search, a Data Sheet for raw entries, and a Guide tab linked from the navigation bar.
- Headline KPI cards for Portfolio Value, Total Invested, Net Gain / Loss and Avg Return, plus four more cards on each analysis tab.
- Four slicers on every dashboard tab, so you can filter without editing formulas.
- 16 charts for asset class, region, fund, sector, month, return, risk level and market value.
- Holding Lookup by Holding ID for quickly finding a specific investment record.
- A structured data sheet so you can keep adding records in the same format.
- Google Sheets format, so the dashboard can be shared and edited online without desktop software.
KPI Cards and Slicers by Tab
| Tab | KPI cards | Slicers |
|---|---|---|
| Overview | Portfolio Value, Total Invested, Net Gain / Loss, Avg Return | Year, Asset Class, Region, Portfolio |
| Asset Allocation | Total Invested, Market Value, Avg Holding Size, Total Holdings | Year, Asset Class, Sector, Risk Level |
| Performance | Avg Return, Net Gain, Best Return, Profitable Holdings | Year, Asset Class, Portfolio, Risk Level |
| Regional & Risk | Portfolio Value, Total Invested, High-Risk Value, Net Gain | Year, Region, Risk Level, Asset Class |
How the Key Numbers Are Calculated
The figures below can be reproduced from the sample data shown in the screenshots:
| Measure | Calculation | Sample result |
|---|---|---|
| Net Gain / Loss | Market Value − Invested | $132,684,014 − $122,602,500 = $10,081,514 |
| Avg Holding Size | Total Invested ÷ Total Holdings | $122,602,500 ÷ 500 = $245,205 |
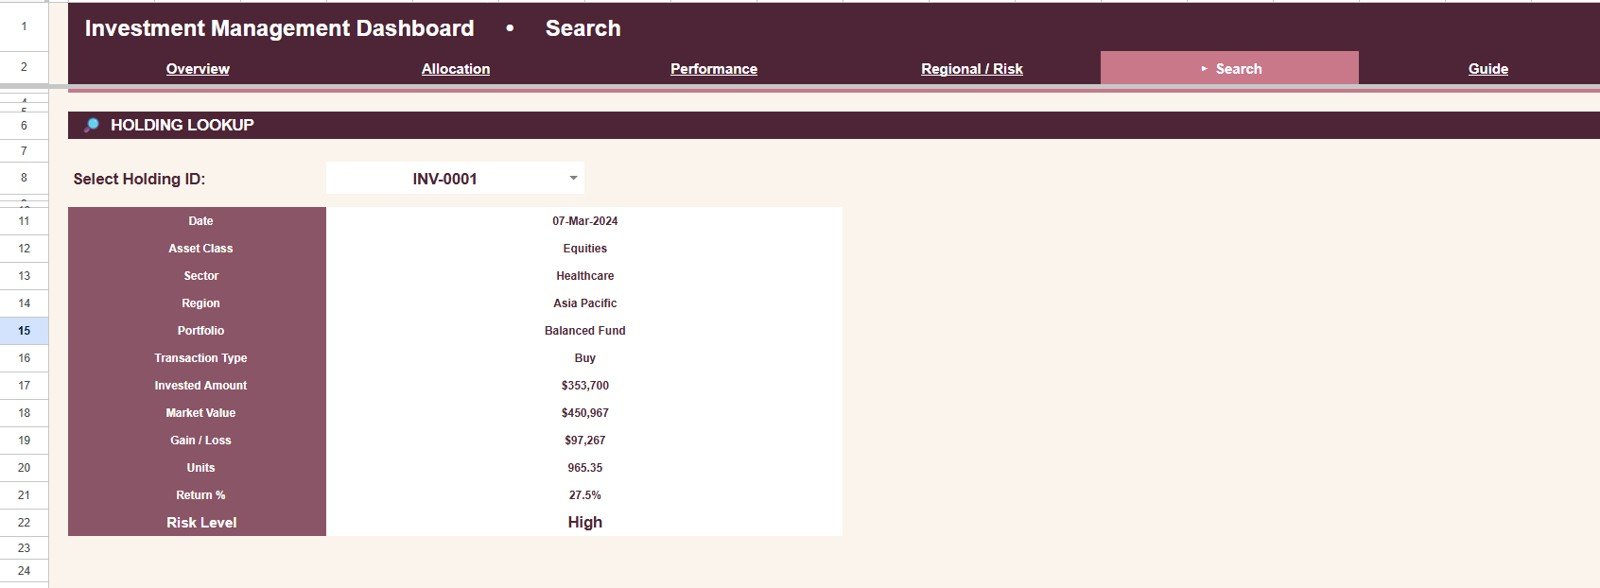
| Return % (one holding) | Gain ÷ Invested | INV-0001: $97,267 ÷ $353,700 = 27.5% |
Dashboard Pages Explained
The template gives each analysis area its own page. The Overview gives a fast executive readout, while the deeper tabs let you inspect allocation, returns, regional exposure, risk levels and holding-level data.
1. Overview Page
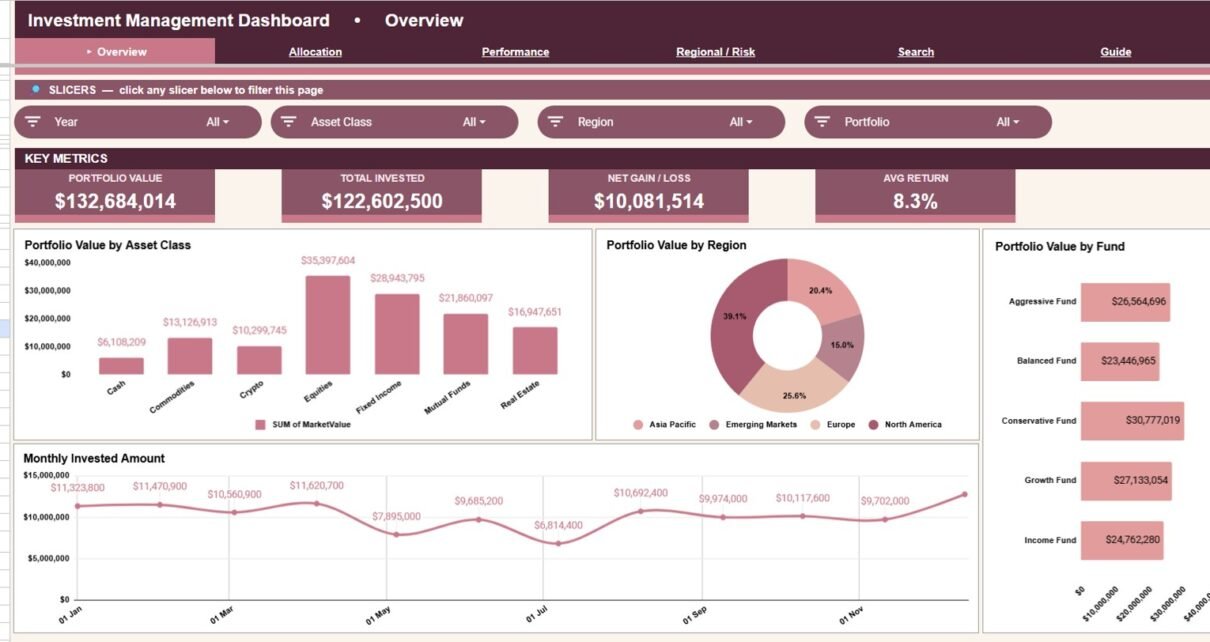
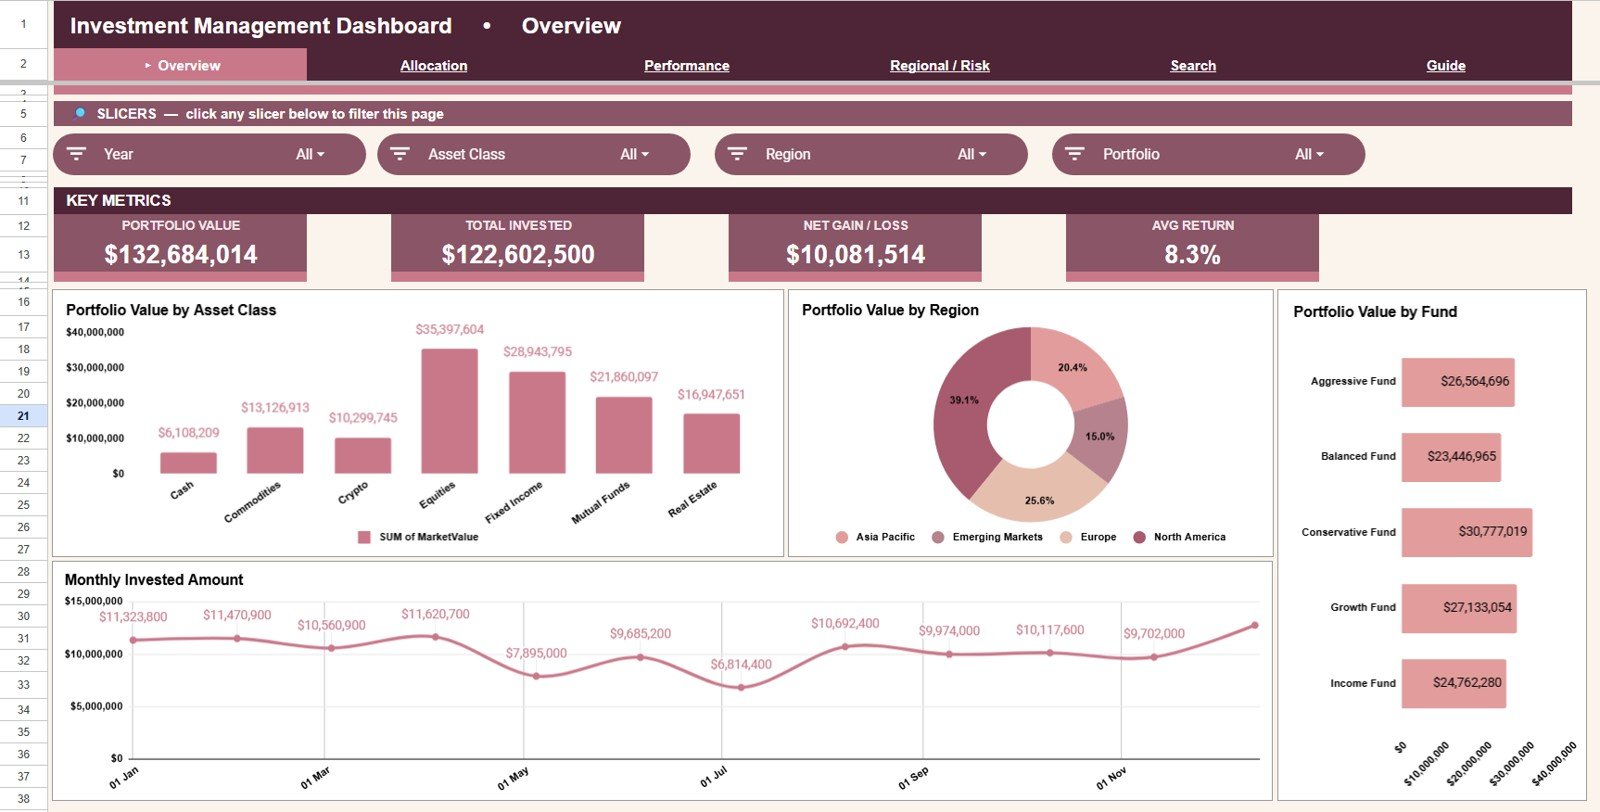
The Overview page is the main command centre. Four KPI cards summarise where the portfolio stands before you look at the detailed charts.
- Portfolio Value: the current market value of the holdings.
- Total Invested: the total amount invested, which gives context for the market value.
- Net Gain / Loss: market value minus invested amount, showing whether the portfolio is ahead or behind.
- Avg Return: the average return across the selected data, which changes as you apply slicers.
- Portfolio Value by Asset Class: value across Cash, Commodities, Crypto, Equities, Fixed Income, Mutual Funds and Real Estate.
- Portfolio Value by Region: the split between Asia Pacific, Emerging Markets, Europe and North America, to spot concentration.
- Portfolio Value by Fund: value in the Aggressive, Balanced, Conservative, Growth and Income funds.
- Monthly Invested Amount: investment activity by month, to review contribution patterns.
2. Asset Allocation
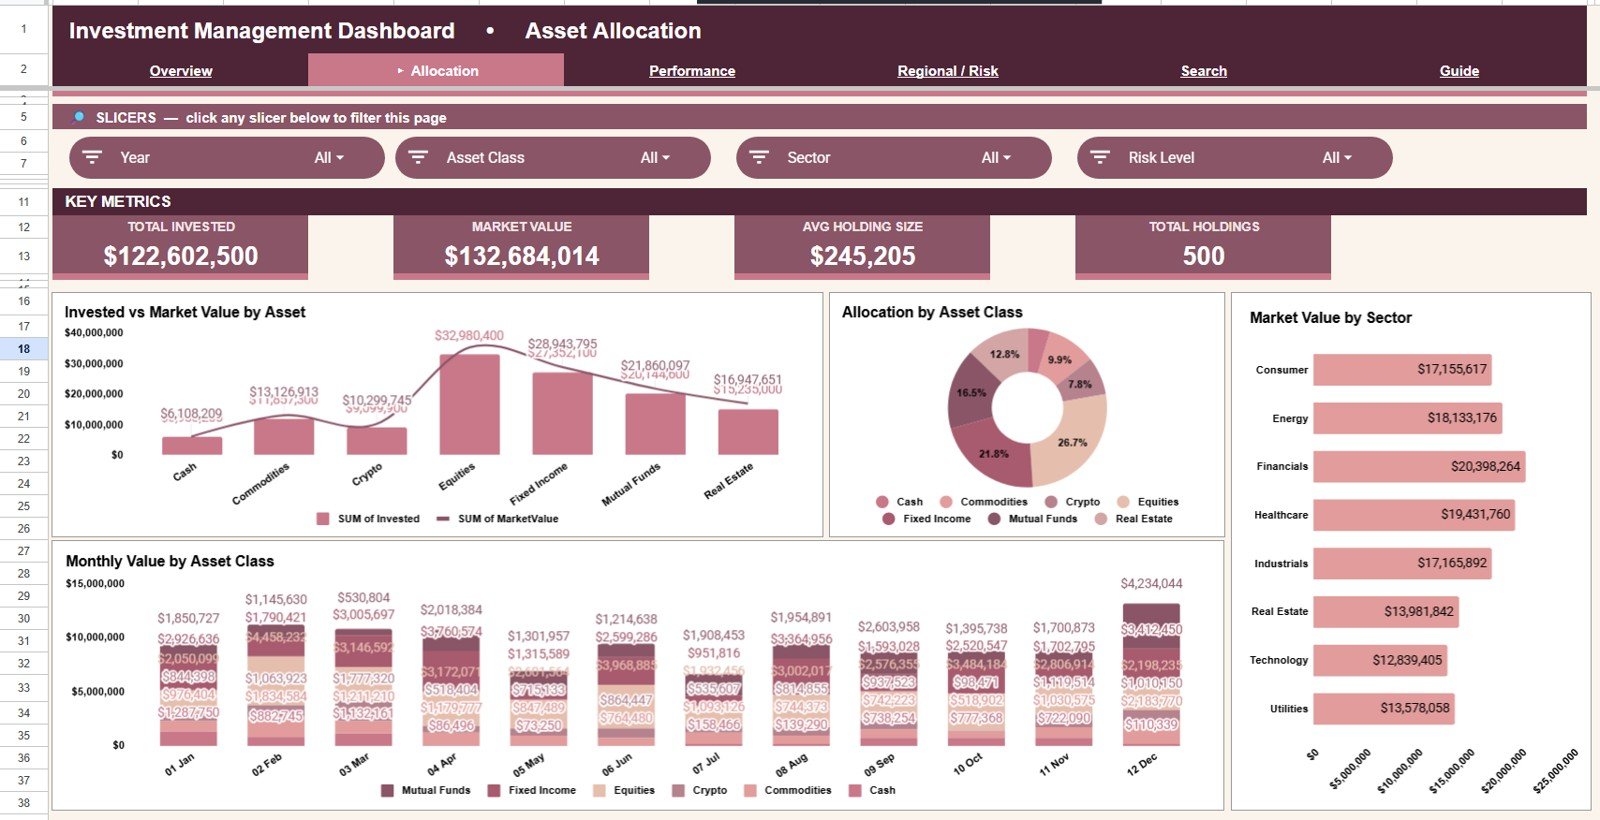
The Asset Allocation tab shows how investments are spread across asset classes, sectors and months, so you can check whether the mix matches your intended strategy.
- Invested vs Market Value by Asset: compares capital deployed with current value for each asset class.
- Allocation by Asset Class: the percentage share of each asset class.
- Market Value by Sector: exposure to Consumer, Energy, Financials, Healthcare, Industrials, Real Estate, Technology and Utilities.
- Monthly Value by Asset Class: a stacked monthly view of how each asset class grows or shrinks.
3. Performance
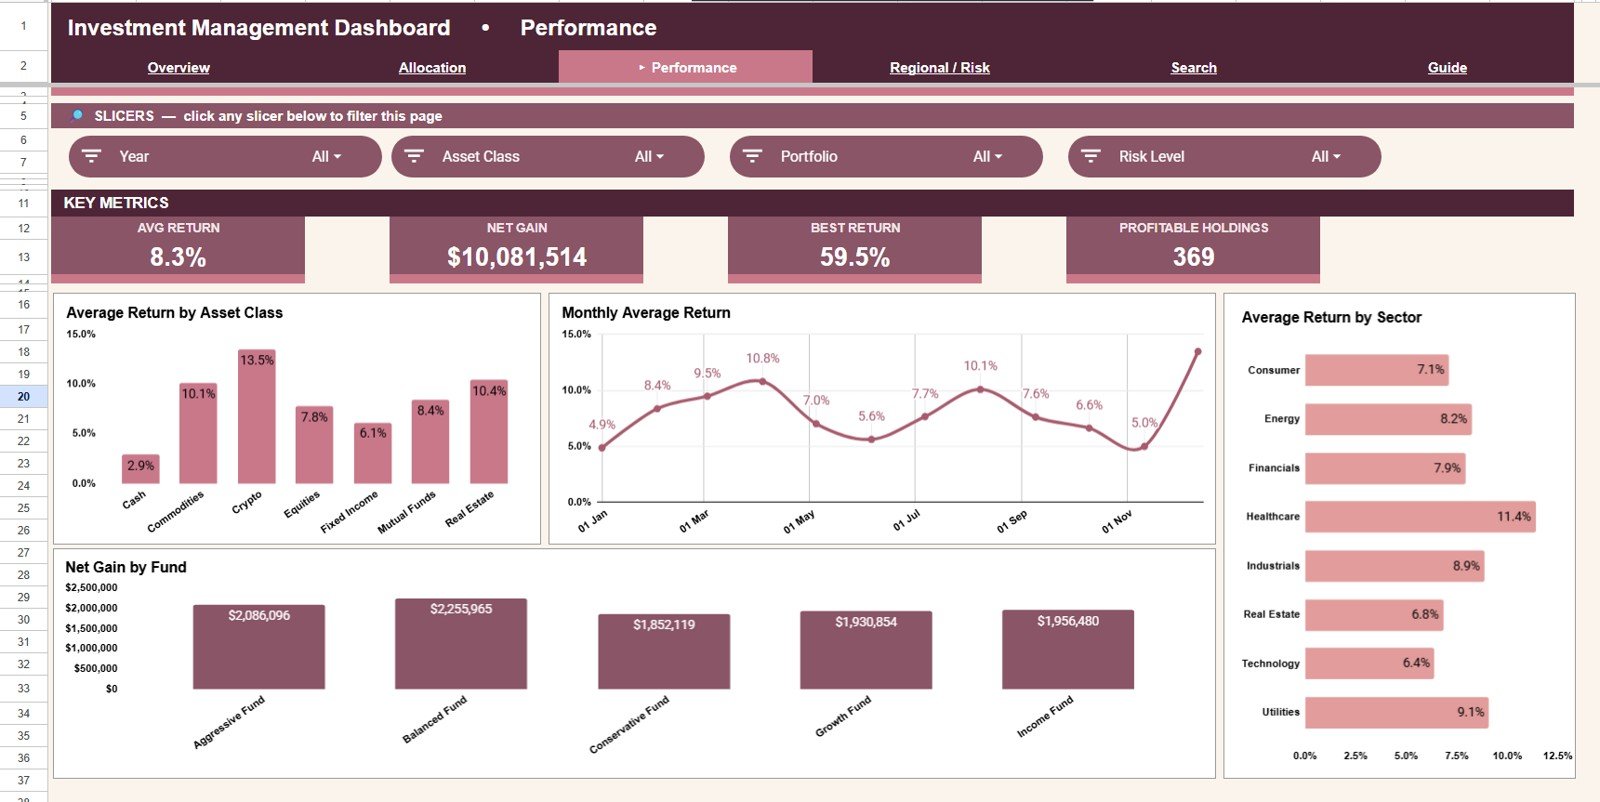
The Performance tab reviews return trends and gain contribution, showing which asset classes, sectors, months and funds drive results.
- Average Return by Asset Class: compares performance between investment types.
- Monthly Average Return: reveals monthly patterns and volatility.
- Average Return by Sector: highlights strong and weak sectors.
- Net Gain by Fund: the gain each fund contributes.
4. Regional & Risk
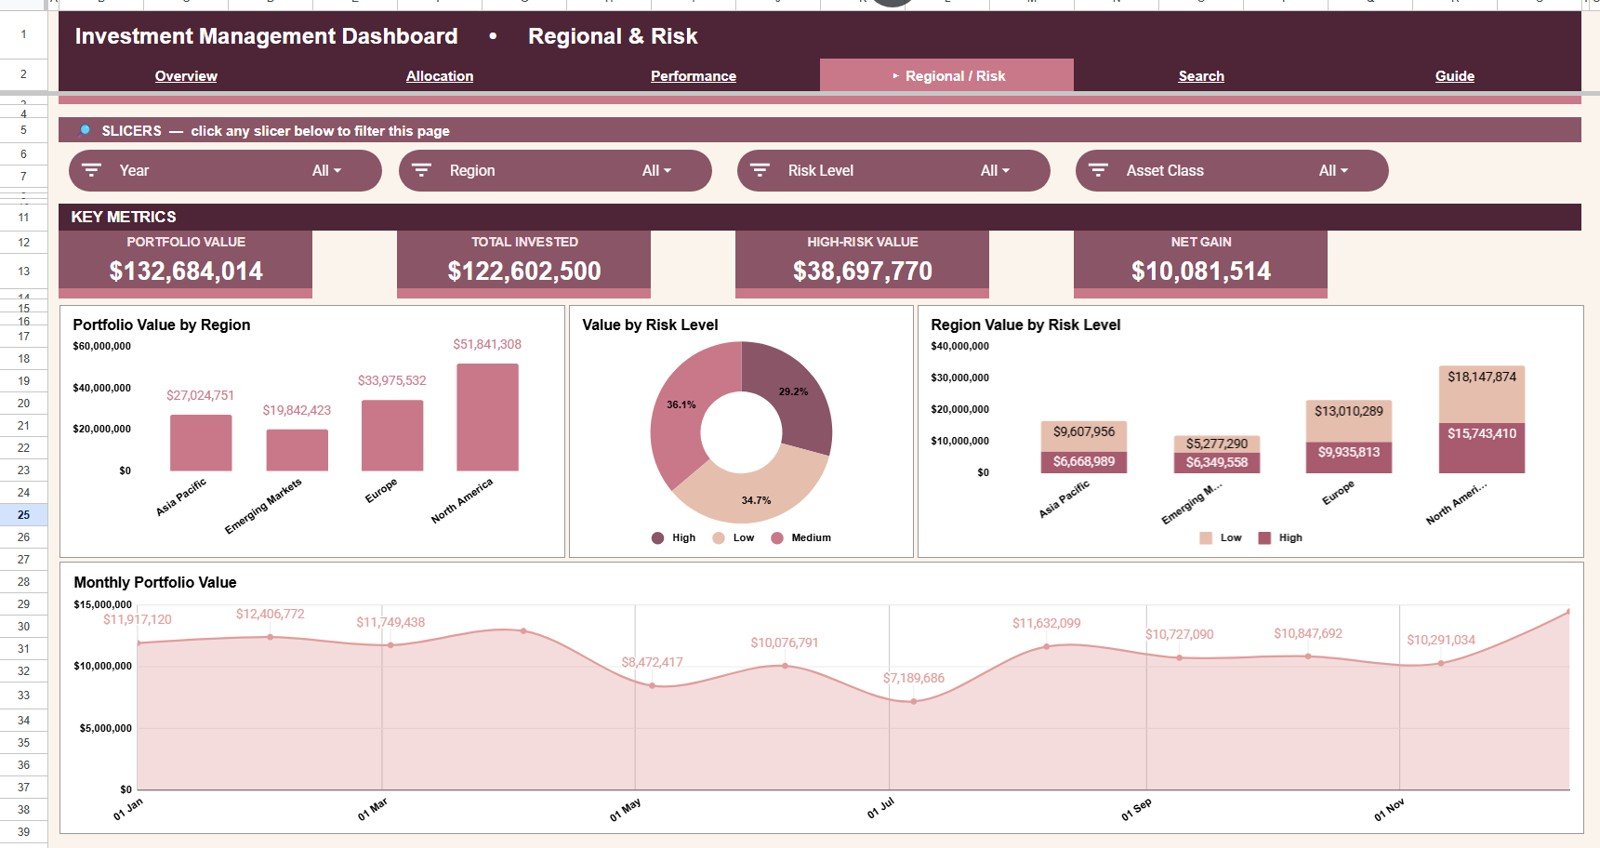
The Regional & Risk tab combines geography with risk level, which helps when a portfolio spans several regions, funds and risk profiles.
- Portfolio Value by Region: where the portfolio has the most geographic exposure.
- Value by Risk Level: the split between High, Medium and Low risk holdings.
- Region Value by Risk Level: whether certain regions carry more high-risk exposure.
- Monthly Portfolio Value: whether total value is trending up or down.
5. Search
The Search tab finds a specific holding without scrolling the data sheet. Select a Holding ID and it returns the Date, Asset Class, Sector, Region, Portfolio, Transaction Type, Invested Amount, Market Value, Gain / Loss, Units, Return % and Risk Level.
6. Data Sheet Tab
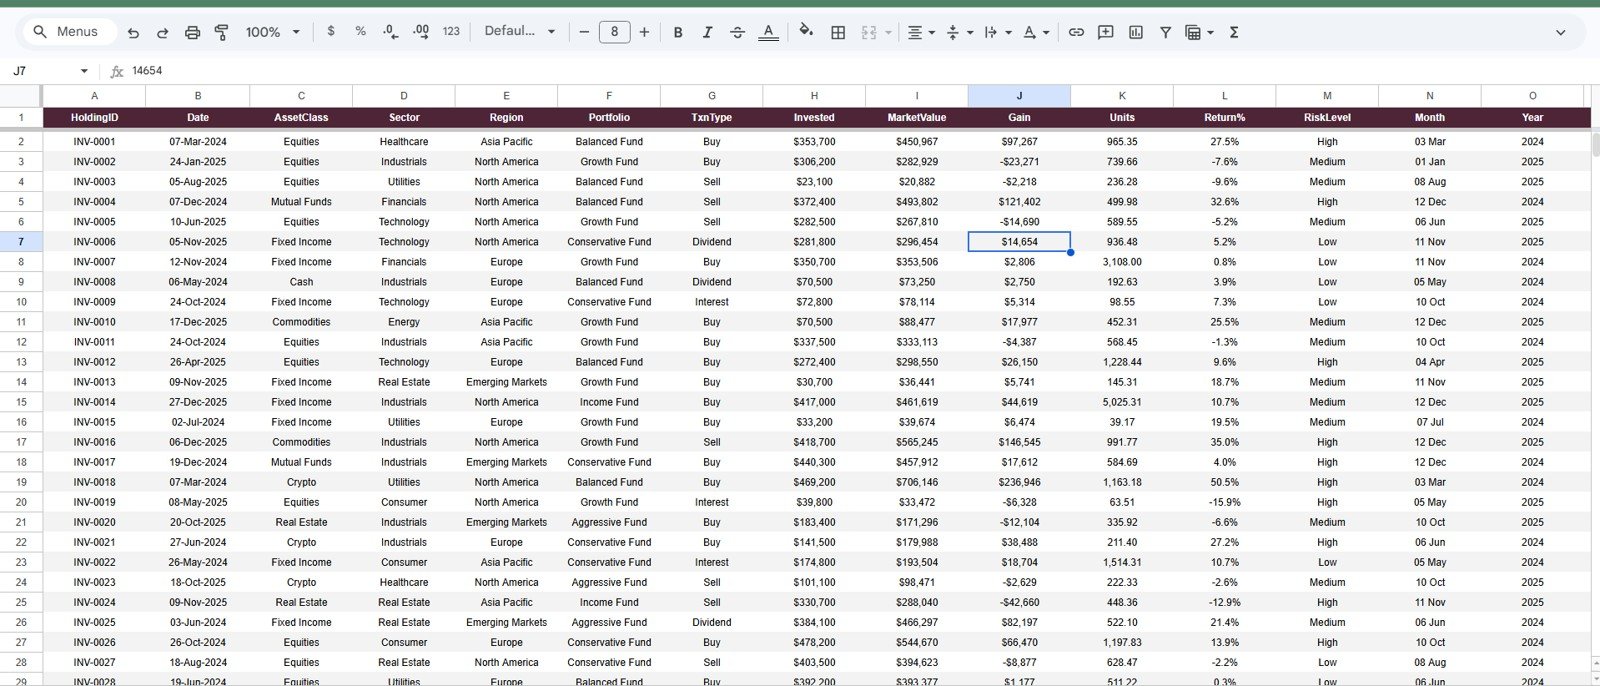
The Data Sheet tab stores investment records in the format the dashboard uses. Its columns are HoldingID, Date, AssetClass, Sector, Region, Portfolio, TxnType (such as Buy, Sell, Dividend or Interest), Invested, MarketValue, Gain, Units, Return%, RiskLevel, Month and Year.
Investment Management Dashboard in Google Sheets vs. Other Options
| Option | Best for | Limitations |
|---|---|---|
| Investment Management Dashboard in Google Sheets | Portfolio tracking, allocation review and reusable reporting in a familiar spreadsheet | You maintain the data sheet yourself |
| Basic Excel tracker | Simple personal tracking and one-off analysis | More manual chart setup, and sharing is less convenient |
| Paid portfolio software | Automated feeds, broker integrations and enterprise controls | Usually monthly fees and more complexity than lightweight reporting needs |
Who Should Use This Template?
- Individual investors who want a clean way to monitor asset class, region, sector and return
- Financial analysts who prepare recurring portfolio summaries for internal review
- Advisors who need a spreadsheet dashboard for client discussions
- Small businesses, family offices and finance teams managing several funds or holdings
- Students and educators who want a portfolio analytics example in Google Sheets
It is a reporting tool, not investment advice: it shows what is in your data and does not recommend what to buy or sell.
Real-World Use Cases
Use the dashboard for monthly investment reviews, quarterly portfolio check-ups, fund comparisons, allocation monitoring, regional exposure reviews and gain or loss tracking. It also suits small investment committee meetings where people need a quick visual summary instead of a long spreadsheet.
Advantages of the Investment Management Dashboard in Google Sheets
- Works directly in Google Sheets with nothing to install.
- Combines executive KPIs with detailed allocation and performance pages.
- Slicers make the dashboard easy to filter during live reviews.
- The Search tab adds a practical lookup for holding-level checks.
- The data tab keeps the template expandable as you add records.
Limitations to Know
The template is spreadsheet-based, so it does not connect to broker feeds or investment platforms. If you need live market prices, automatic dividend imports or tax-lot accounting, pair it with a data import workflow. For manual reporting, the structure is flexible and easy to maintain.
Best Practices for Using the Dashboard
- Keep the Data Sheet columns consistent and avoid renaming them unless you also update the linked charts.
- Check the slicers and charts after adding new monthly records.
- Keep a backup copy before making major structural changes.
- Share the file with the right permissions. Google’s guide to sharing files explains the view, comment and edit options.
- Review allocation and risk together, since a large position can also create concentration risk.
Related Templates and Guides
For KPI-style tracking, see the Investment Management KPI Dashboard in Google Sheets.
On NeoTech Navigators, you can also read about the Investment Management KPI Dashboard, the Stock Portfolio Tracker in Google Sheets, the Portfolio Performance KPI Dashboard and the Investment Portfolio Tracking System Web App if you prefer a browser app.
To build or customise dashboards like this one, the Excel Pivot Tables and Dashboards course on NextGenTemplates Academy covers pivots, slicers and charts step by step.
Frequently Asked Questions
Is this investment dashboard built in Google Sheets?
Yes. You can use it online, share it with collaborators and update the data sheet as needed.
Can I track multiple asset classes?
Yes. The sample data covers Cash, Commodities, Crypto, Equities, Fixed Income, Mutual Funds and Real Estate, and the dashboard analyses them by sector, region, risk level, fund and month.
How is Net Gain / Loss calculated?
Market value minus invested amount. In the sample data, $132,684,014 − $122,602,500 = $10,081,514.
Does the dashboard include performance charts?
Yes. The Performance tab shows average return by asset class, monthly average return, average return by sector and net gain by fund.
Can I search for a specific holding?
Yes. The Search tab has a Holding Lookup by Holding ID.
Does this template import brokerage data automatically?
No. You enter or paste your investment data into the data sheet. You can adapt it to your own import process.
About the Author
Built by PK, a Microsoft Certified Professional with 15+ years of Excel, Google Sheets and Power BI experience. He founded NextGenTemplates, and its YouTube channels reach 300K+ subscribers. Every template is built by hand and tested before release.
Wrapping Up
The Investment Management Dashboard in Google Sheets gives investors and finance users one place to review portfolio value, invested capital, gains, returns, allocation, regions, risk and individual holdings. Load your holdings into the Data Sheet, filter by asset class or risk level, and use the four analysis tabs to turn portfolio data into decisions faster.
Get the Investment Management Dashboard
📅 Last updated: October 2026