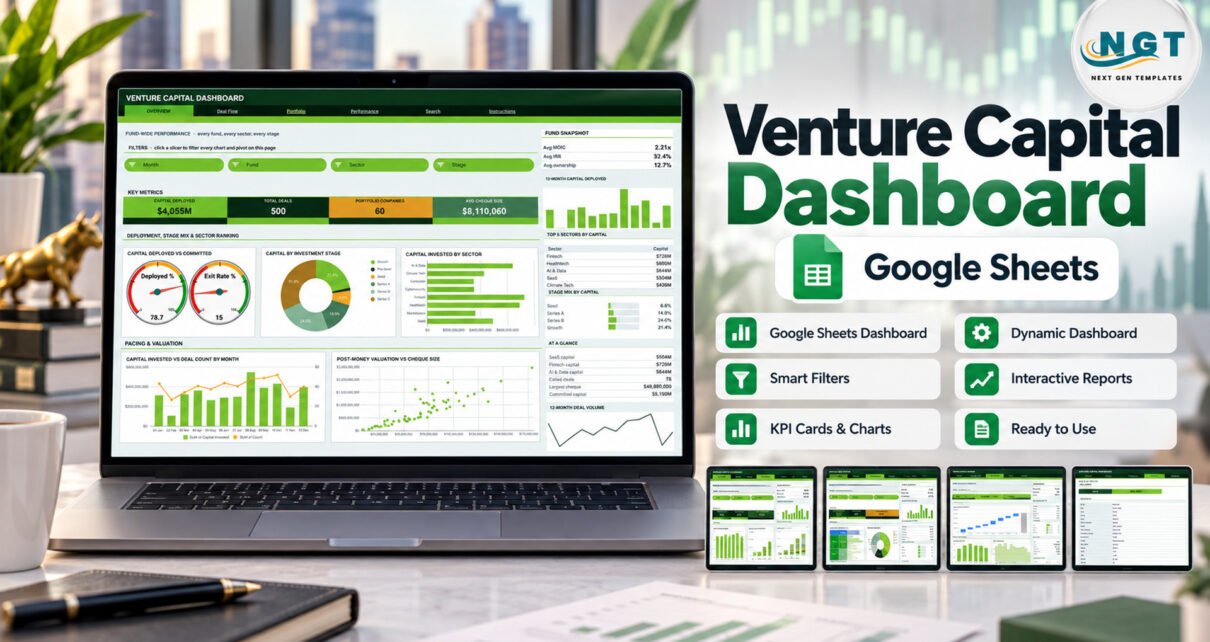
A six-page Venture Capital Dashboard in Google Sheets with 16 KPI cards, 18 chart panels and 15 slicers covering capital deployed, deal flow, portfolio composition, MOIC and IRR from a 1,000-row deal log.
Online Tutorial for Data Analysis and Automation
A six-page Venture Capital Dashboard in Google Sheets with 16 KPI cards, 18 chart panels and 15 slicers covering capital deployed, deal flow, portfolio composition, MOIC and IRR from a 1,000-row deal log.
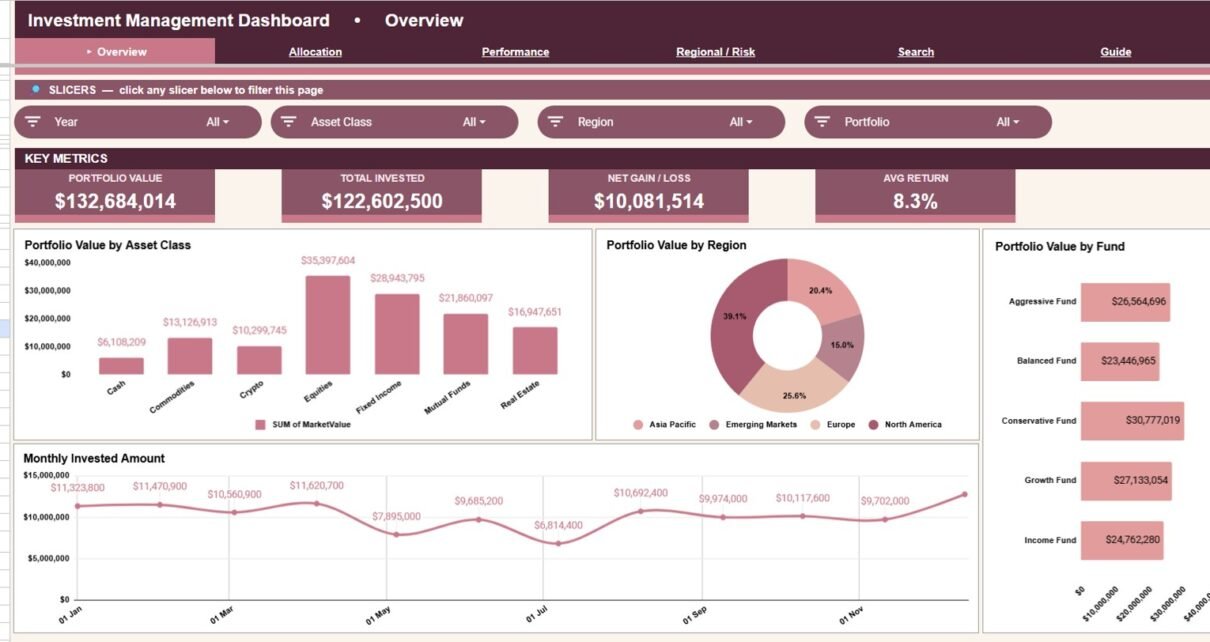
Track portfolio value, invested amount, net gain, returns, allocation, regions and risk in Google Sheets with KPI cards, slicers, 16 charts and a Holding ID lookup.
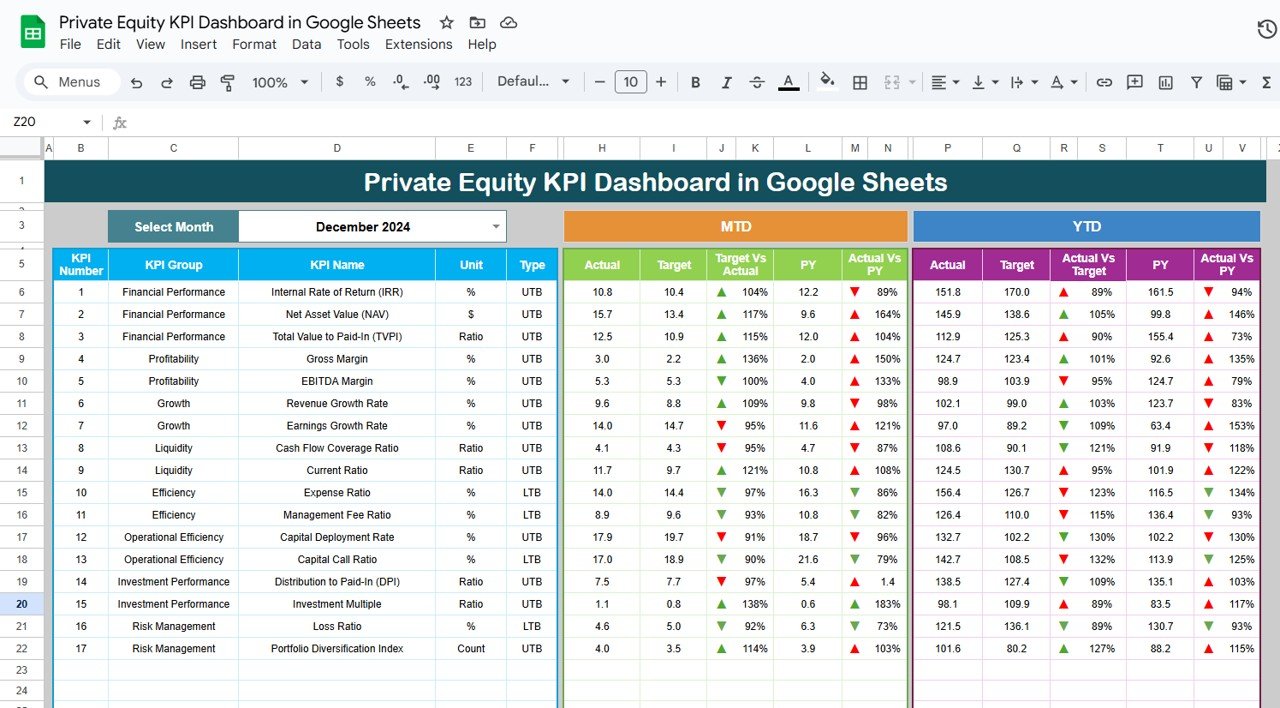
In private equity, tracking performance is critical to assess investments, returns, and operational efficiency. The Private Equity KPI Dashboard in Google Sheets is designed to provide an organized, real-time view of key performance indicators (KPIs), enabling private equity firms to make data-driven decisions. In this article, we will explore the Private Equity KPI Dashboard in […]