Recycling is a crucial aspect of sustainability, and tracking key performance indicators (KPIs) helps organizations improve their recycling efforts. The Recycling KPI Dashboard in Google Sheets is a ready-to-use template that enables organizations to monitor recycling performance, track key metrics, and ensure that recycling goals are met efficiently.
In this article, we will explore the Recycling KPI Dashboard in Google Sheets, its key features, and how it can help businesses and organizations optimize their recycling efforts.
Key Features of the Recycling KPI Dashboard in Google Sheets
Below are the key features of this KPI dashboard template:
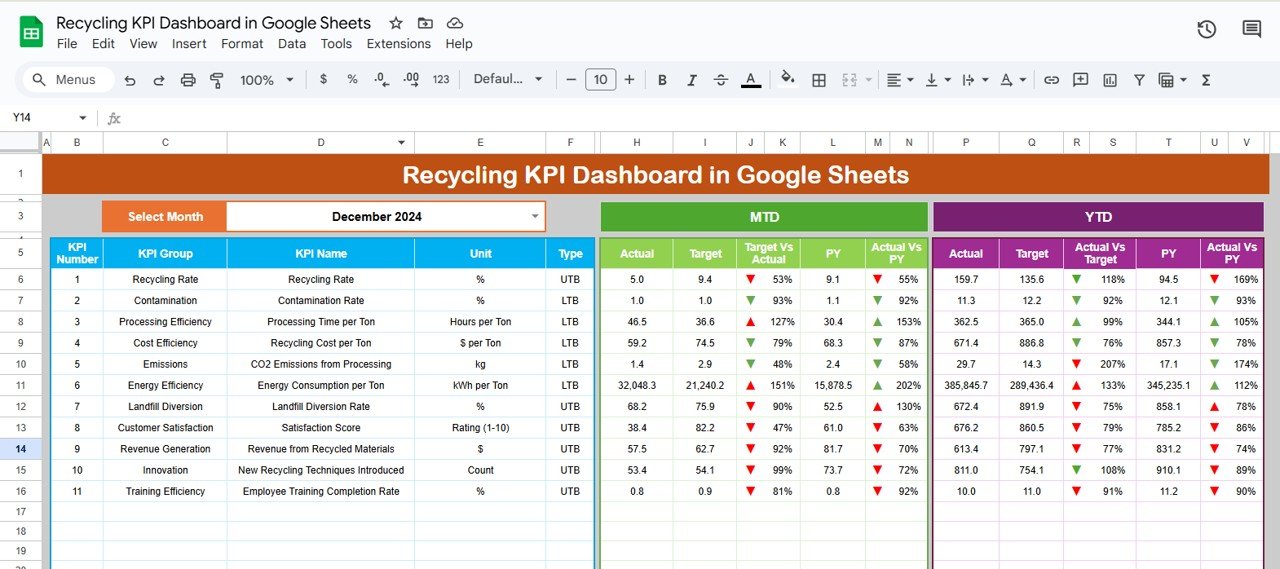
1. Dashboard Sheet Tab
This is the main sheet where all KPI data is displayed.
-
Month Selection: In Range D3, select the month from the drop-down menu, and the dashboard will update to show data for that month.
-
MTD (Month-to-Date): Displays actual numbers, target values, and comparisons with previous year data using conditional formatting (up or down arrows).
-
YTD (Year-to-Date): Shows cumulative performance with comparisons to target and previous year data.
Click to buy Recycling KPI Dashboard in Google Sheets
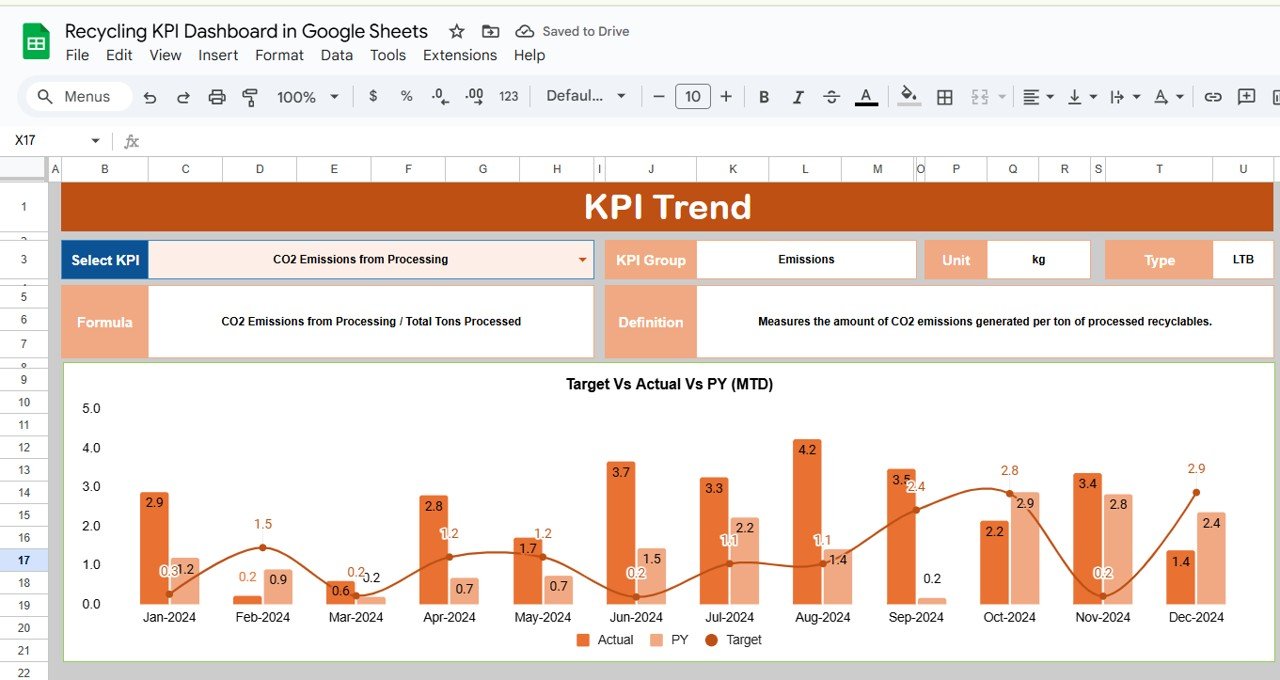
2. KPI Trend Sheet Tab
-
Select KPIs from the dropdown in Range C3.
-
Displays KPI group, unit of measure, type (Lower the Better or Upper the Better), formula, and KPI definition.
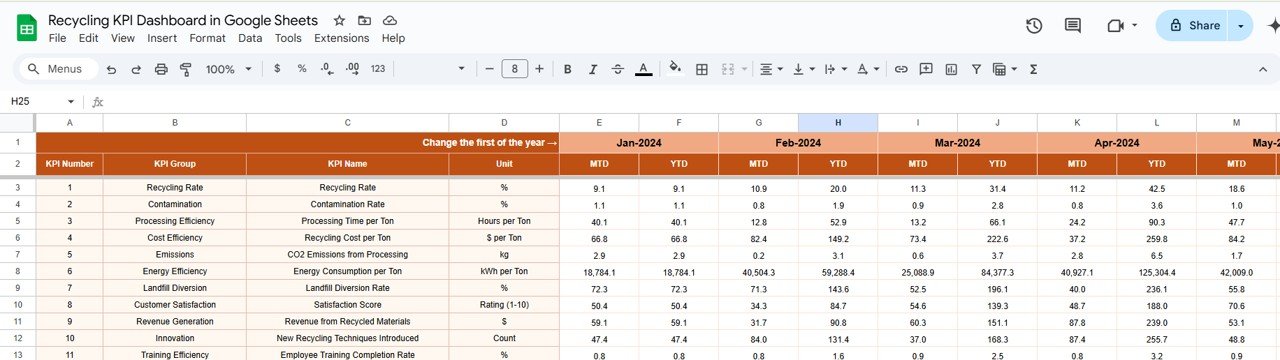
3. Actual Number Sheet Tab
-
Input actual numbers for MTD and YTD for the selected month.
-
The month selection is available in Range E1, where you input the first month of the year.
Click to buy Recycling KPI Dashboard in Google Sheets
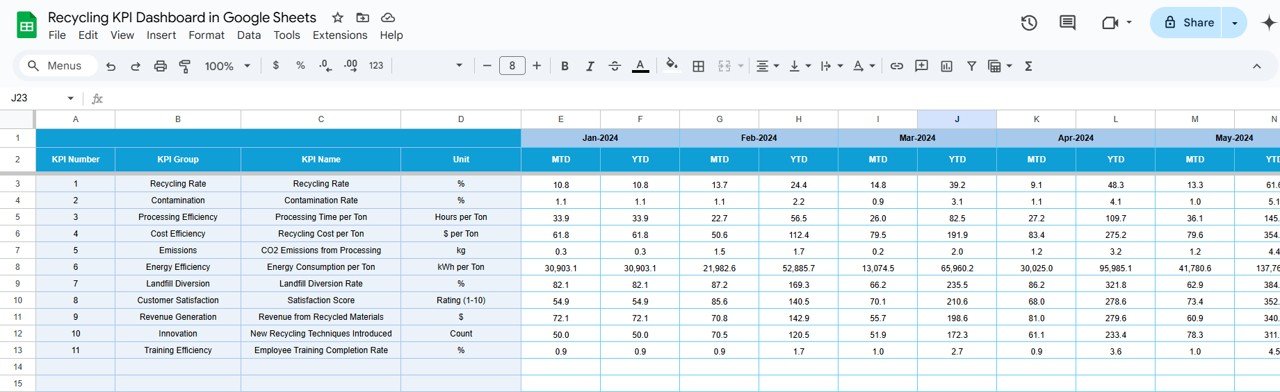
4. Target Sheet Tab
-
Enter target values for each KPI for MTD and YTD.
-
Helps track performance against set goals.
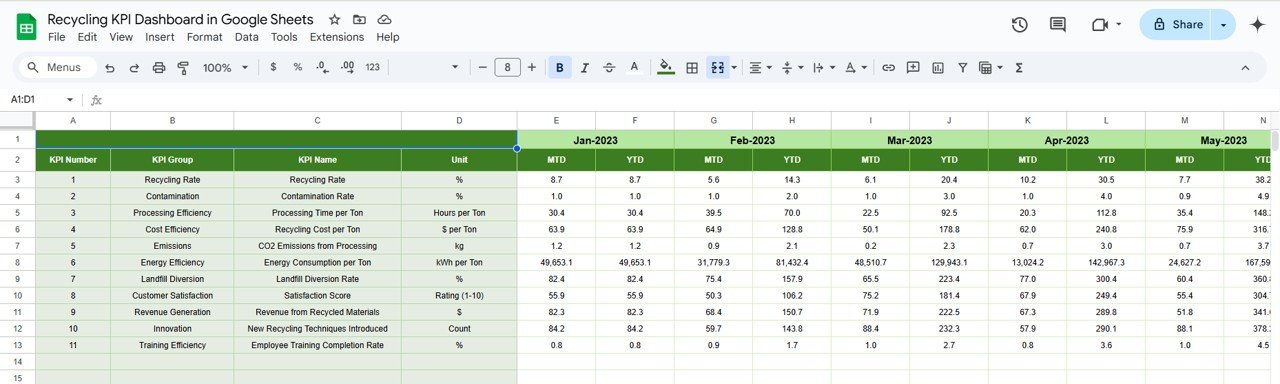
5. Previous Year Number Sheet Tab
-
Enter previous year’s data for year-over-year comparisons.
-
This data should be entered in the same format as the current year to maintain consistency.
Click to buy Recycling KPI Dashboard in Google Sheets
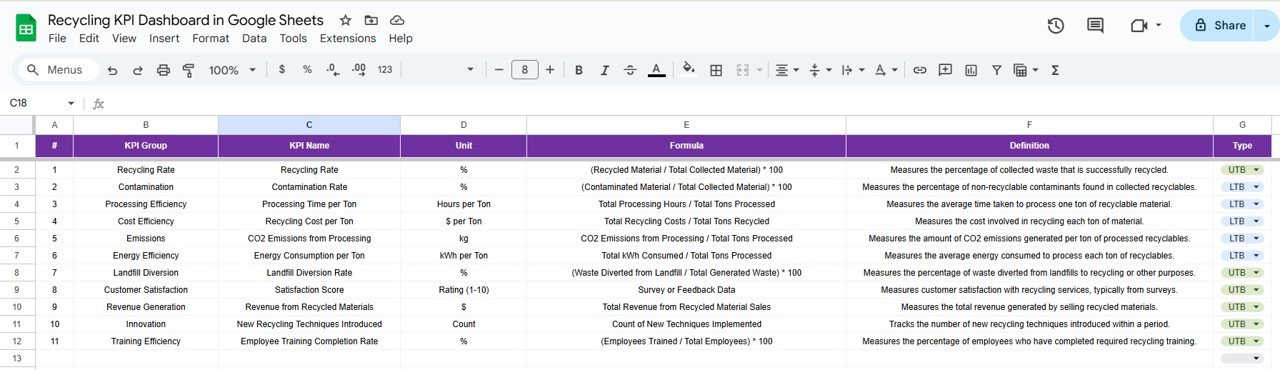
6. KPI Definition Sheet Tab
This sheet contains detailed information for each KPI, including:
- KPI Name
- KPI Group
- Unit of Measure
- Formula for KPI Calculation
- Definition of the KPI
Advantages of Using the Recycling KPI Dashboard in Google Sheets
The Recycling KPI Dashboard in Google Sheets offers several benefits:
-
Real-Time Monitoring: Track key recycling metrics in real-time, allowing you to make timely decisions and improvements.
-
Customizable Templates: Adjust the dashboard to track specific KPIs relevant to your recycling operations or sustainability goals.
-
Cost-Effective: Google Sheets is free and accessible, making it an affordable solution for businesses of all sizes.
-
Cloud-Based Collaboration: Share the dashboard with team members for seamless collaboration and data sharing.
-
Accessibility: The dashboard can be accessed from any device with internet connectivity, enabling easy monitoring from anywhere.
Opportunities for Improvement in the Recycling KPI Dashboard
Click to buy Recycling KPI Dashboard in Google Sheets
While the Recycling KPI Dashboard in Google Sheets is an effective tool, there are opportunities for improvement:
Automating Data Entry:
- Current Challenge: Manual data entry can be error-prone and time-consuming.
- Opportunity: Integrating the dashboard with other systems (e.g., waste management software) can automate data entry and reduce errors.
Advanced Visualizations:
- Current Challenge: Basic visualizations may not provide a comprehensive view of trends.
- Opportunity: Add advanced visualizations like heatmaps, bar charts, or pie charts to improve data interpretation.
Customizable Reporting:
- Current Challenge: Reporting capabilities are basic.
- Opportunity: Enhance reporting features by allowing users to generate detailed, customizable reports, such as PDF exports or automated email summaries.
Best Practices for Using the Recycling KPI Dashboard
Click to buy Recycling KPI Dashboard in Google Sheets
To get the most out of the Recycling KPI Dashboard in Google Sheets, consider these best practices:
-
Update Regularly: Ensure the data is updated frequently to monitor ongoing recycling activities and adjust as needed.
-
Set Realistic Targets: Use historical data and industry benchmarks to set achievable KPIs for recycling programs.
-
Review Trends Frequently: Regularly assess KPI trends to identify areas of improvement and implement changes for better recycling outcomes.
-
Collaborate Across Teams: Share the dashboard with your team for better coordination and collective action toward recycling goals.
-
Use Conditional Formatting: Leverage color coding or arrows to quickly identify areas that need immediate attention, such as low recycling rates or high contamination levels.
Conclusion
The Recycling KPI Dashboard in Google Sheets is a valuable tool for businesses and organizations looking to track and improve their recycling performance. By monitoring essential metrics like recycling rates, waste diversion, and carbon emissions, businesses can make informed decisions to improve sustainability and cost-efficiency in their recycling programs.
Frequently Asked Questions (FAQs)
What is a KPI in recycling?
A KPI (Key Performance Indicator) is a measurable value used to track and evaluate the success of recycling efforts. Common KPIs include recycling rate, energy saved, and waste diversion rate.
How do I customize my Recycling KPI Dashboard?
You can easily customize the dashboard by adding, removing, or adjusting KPIs, formulas, and data sources to match your recycling goals.
How do I enter data into the Recycling KPI Dashboard?
Simply input actual numbers for MTD and YTD in the relevant sheets (Actual Numbers Sheet, Target Sheet, Previous Year Numbers Sheet) for each month.
Can I automate data entry?
Yes, you can integrate the dashboard with external systems to automate data entry, making the process more efficient and less error-prone.
Which KPIs should I track in recycling?
Key KPIs for recycling include recycling rate, waste diversion, carbon emissions reduced, and recycling program participation rate.
Visit our YouTube channel to learn step-by-step video tutorials
Youtube.com/@NeotechNavigators
Watch the step-by-step video Demo: