Power BI is a data visualization and business intelligence tool created by Microsoft. It helps you connect to your data, analyze it, and build interactive reports and dashboards.What is Power BI
With Power BI, you don’t need to be a data expert. It gives you a simple and visual way to explore numbers, patterns, and performance insights. Whether you’re running a business, managing a team, or learning data skills, Power BI makes working with data easier.What is Power BI
Power BI is trusted by millions of users worldwide. It helps you make better decisions by showing your data in a clear, visual format.
Here are some reasons why Power BI is so popular:
Easy to use – No coding required. Just drag, drop, and build.
Wide range of visuals – Use charts, tables, maps, KPIs, and more.
Real-time updates – Your dashboards stay up to date automatically.
Cloud-based access – Share and access reports from anywhere.
Secure platform – Protects your data with enterprise-level security.
Snapshot Tip: Include an image of a simple Power BI dashboard with charts and cards to show visual power.
What Can You Do with Power BI?
Power BI is more than just charts. It helps you turn raw data into smart decisions.
Here’s what you can do with Power BI:
Track daily, weekly, or monthly sales.
Monitor employee performance and HR metrics.
Analyze marketing campaign results.
Manage and control business expenses.
Compare results year-over-year or month-over-month.
Connect different data sources like Excel, SQL, or Google Sheets.
Share reports with your team or clients.
You can do all this with just a few clicks. No complex formulas or code needed.What is Power BI
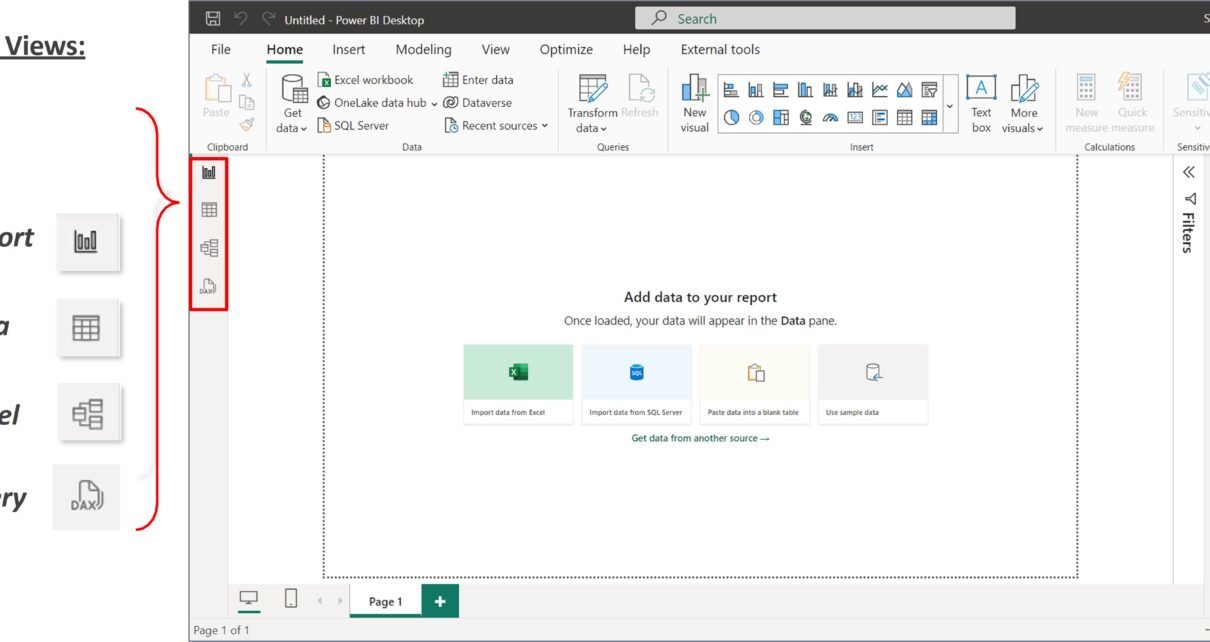
Key Parts of Power BI
Power BI is made up of several tools. Each one serves a different purpose.
You can use one or all parts depending on your needs.
What is Power BI
Power BI vs Excel – What’s the Difference?
Many people ask, “Is Power BI better than Excel?”
The answer depends on what you need. But for dashboards and large datasets, Power BI has the edge.
Excel is great for data entry and quick calculations. Power BI is better for automated reporting and professional dashboards.
Who Uses Power BI?
Power BI is used in every type of organization. From small businesses to large enterprises.
Some common users include:
Business owners
HR managers
Sales and marketing teams
Finance professionals
Operations and logistics staff
IT teams and data analysts
Even students and freelancers use it to build their portfolios.
It’s a tool that fits any industry and any role.
Summary
Power BI helps you turn data into dashboards. It gives you a better way to understand trends, performance, and numbers.
It’s easy to learn. It’s powerful to use. And it saves time by automating your reports.You don’t need to be a tech expert to use Power BI. You just need your data and a question you want answered.
What’s Next?
In the next topic, we’ll cover:
“Components of Power BI” – Learn more about each part of Power BI and how they work together.
Stay tuned and keep learning!
Visit ourYouTube channel to learn step-by-step video tutorials
Meet PK, the founder of NeotechNavigators.com! With over 15 years of experience in Data Visualization, Excel Automation, and dashboard creation. PK is a Microsoft Certified Professional who has a passion for all things in Excel. PK loves to explore new and innovative ways to use Excel and is always eager to share his knowledge with others. With an eye for detail and a commitment to excellence, PK has become a go-to expert in the world of Excel. Whether you're looking to create stunning visualizations or streamline your workflow with automation, PK has the skills and expertise to help you succeed. Join the many satisfied clients who have benefited from PK's services and see how he can take your data analysis skills to the next level!
Power BI is a fantastic tool for analyzing and visualizing data, and it’s flexible enough to support various data formats. One of the most widely used formats is JSON (JavaScript Object Notation). JSON is a lightweight and human-readable data format commonly used by web services and APIs to exchange data. In this guide, we’ll walk […]
When you’re working with large datasets, filtering becomes one of the most crucial tasks for narrowing down your focus to just the relevant data. Fortunately, Power Query in Power BI offers a variety of tools to filter rows based on specific criteria. This makes it easier to include only the necessary data in your reports, […]
Splitting columns is a common yet essential data transformation task in Power Query. When data is stored in a single column but should be separated into multiple columns, it can become difficult to manage and analyze. Whether you’re dealing with full names, addresses, or product information, splitting columns in Power Query makes your dataset easier […]