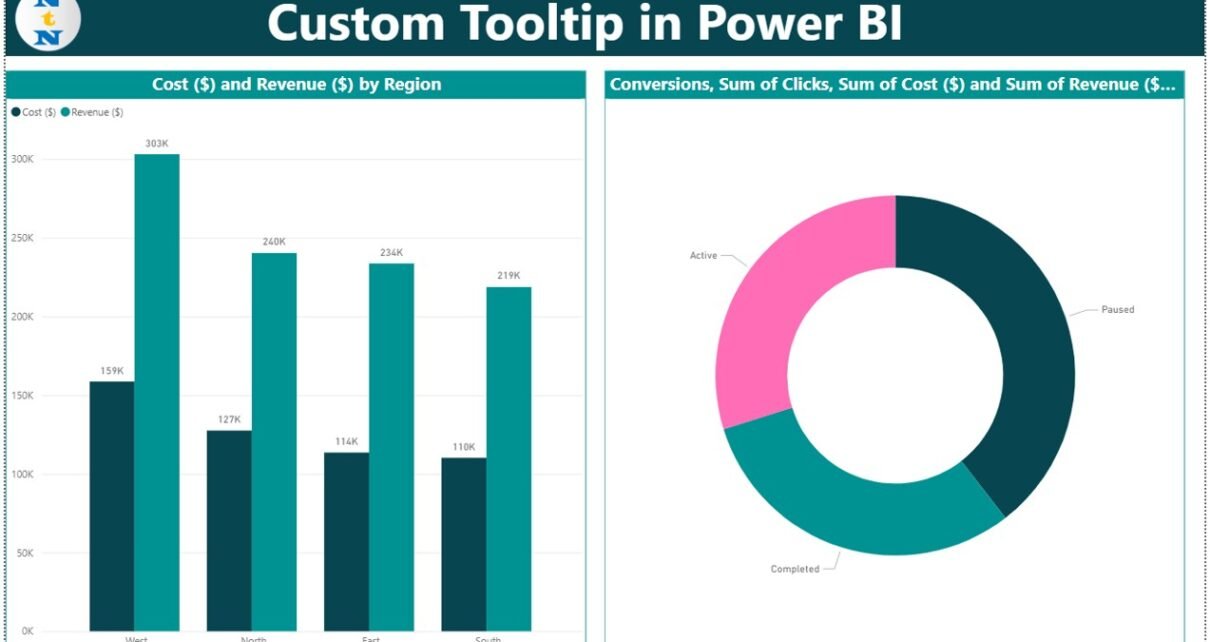
Tooltips in Power BI are more than just floating numbers. With custom tooltips, you can add meaningful visualizations that appear when a user hovers over any chart or graphic. This feature enables powerful storytelling without overwhelming your main report canvas.Custom Tooltip in Power BI In this blog post, we will explain what custom tooltips are, […]
Tag: Power BI Tutorial
What is Power BI? – A Beginner’s Guide
Power BI is a data visualization and business intelligence tool created by Microsoft. It helps you connect to your data, analyze it, and build interactive reports and dashboards.What is Power BI With Power BI, you don’t need to be a data expert. It gives you a simple and visual way to explore numbers, patterns, and […]
Field Parameters in Power BI with 3 easy examples
In the world of data visualization, Microsoft Power BI has revolutionized the way users interact with their data. One powerful is Field Parameters in Power BI, which allow users to create dynamic reports and dashboards by switching between different fields in their visuals. Whether you’re a beginner or an experienced Power BI user, mastering Field […]
Replacing Values in Power Query for Power BI
In the world of data transformation, replacing values is one of the most common and essential tasks. Whether you’re dealing with missing information, fixing errors, or just making your data more consistent, Power Query in Power BI gives you a variety of powerful tools to handle this. But why is replacing values so important? Let’s […]
Merging Columns in Power Query for Power BI
Merging columns is a powerful feature in Power Query that allows you to combine data from multiple columns into a single column. This is particularly useful when you want to create more readable data or when combining information like full names, addresses, or formatted strings. In this article, we’ll walk through the process of merging […]
Splitting Columns in Power Query
Splitting columns is a common yet essential data transformation task in Power Query. When data is stored in a single column but should be separated into multiple columns, it can become difficult to manage and analyze. Whether you’re dealing with full names, addresses, or product information, splitting columns in Power Query makes your dataset easier […]
Renaming Columns in Power Query for Power BI
Renaming columns is a simple yet essential step in data cleaning and preparation. When working with data in Power Query for Power BI, you often encounter columns with names that are unclear, inconsistent, or difficult to understand. Renaming Columns in Power Query to something more meaningful or standardized helps improve the readability of your data, […]
Changing Data Types in Power Query for Power BI
When it comes to analyzing data in Power BI, one of the most important aspects to consider is the data type. Changing Data Types in Power Query Data types directly influence how Power BI interprets and processes the information in your dataset. Ensuring that each column is correctly assigned a data type is crucial for […]
Filtering Rows in Power Query for Power BI
When you’re working with large datasets, filtering becomes one of the most crucial tasks for narrowing down your focus to just the relevant data. Fortunately, Power Query in Power BI offers a variety of tools to filter rows based on specific criteria. This makes it easier to include only the necessary data in your reports, […]
Removing Blank or Duplicate Rows in Power Query
Data inconsistencies, such as blank or duplicate rows, can significantly affect the accuracy of your analysis in Power BI. Power Query in Power BI offers simple yet powerful tools for identifying and removing these unwanted rows. In this article, we’ll cover how to efficiently remove blank and duplicate rows, ensuring that your data is clean, […]


