Defense and Military Dashboard in Google Sheets is a ready-to-use reporting template with 7 sheet tabs, 9 high-level KPI cards, 25 dashboard charts, multiple slicers, a Search sheet, and a structured Data sheet. It helps teams review approved, non-sensitive records for budget allocation, actual spend, command activity, branch performance, facility workload, personnel involvement, operation status, priority, officer ownership, and readiness score in one browser-based file.Defense and Military Dashboard in Google Sheets
Instead of building a dashboard from scratch, users can replace the sample records, keep the same column structure, and immediately review operational trends. The template is especially useful when a team wants a shareable Google Sheets dashboard without paying recurring software fees or creating a custom BI project.
Key Features of Defense and Military Dashboard in Google Sheets
- 7 sheet tabs: Overview, Branch Performance, Operations Center, Budget and Spend, Force Readiness, Search, and Data.
- 9 KPI cards: Budget Allocated, Total Operations, Personnel Involved, Avg Readiness, Mission Status, Budget Spent, Remaining, Active Ops, and On Hold.
- 25 analytical charts: Track budget, spend, branch performance, operation type, command, facility, priority, officer, personnel, and readiness.
- Slicer-based filtering: Narrow the dashboard quickly during reviews without editing formulas.Defense and Military Dashboard in Google Sheets
- Record ID lookup: Use the Search sheet to inspect one full operation record instantly.
- Editable source data: Add new records in the same format on the Data sheet.
- Google Sheets collaboration: Share the file with approved users through Google Drive permissions.Defense and Military Dashboard in Google Sheets
Defense and Military Dashboard in Google Sheets.
Dashboard Pages Explanation
1. Overview Page
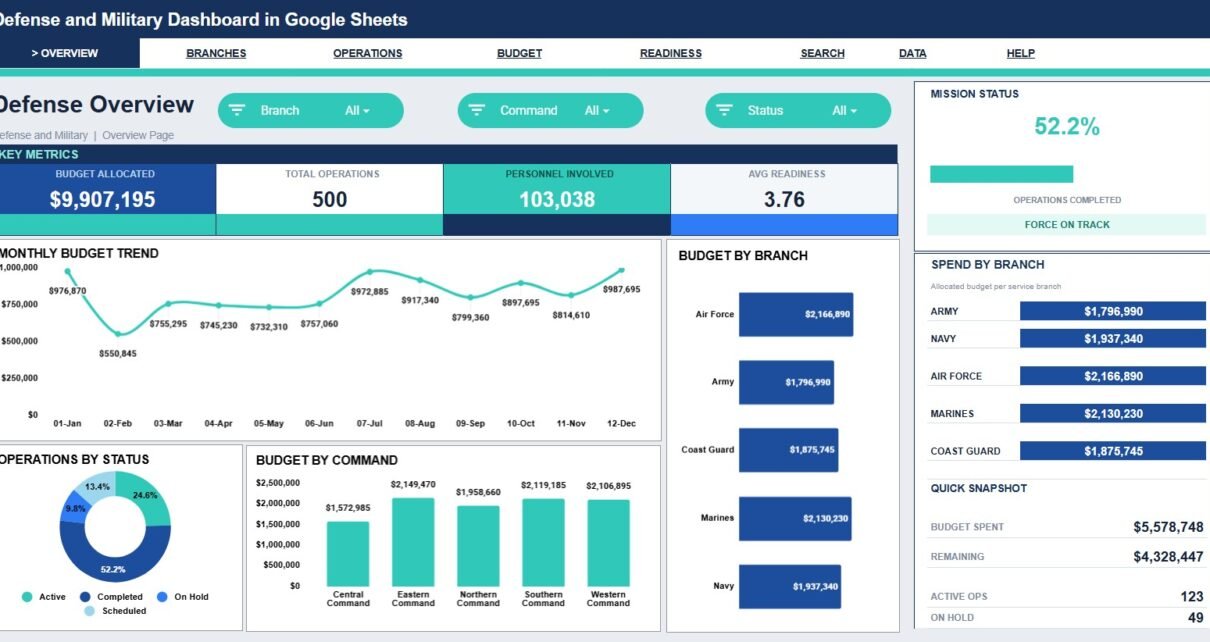
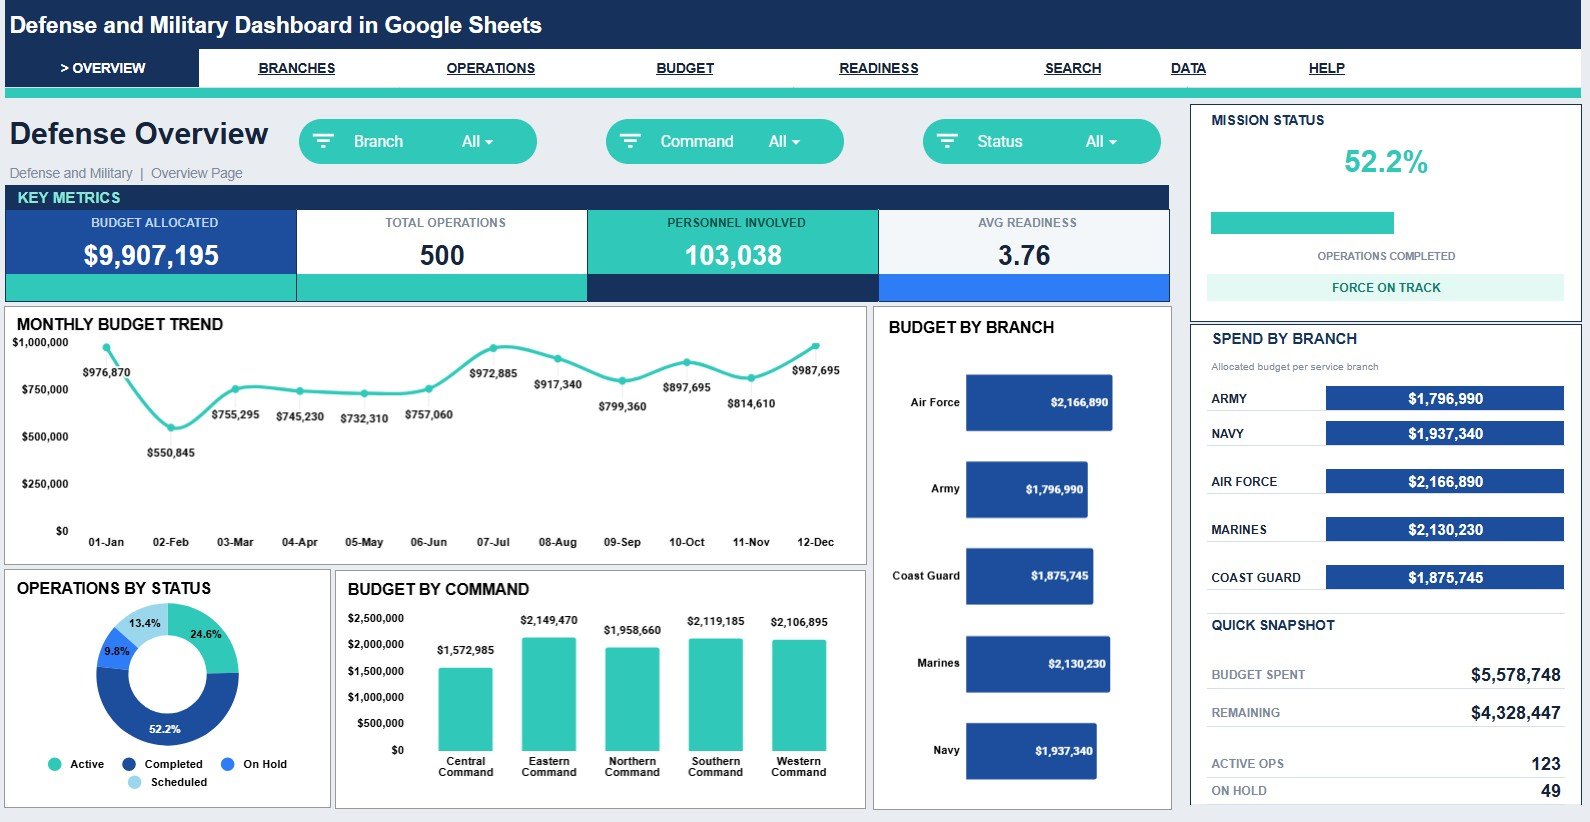
The Overview page is the command-level summary sheet. It starts with cards for Budget Allocated, Total Operations, Personnel Involved, Avg Readiness, Mission Status, Budget Spent, Remaining, Active Ops, and On Hold.
Monthly Budget by Month: This chart shows how allocated budget is distributed across months. It helps users spot months with higher funding needs or unusual allocation pressure.
Operations by Status: This chart splits operations by status, such as active, on hold, or completed. It helps leadership understand how much work is moving, delayed, or closed.
Budget by Command: This chart compares budget allocation across command groups. It helps budget owners see which commands carry the largest planned resource load.
Budget by Branch: This chart shows budget distribution across branches. It supports branch-level resource comparison during leadership reviews.
Spend by Branch: This chart compares actual spending by branch. It helps teams see which branches are using the most budget and where review may be needed.
2. Branch Performance
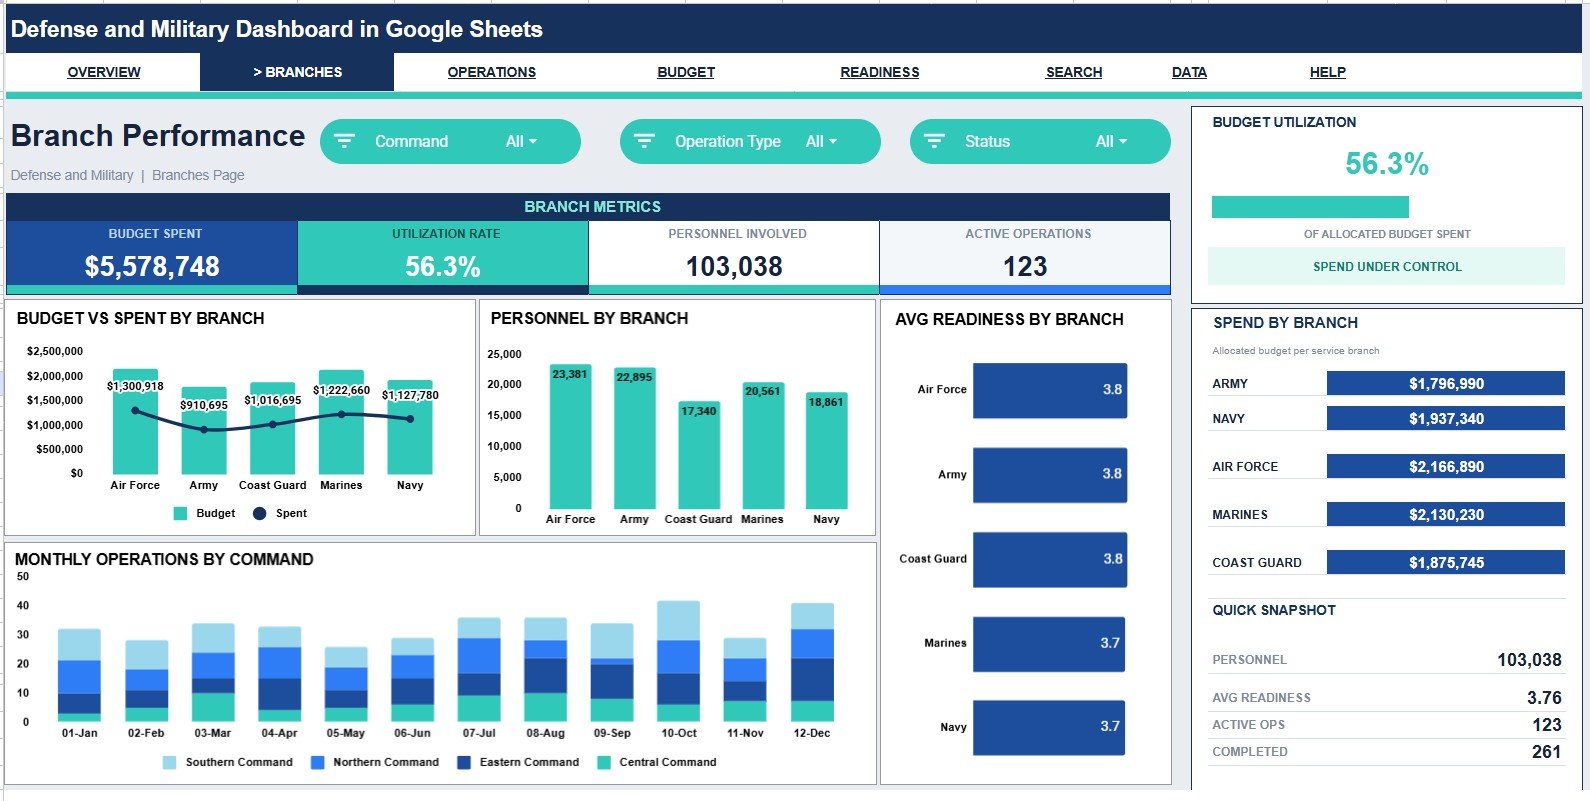
The Branch Performance page focuses on branch-level comparison. It is useful for reviewing budget, spend, personnel, readiness, command activity, and operating balance across branches.
Budget vs Spent by Branch: This chart compares planned budget with actual spend by branch. It helps identify overspending, underspending, or branches that are tracking close to plan.Defense and Military Dashboard in Google Sheets
Personnel by Branch: This chart shows personnel involvement by branch. It helps check whether manpower levels match operational load.Defense and Military Dashboard in Google Sheets
Avg Readiness by Branch: This chart compares readiness score by branch. It helps users identify branches that may need support, training, or closer review.Defense and Military Dashboard in Google Sheets
Monthly Operations by Command: This chart tracks operation volume by command over time. It helps reveal command-level trend changes and busy periods.
Spend by Branch: This chart repeats branch spend in the branch-focused context. It helps compare financial use with readiness and personnel patterns.
3. Operations Center
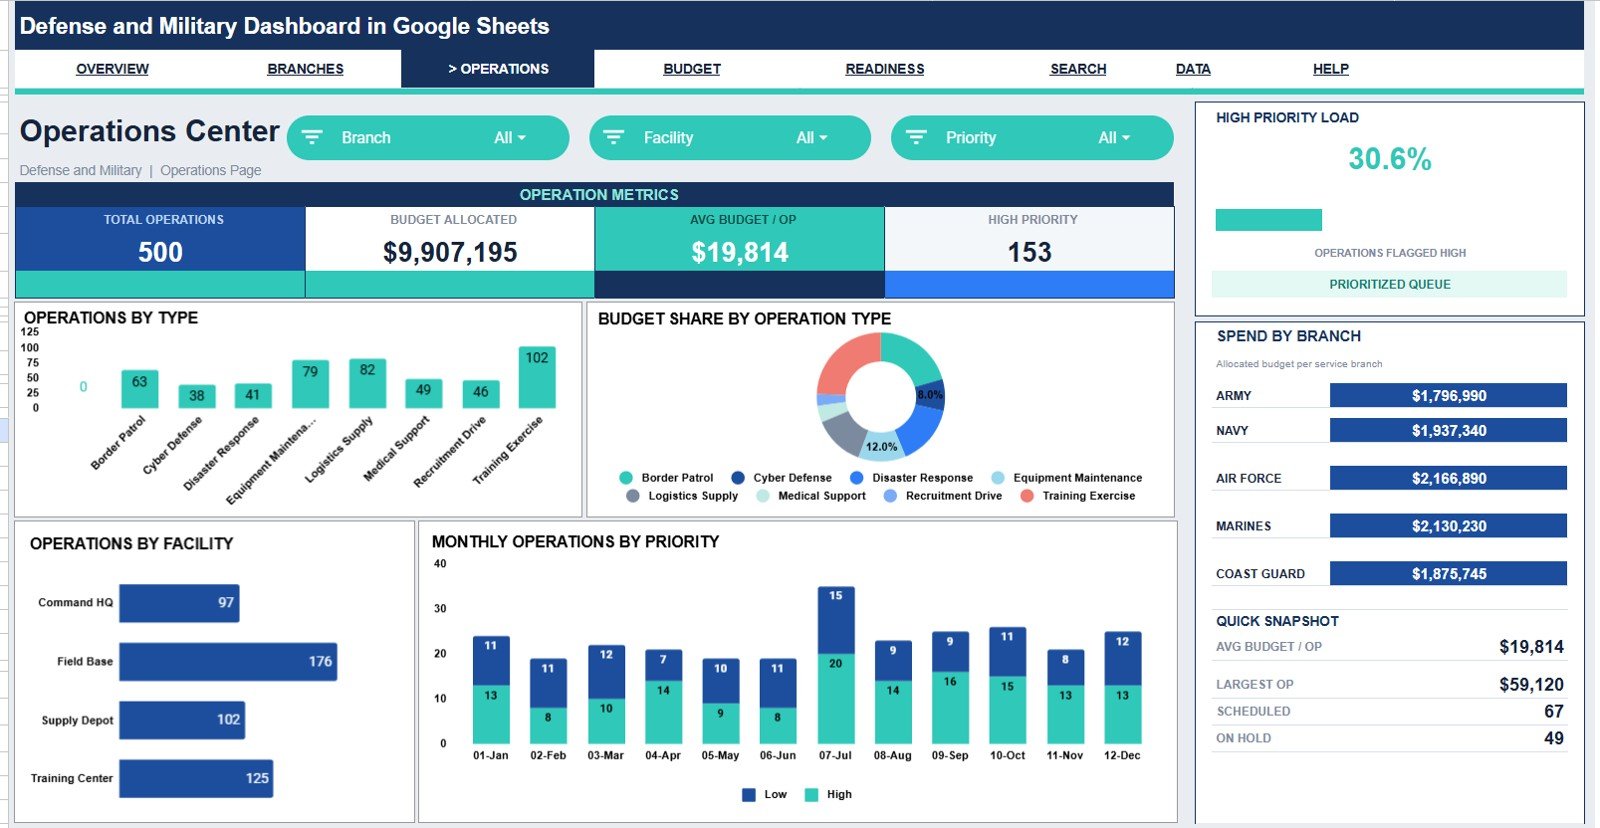
The Operations Center page explains operational mix, facility workload, priority movement, and operation type budget share. It is the best page for seeing how operations are distributed and where activity is concentrated.
Operations by Operation Type: This chart counts records by operation type. It helps users understand whether activity is concentrated in training, logistics, support, response, or other operation groups.
Budget Share by Operation Type: This chart shows how budget is split by operation type. It helps determine which types of operations consume the largest portion of funding.
Operations by Facility: This chart compares activity by facility. It helps facility managers understand workload distribution and potential capacity pressure.
Monthly Operations by Priority: This chart tracks priority-level operations month by month. It helps teams see whether high-priority activity is increasing or decreasing.
Spend by Branch: This chart adds branch spend to the operations view. It connects operational activity with branch-level financial usage.
4. Budget and Spend
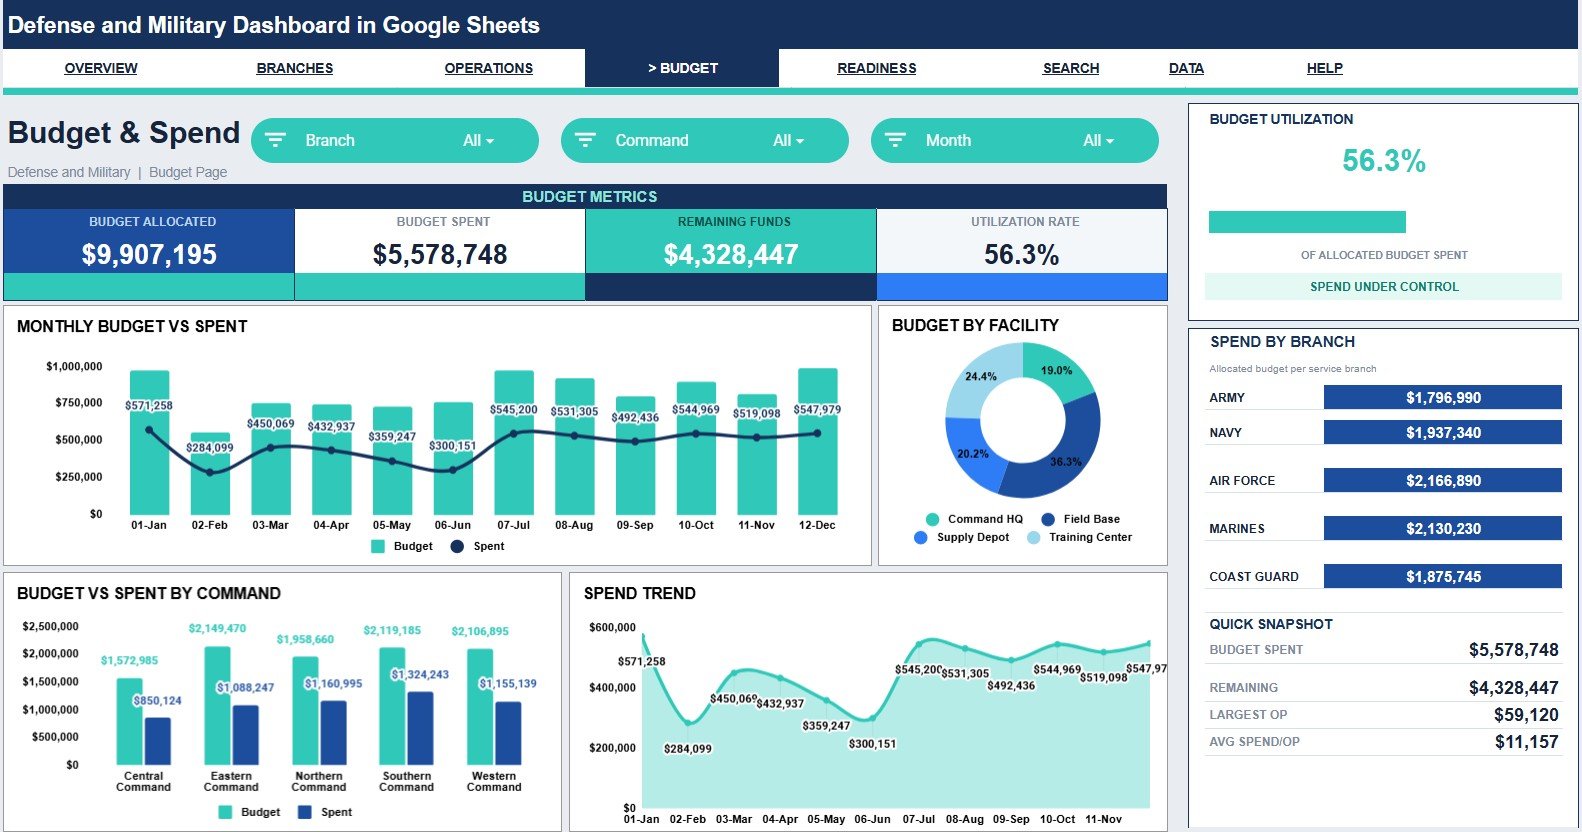
The Budget and Spend page gives finance and operations teams a focused view of allocation, actual spend, facility budget, command budget, and monthly spending patterns.
Budget vs Spent by Month: This chart compares monthly budget allocation with actual spend. It helps identify budget burn rate and possible overspend risk.
Budget by Facility: This chart shows planned funding by facility. It helps teams compare facility-level resource concentration.
Budget vs Spent by Command: This chart compares planned and actual numbers by command. It helps command owners review financial variance quickly.
Spend by Month: This chart shows how actual spending changes over time. It helps explain cost peaks, reporting-cycle movement, and monthly utilization.
Spend by Branch: This chart compares actual spend across branches. It helps teams review which branches are using the most funds during the selected period.
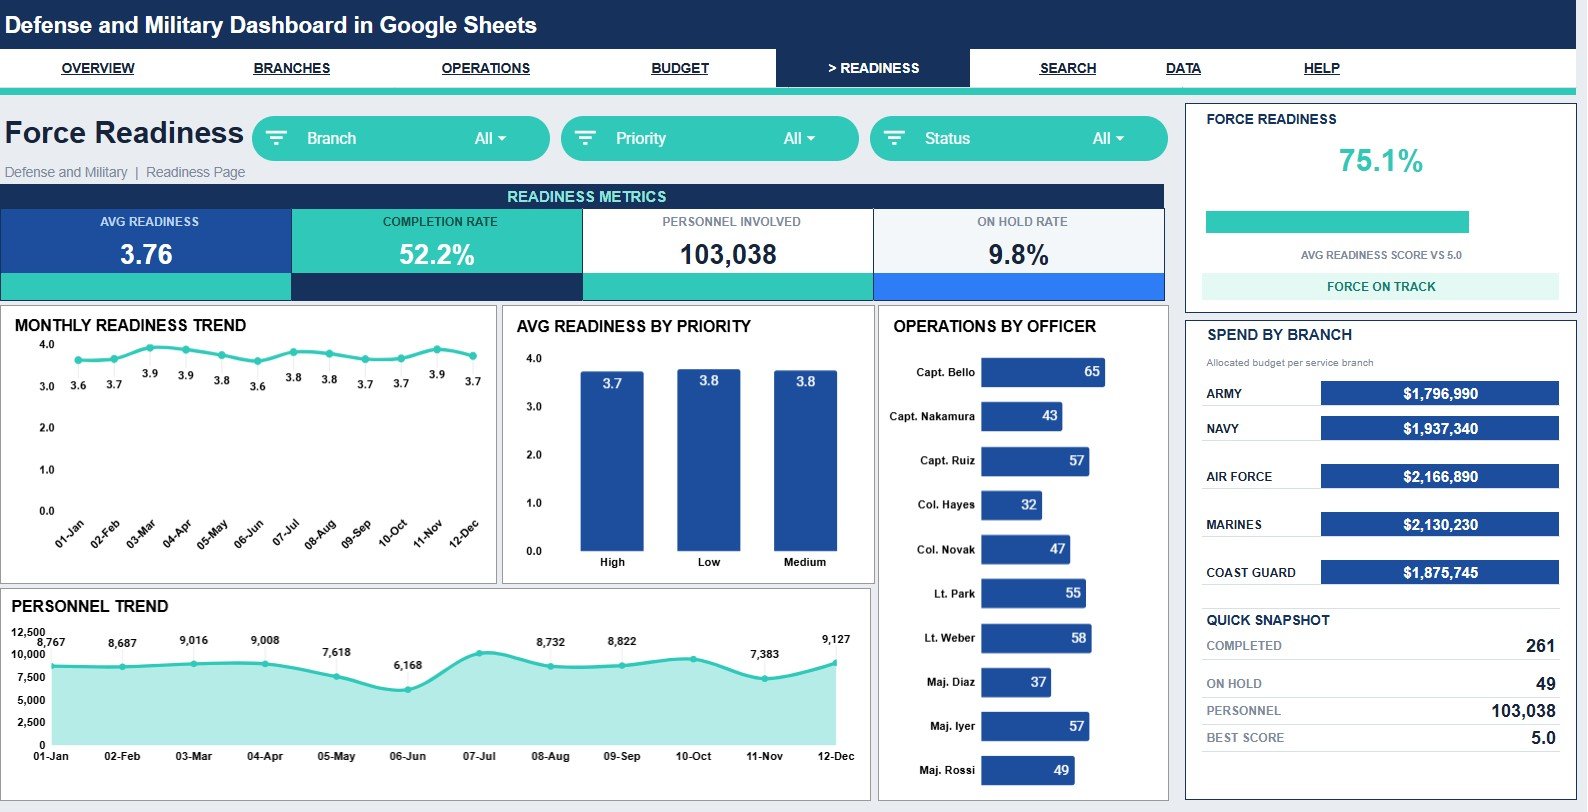
5. Force Readiness
The Force Readiness page connects readiness score with month, priority, officer workload, personnel trends, and branch spending. It is useful for preparedness, planning, and resource review discussions.
Avg Readiness by Month: This chart shows readiness movement across months. It helps users see whether readiness is improving, declining, or stable.
Avg Readiness by Priority: This chart compares readiness across priority levels. It helps confirm whether high-priority records have readiness levels that match their importance.
Operations by Officer: This chart counts operations by assigned officer. It helps identify workload distribution and ownership patterns.
Personnel by Month: This chart tracks personnel involvement over time. It helps teams understand manpower demand by month.
Spend by Branch: This chart connects spending to readiness analysis. It helps compare resource usage with readiness outcomes by branch.
6. Search Sheet Tab
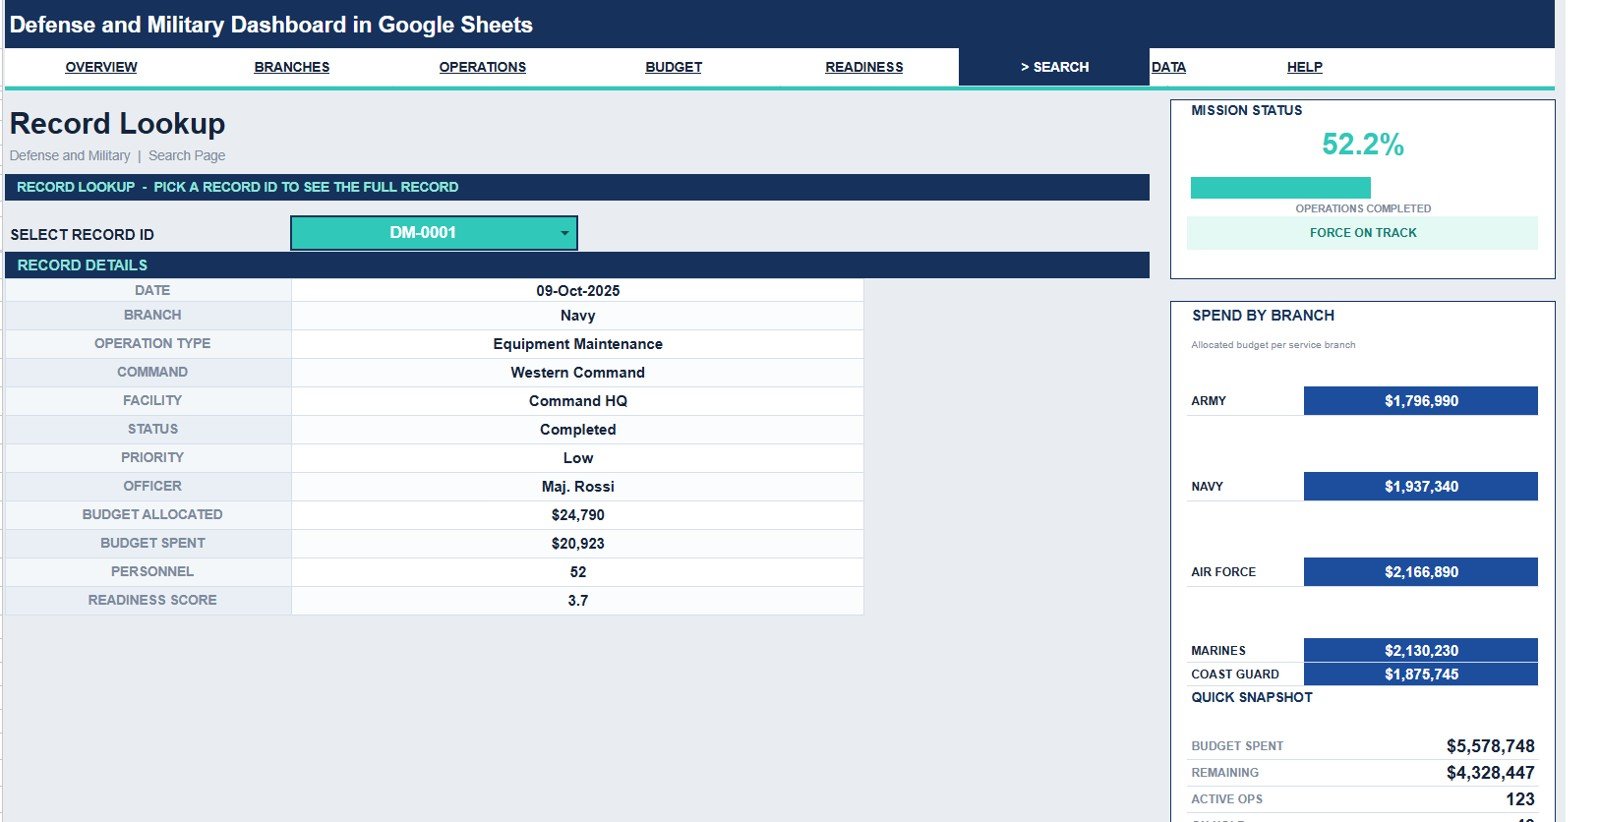
The Search sheet lets users select a Record ID and view the full operation record details. It shows date, branch, operation type, command, facility, status, priority, officer, budget allocated, budget spent, personnel, and readiness score.
This is useful when a chart highlights a problem and the reviewer needs to inspect one record without scrolling through the Data sheet.
Search Sheet tab
7. Data Sheet Tab
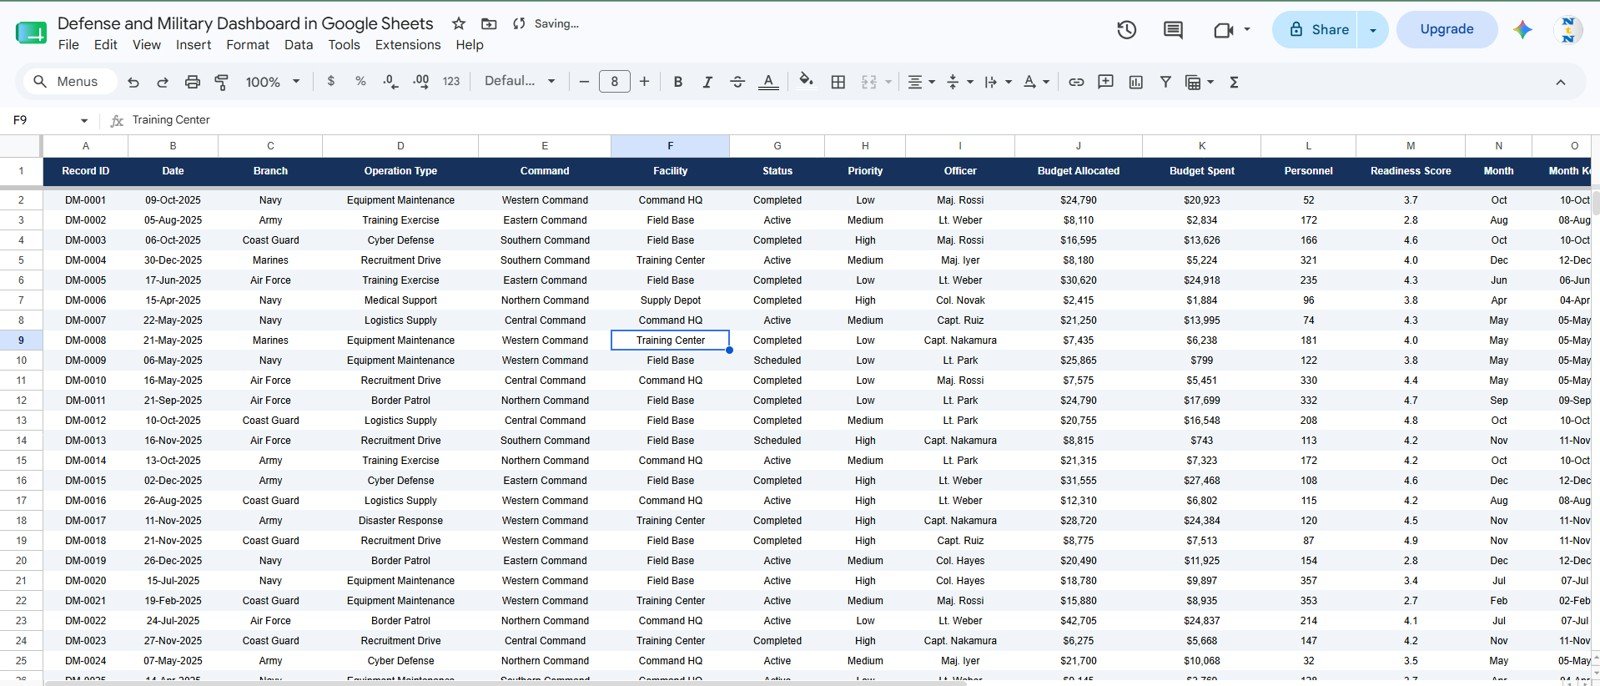
The Data sheet stores the source records for the dashboard. Users should add data in the same format so the cards, charts, slicers, and Search sheet continue to update correctly.
The expected record structure includes date, branch, operation type, command, facility, status, priority, officer, budget allocated, budget spent, personnel, and readiness score.
Defense and Military Dashboard in Google Sheets vs. Microsoft Excel Dashboard vs. Paid SaaS – Feature Comparison
| Feature | This Google Sheets Template | Microsoft Excel Dashboard | Paid SaaS or Custom BI |
|---|---|---|---|
| Cost | $9.99 sale price, one time | Template cost plus Excel license | Recurring subscription or implementation cost |
| Platform | Google Sheets in browser | Desktop or web Excel | Vendor cloud or internal BI stack |
| Setup time | Copy the template and replace records | Open workbook and refresh | Depends on data integration and vendor setup |
| Real-time team collaboration | Native Drive sharing | Microsoft 365 dependent | Usually available by paid seat |
| Mobile access | Google Sheets app or browser | Excel app or browser | Plan dependent |
| Customizable fields | Editable sheet structure | Editable workbook structure | Limited by permissions, plan, or vendor setup |
| Share with link | Yes, through Drive permissions | Yes, through OneDrive or SharePoint | Usually available |
| Record lookup | Built-in Search sheet | Possible with formulas | Usually available if configured |
| Year-1 cost at 5 users | $9.99, excluding Google Workspace | License dependent | Usually much higher |
Who Should Use This Template
This template is best for defense administration teams, operations analysts, readiness coordinators, budget owners, facility managers, public-sector reporting teams, and consultants who need a structured spreadsheet dashboard for approved operational data.
It is not built for classified information, live tactical command, secure field communications, weapons systems, real-time dispatch, or regulated defense systems that require certified hosting and audit controls.
Real-World Use Cases
Asha, operations analyst: Asha uses the Overview and Operations Center pages before weekly leadership reviews. She checks operation status, facility activity, priority movement, and command-level budget distribution.
Daniel, budget coordinator: Daniel uses the Budget and Spend page to compare planned funding against actual spend. He reviews monthly, facility, branch, and command-level variances before budget meetings.
Meera, readiness lead: Meera uses the Force Readiness page to track readiness trends and personnel demand. When a readiness score needs explanation, she opens the Search sheet and reviews the complete record.
Advantages of Defense and Military Dashboard in Google Sheets
- Fast setup: Replace the sample rows instead of designing a dashboard from zero.
- Shareable format: Google Sheets makes collaboration simple for approved users.
- Multiple analysis angles: Budget, branch, operation type, command, facility, priority, officer, personnel, and readiness are covered together.
- Searchable record details: The Search sheet helps users move from visual summary to row-level detail.
- One-time price: The template avoids recurring subscription and per-user dashboard fees.
Opportunities for Improvement
This template is intentionally spreadsheet-based, so it does not replace secure defense platforms, workflow systems, classified-data environments, role-based approval tools, or live integrations. Teams that need automated feeds, row-level access controls, immutable audit trails, or system-to-system synchronization should treat this as a reporting layer, not the system of record.
The best improvement path is to start with the included fields, then add internal columns only after confirming which fields are needed for routine reviews.
Best Practices
- Use only approved, non-sensitive records in Google Sheets.
- Keep the Data sheet column structure consistent so charts and lookups continue working.
- Use slicers during review meetings to narrow results by branch, command, facility, status, or priority.
- Validate budget fields before leadership reporting, especially if data is copied from multiple sources.
- Share the sheet through Google Drive permissions and review access regularly.
- For slicer basics, see Google Support’s guide to filtering charts and tables with slicers.
Explore Relevant Templates
You can get the product here: Defense and Military Dashboard in Google Sheets.
Related templates include the Defense and Military Dashboard in Power BI, Defense Equipment Manufacturing Dashboard in Excel, Defense Equipment Manufacturing Dashboard in Power BI, Compliance and Audit Dashboard in Google Sheets, Audit Operations Management Dashboard in Google Sheets, and Contract Manufacturing Dashboard in Google Sheets.
Browse more Google Sheets templates and Google Sheets dashboard templates.
Frequently Asked Questions
What is included in the Defense and Military Dashboard in Google Sheets?
It includes seven tabs, nine overview cards, 25 charts, multiple slicers, a Search sheet, and a Data sheet for approved operational records.
What fields does the Search sheet show?
The Search sheet shows date, branch, operation type, command, facility, status, priority, officer, budget allocated, budget spent, personnel, and readiness score for the selected Record ID.
Can I edit the template?
Yes. It is an editable Google Sheets file, so you can adjust labels, data, formulas, charts, and formatting for your internal reporting process.
Does it work for team collaboration?
Yes. You can share the copied Google Sheets file with approved users through Google Drive permissions and collaborate in real time.
Is this dashboard suitable for classified information?
No. It should only be used with approved, non-sensitive, structured reporting records. Do not use it for classified, restricted, or controlled defense information.
Do I need a paid dashboard tool?
No. The dashboard runs in Google Sheets. A paid SaaS tool may be needed only if your team requires secure integrations, workflow automation, certified hosting, or advanced permissions.
About the Author
Built by PK – Microsoft Certified Professional with 15+ years of Excel, Google Sheets, and Power BI experience. Founder of NextGenTemplates, reaching 300K+ subscribers across YouTube channels. Every template is hand-built and tested before release.
Conclusion
Defense and Military Dashboard in Google Sheets.
The Defense and Military Dashboard in Google Sheets gives teams a practical way to review approved operations, budget, branch performance, facility activity, personnel, and readiness in one editable file. It is easy to share, simple to update, and built around the dashboard pages that decision-makers naturally ask for during reviews.
For more Google Sheets, dashboard, and automation tutorials, visit YouTube.com/@NeoTechNavigators.