Dental Practice Dashboard in HTML is a comprehensive, browser-based analytics solution built for dental clinics, multi-location dental chains, and healthcare administrators who want instant visibility into patient flow, revenue performance, treatment outcomes, dentist productivity, and insurance analytics — all without installing any software. This interactive HTML Dashboard Template from NextGenTemplates delivers 5 professionally designed analytical pages packed with dynamic charts, summary KPI cards, interactive slicers, and a fully searchable data table with CSV export functionality.
In today’s competitive dental industry, practice owners and managers need quick access to performance data to make smarter decisions about staffing, treatment pricing, patient acquisition, and insurance negotiations. Traditional spreadsheet reports are slow to build and hard to navigate. That’s exactly why this HTML dental dashboard template exists — it transforms raw clinic data into clean, interactive visuals that anyone can understand, share, and act on immediately.
Key Features of Dental Practice Dashboard in HTML
This dashboard includes 5 interactive analytical pages, 6 high-level KPI summary cards, 15+ dynamic charts, multiple interactive slicers for filtering, and a complete data table with search, sort, pagination, and CSV export capabilities. It runs entirely in the browser — Chrome, Edge, Firefox, or Safari — with zero dependencies on Excel, Power BI, or any paid software. The modern SaaS-style design ensures a professional look suitable for internal reviews, management presentations, and client reporting.
The dashboard tracks critical dental practice metrics including Total Patients, Total Revenue, Average Treatment Cost, Average Satisfaction Score, Treatment Completion Rate, and Insurance Coverage Percentage. These KPIs are displayed prominently on the Overview page and flow through every analytical page for consistent monitoring.
Dashboard Pages Explanation
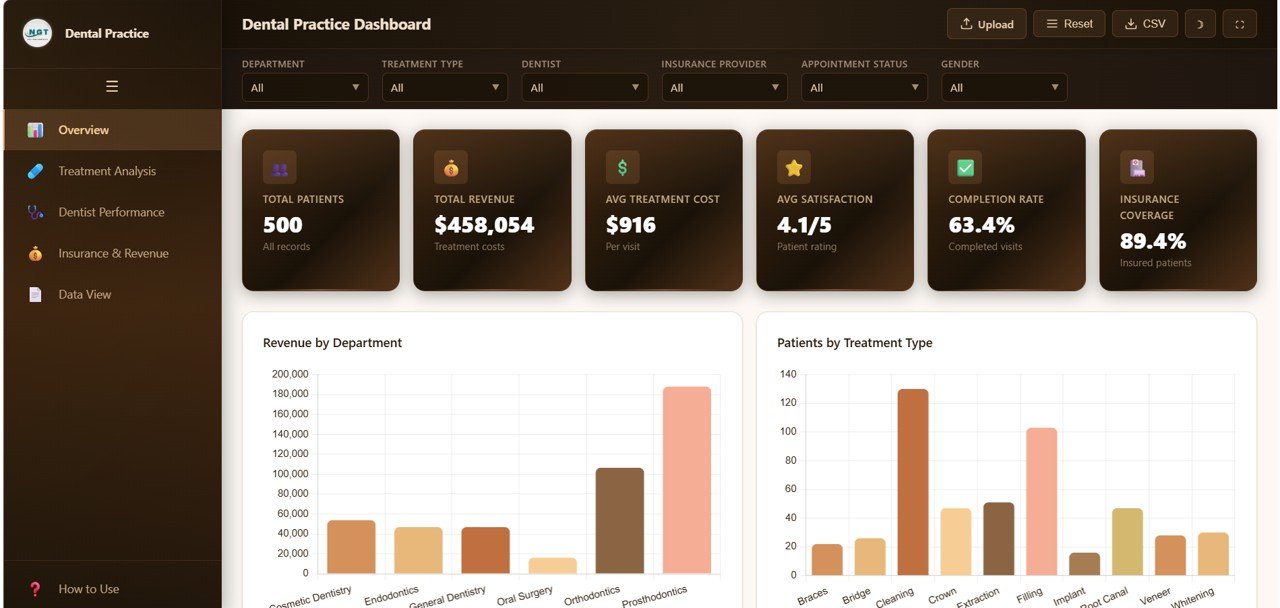
1. Overview Page
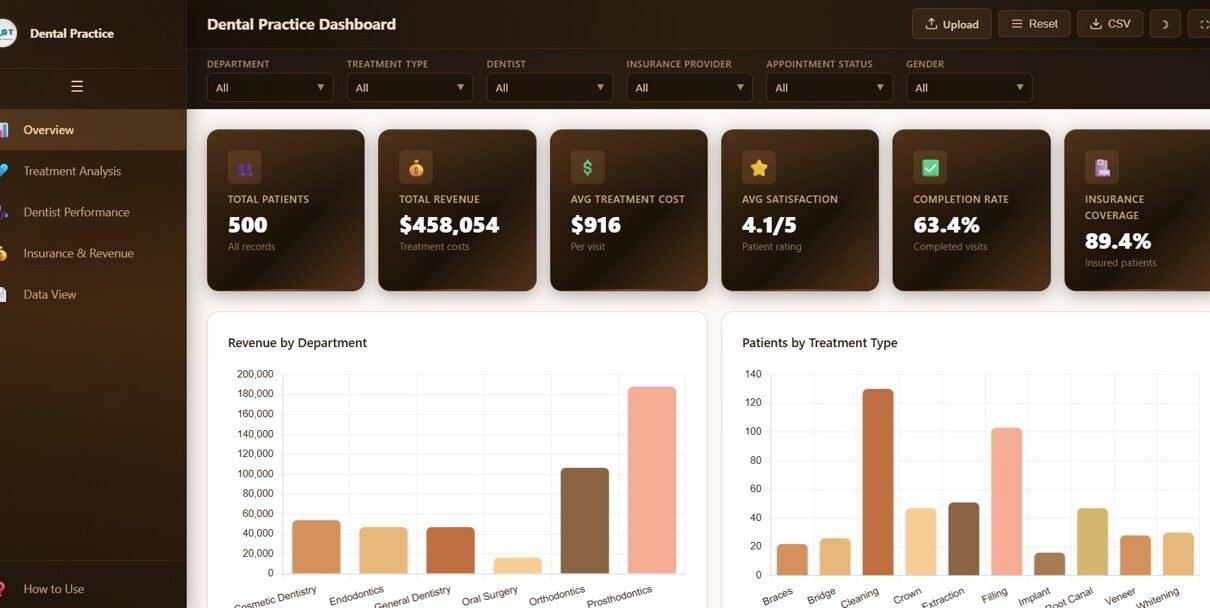
The Overview page serves as your central command hub. At the top, 6 KPI summary cards provide an at-a-glance snapshot of Total Patients, Total Revenue, Avg Treatment Cost, Avg Satisfaction, Completion Rate, and Insurance Coverage. Below these cards, 5 analytical charts deliver deeper insights:
- Revenue by Department — Shows how revenue is distributed across different clinical departments such as general dentistry, orthodontics, oral surgery, and cosmetic dentistry. This helps identify which departments generate the most income.
- Patients by Treatment Type — Highlights which dental procedures attract the most patients, helping you understand demand patterns for services like cleanings, fillings, root canals, and crowns.
- Appointment Status by Category — Displays the breakdown of scheduled, completed, cancelled, and no-show appointments across different categories, enabling you to track booking efficiency.
- Monthly Revenue Trend — Reveals seasonal income patterns and month-over-month growth or decline, allowing you to plan staffing and marketing budgets accordingly.
- Revenue by Referral Source — Identifies which patient acquisition channels deliver the highest revenue, whether it’s online search, insurance referrals, word-of-mouth, or advertising.
Multiple interactive slicers on this page let you filter all charts simultaneously by department, time period, or other dimensions.
Dental Practice Dashboard Overview2. Treatment Analysis
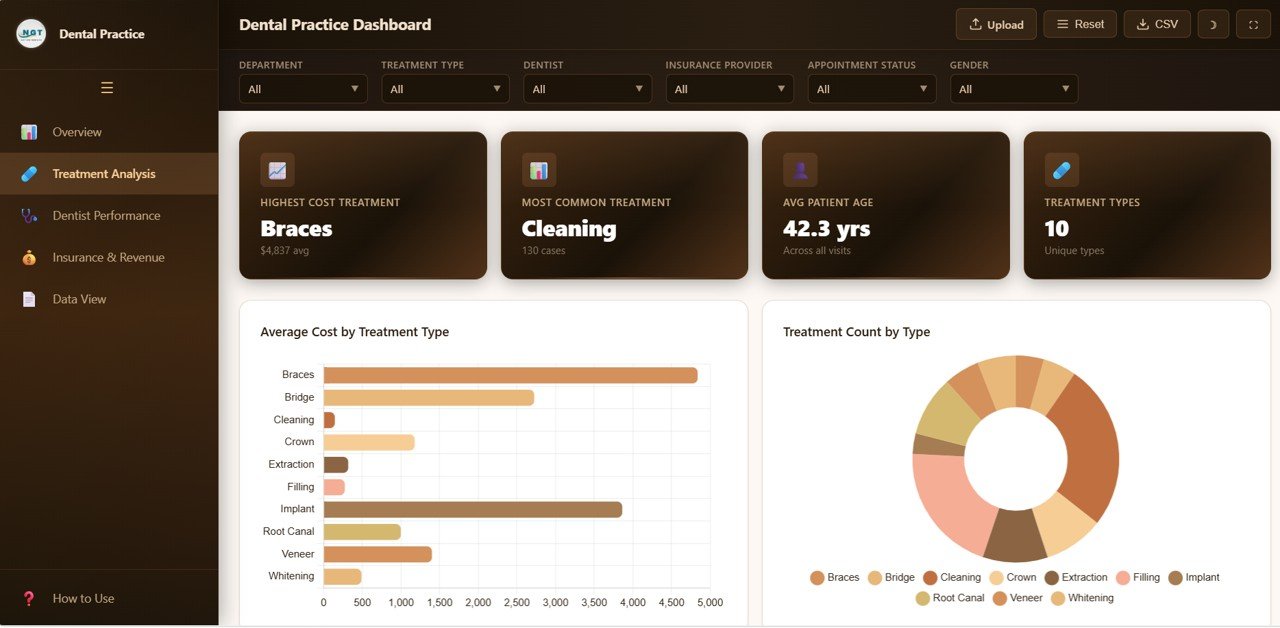
The Treatment Analysis page provides a comprehensive breakdown of dental procedures and their associated costs, volumes, and distributions. This page includes:
- Average Cost by Treatment Type — Compares the average pricing of each procedure, helping you benchmark your fees against industry norms and identify profitable services.
- Treatment Count by Type — Shows the volume of each treatment performed, revealing which procedures dominate your clinical workload.
- Treatment Distribution by Department — Reveals how treatments are spread across departments, helping balance workload and resource allocation.
- Cost Range Distribution — Analyzes the distribution of treatment costs across different price tiers, showing whether your practice skews toward budget or premium services.
- Treatment by Visit Type — Differentiates between new patient visits and follow-up appointments, helping you track patient retention and acquisition balance.
 Treatment Analysis
3. Dentist Performance
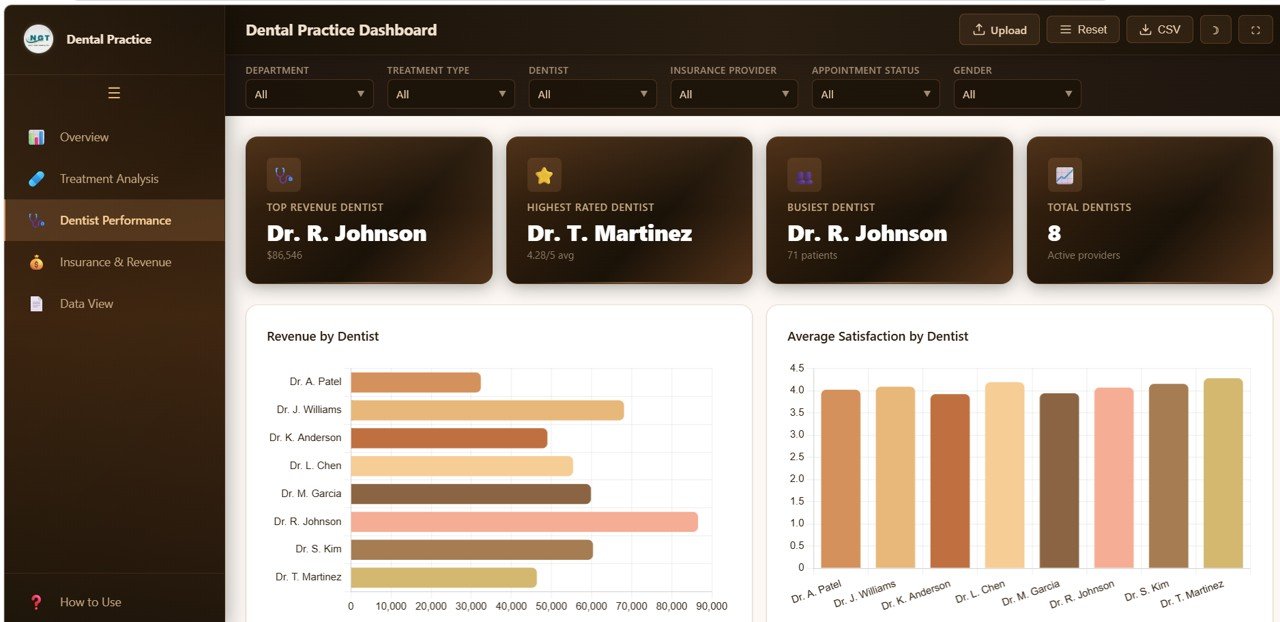
The Dentist Performance page evaluates individual practitioner contributions to the clinic’s success. This page features:
- Revenue by Dentist — Tracks the total income generated by each dentist, providing a clear comparison of revenue contributions across your team.
- Average Satisfaction by Dentist — Monitors patient satisfaction scores per dentist, helping identify top performers and those who may need coaching.
- Patient Count by Dentist — Measures the caseload distribution among dentists, ensuring fair workload allocation and capacity planning.
- Completion Rate by Dentist — Assesses how effectively each dentist converts treatment plans into completed procedures, measuring follow-through efficiency.
 Dentist Performance
4. Insurance and Revenue
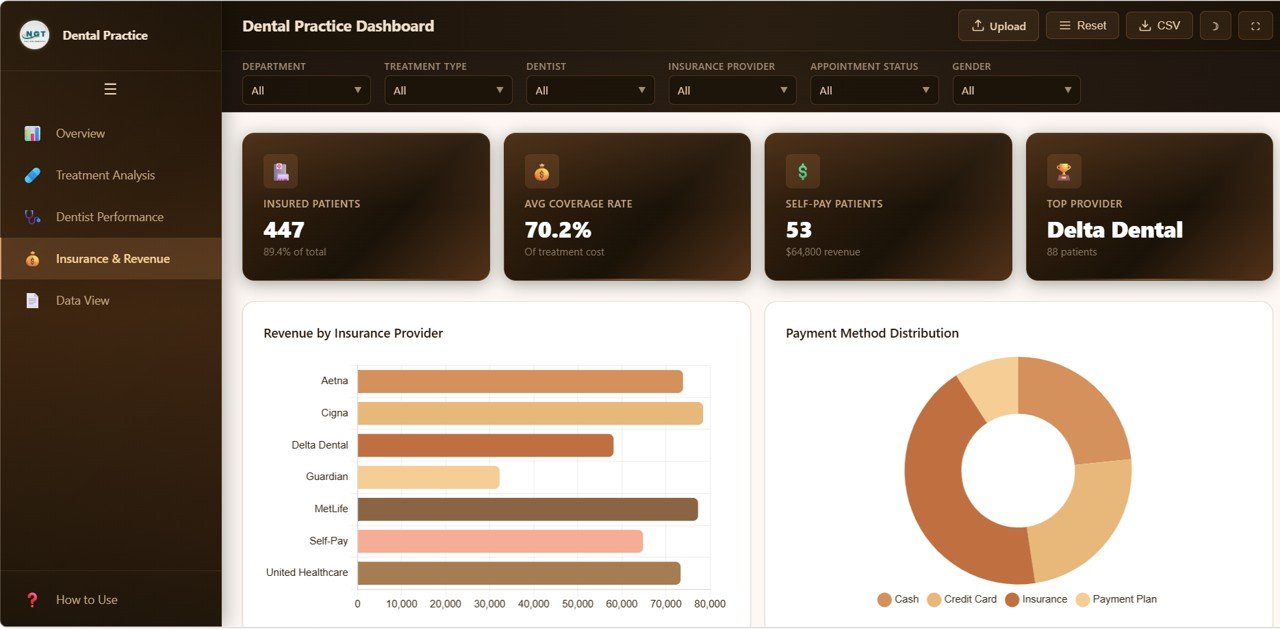
The Insurance and Revenue page provides deep financial analytics focused on payer mix, coverage levels, and demographic revenue patterns:
- Revenue by Insurance Provider — Shows which insurance companies contribute the most revenue, helping you evaluate payer relationships and negotiate better rates.
- Payment Method Distribution — Tracks how patients pay for services — cash, credit card, insurance, or financing — giving visibility into payment preferences.
- Average Coverage by Provider — Compares the average reimbursement levels across different insurance companies, identifying which providers offer the best coverage.
- Patient Count by Insurance — Measures how many patients are enrolled with each insurance provider, revealing your payer mix composition.
- Revenue by Gender — Analyzes spending patterns across demographic segments, useful for targeted marketing and service planning.
 Insurance and Revenue
5. Data View
The Data View page is a detailed data table that displays all individual records in the dataset. It features built-in search functionality for finding specific records, column-based sorting for organizing data, pagination for navigating large datasets, and a CSV export button for downloading filtered data into Excel or Google Sheets for further analysis.
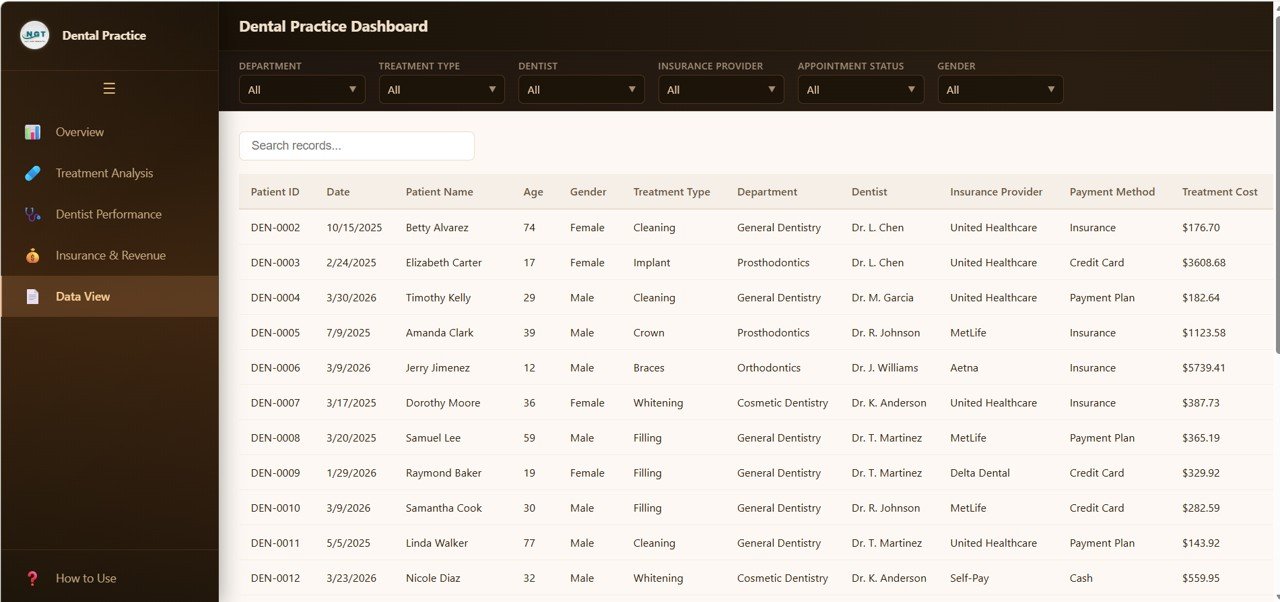 Data View
Advantages of Dental Practice Dashboard in HTML
This HTML dental dashboard offers several distinct advantages over traditional reporting methods. First, it requires absolutely no software installation — open it in any browser and you’re ready to go. Second, the interactive slicers and filters allow instant data exploration without writing formulas or building pivot tables. Third, the 5-page structure provides both high-level executive summaries and granular analytical detail in a single file. Fourth, the built-in data export functionality ensures you can extract filtered data for presentations, meetings, or regulatory reporting. Finally, the modern SaaS-style design gives your dental practice a professional analytics environment that rivals expensive BI platforms.
Opportunities for Improvement
While the dashboard covers a broad range of dental practice metrics, some users may want to add appointment scheduling integration for real-time booking data, patient demographic breakdowns by age group or zip code, treatment plan conversion funnels showing the journey from diagnosis to completion, predictive analytics for revenue forecasting, or multi-location comparison views for dental chains with multiple branches. These enhancements can be implemented by customizing the HTML and JavaScript code.
Best Practices
To get the most from your Dental Practice Dashboard in HTML, update your data file regularly — ideally weekly or monthly — to keep KPIs current. Use the interactive slicers to isolate specific departments or time periods during team meetings. Share the dashboard with department heads by simply sending the folder — no licenses needed. Compare dentist performance metrics during quarterly reviews to identify coaching opportunities. Track referral sources consistently to optimize your marketing budget allocation. Export data from the Data View tab before meetings to prepare custom reports.
Explore Relevant Templates
If you’re looking for dental analytics in other formats, explore these related templates from NextGenTemplates:
- Dental Practice Dashboard in Google Sheets — Cloud-based dental analytics with Google Apps Script automation and real-time collaboration features.
- Dental Practice KPI Dashboard in Power BI — Enterprise-grade dental KPI tracking with interactive Power BI visuals and MTD/YTD analysis.
- Dental Services KPI Dashboard in Excel — Excel-based dental performance monitoring with target tracking, trend charts, and conditional formatting.
- Dental Practice KPI Dashboard in Excel — Track patient acquisition, retention, financial performance, and operational efficiency with Excel KPIs.
- All HTML Dashboard Templates — Browse our complete collection of browser-based interactive dashboards.
Frequently Asked Questions
What is the best HTML dashboard template for dental clinics?
The Dental Practice Dashboard in HTML from NextGenTemplates is one of the most feature-rich browser-based dental analytics solutions available. It includes 5 interactive pages covering patient metrics, treatment analysis, dentist performance, insurance revenue, and a searchable data table — all running in any browser without software installation.
How many KPIs does this dental dashboard track?
The dashboard tracks 6 primary KPIs on the Overview page — Total Patients, Total Revenue, Average Treatment Cost, Average Satisfaction, Completion Rate, and Insurance Coverage. Additionally, 15+ analytical charts across all 5 pages provide deeper insights into treatment patterns, dentist productivity, and financial performance.
Can I use this dashboard for multiple dental clinic locations?
Yes. The interactive slicers and filters support multi-dimensional analysis, making it easy to segment data by department, dentist, insurance provider, or any other dimension. For multi-location setups, you can add a location field to your data and filter accordingly.
Do I need coding skills to customize this HTML dashboard?
No coding skills are needed for basic data replacement. Simply update the data file with your own clinic records. For advanced customizations like adding new charts or changing color schemes, basic HTML and JavaScript knowledge would be helpful.
How do I replace the sample data with my own dental practice data?
Unzip the downloaded file, locate the data file inside the folder, and replace the sample records with your own clinic data following the same column structure. Save the file and refresh index.html in your browser — all charts, KPIs, and tables will update automatically.
Can I export data from this dashboard?
Yes. The Data View tab includes a CSV export button that lets you download the filtered data directly. You can open the exported CSV in Excel, Google Sheets, or any spreadsheet application for further analysis and reporting.
Conclusion
The Dental Practice Dashboard in HTML is a powerful, zero-installation analytics tool that transforms your dental clinic’s raw data into actionable insights across 5 interactive pages. Whether you’re tracking patient satisfaction, evaluating dentist performance, analyzing insurance revenue, or exploring treatment patterns, this dashboard delivers everything you need in a clean, professional interface that runs in any browser.
Click here to Purchase Dental Practice Dashboard in HTML
Visit our YouTube channel for step-by-step tutorials: Youtube.com/@NeoTechNavigators