In today’s rapidly evolving business landscape, maintaining environmental sustainability is paramount. As organizations across the globe strive to minimize their environmental impact, using a comprehensive tool like an Environmental KPI Dashboard can help streamline this process. By utilizing Google Sheets, companies can easily track, visualize, and manage their environmental performance in a user-friendly manner. This article will explore how to set up an Environmental KPI Dashboard in Google Sheets, listing key KPIs, their formulas, definitions, and providing a guide on best practices for effective usage.
What is an Environmental KPI Dashboard?
An Environmental KPI Dashboard is a tool designed to help businesses monitor and manage their environmental impact. This dashboard typically includes key performance indicators (KPIs) related to energy consumption, waste production, water usage, and other critical environmental factors. The dashboard allows organizations to visualize and track progress towards their sustainability goals, providing valuable insights into areas that need improvement.
Key Features of the Environmental KPI Dashboard
The Environmental KPI Dashboard in Google Sheets is a ready-to-use template designed for ease of use and quick implementation. Below are the key features of this dashboard:
Dashboard Sheet Tab
This is the main sheet where all KPIs are displayed. You can select the month from a drop-down menu in Range D3, and the entire dashboard will update to reflect the selected month’s data. It includes metrics such as MTD (Month-to-Date) Actual, Target, and Previous Year data, with visual comparisons like Target vs Actual and Previous Year vs Actual, using conditional formatting (up/down arrows).
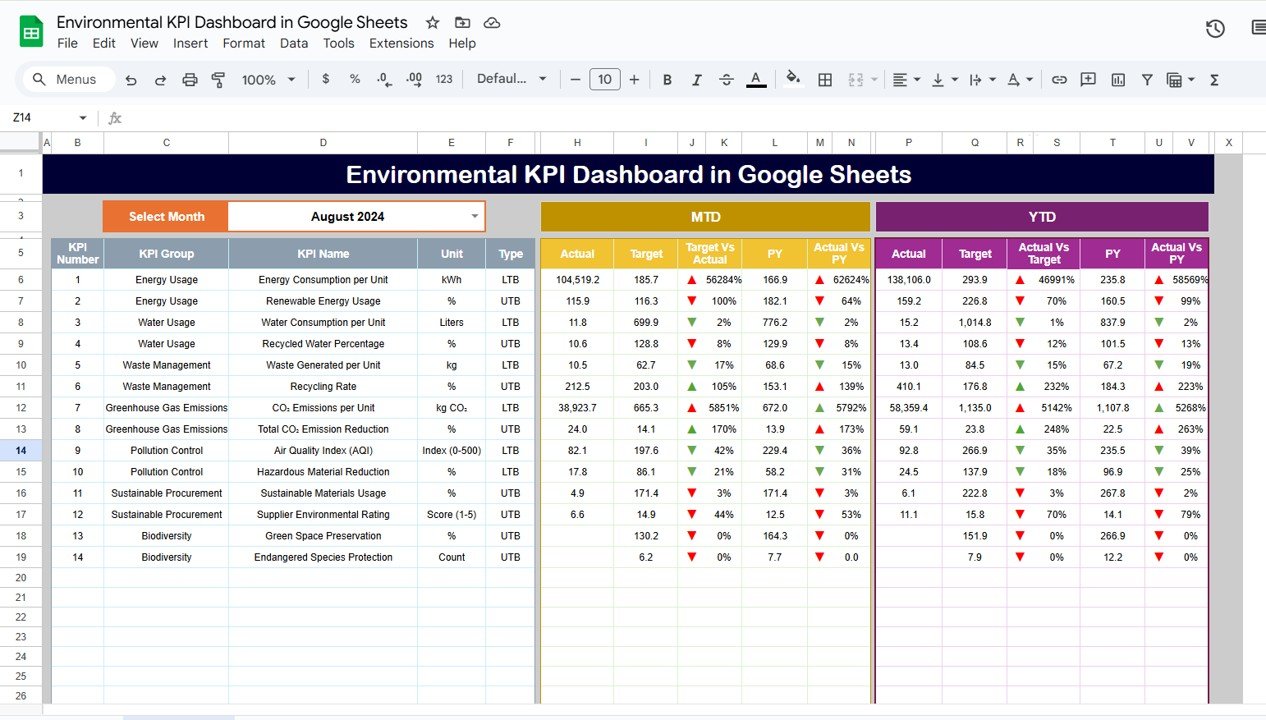
Click to buy Environmental KPI Dashboard in Google Sheets
KPI Trend Sheet Tab
This sheet displays trends for each KPI over time. By selecting a KPI from a drop-down menu, users can view the KPI group, unit of measurement, KPI type (Lower the Better or Upper the Better), formula, and a brief definition of the KPI.
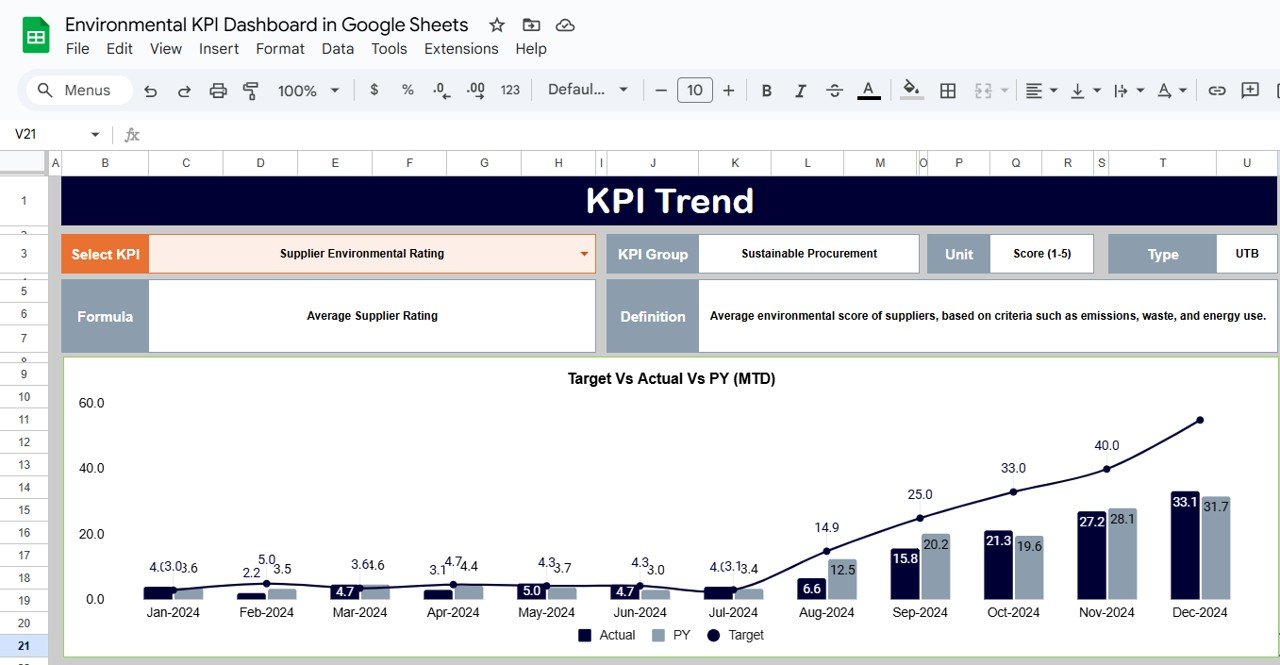
Click to buy Environmental KPI Dashboard in Google Sheets
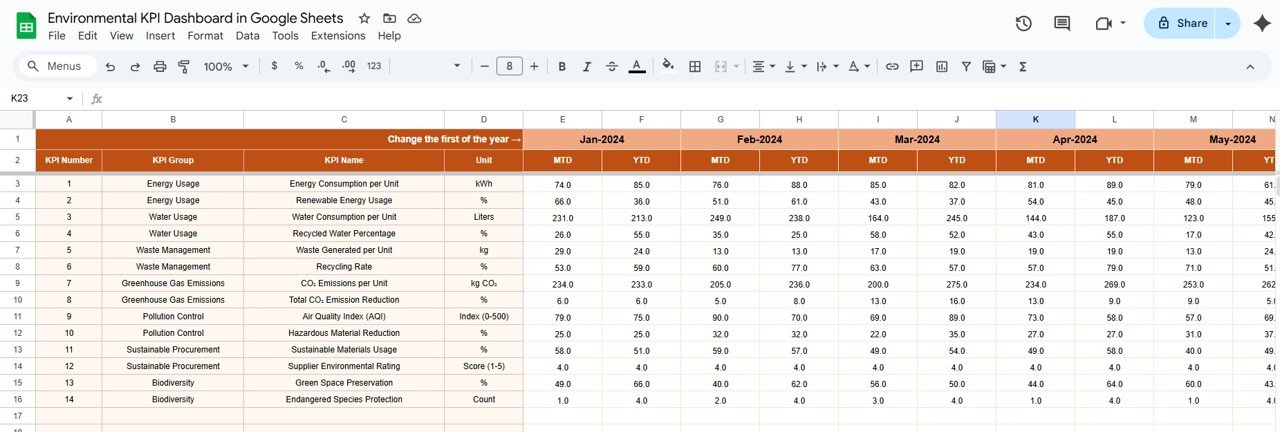
Actual Numbers Sheet Tab
This tab allows users to input actual environmental data for MTD and YTD (Year-to-Date) for a specific month. Users simply need to select the first month of the year, and the data will adjust accordingly.
Click to buy Environmental KPI Dashboard in Google Sheets
Target Sheet Tab
In this sheet, users can enter target values for each KPI for both MTD and YTD.

Click to buy Environmental KPI Dashboard in Google Sheets
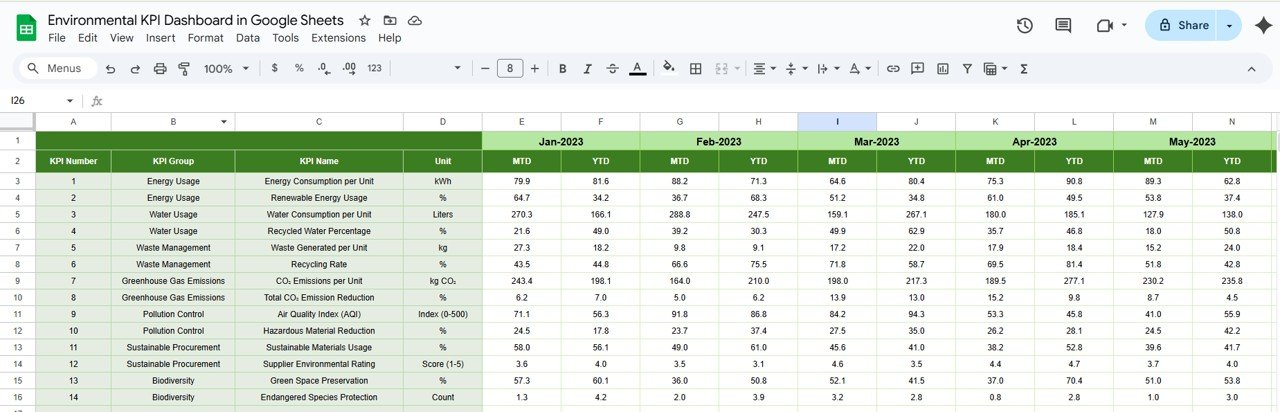
Previous Year Numbers Sheet Tab
This sheet enables users to input the previous year’s data for each KPI, allowing for historical comparisons.
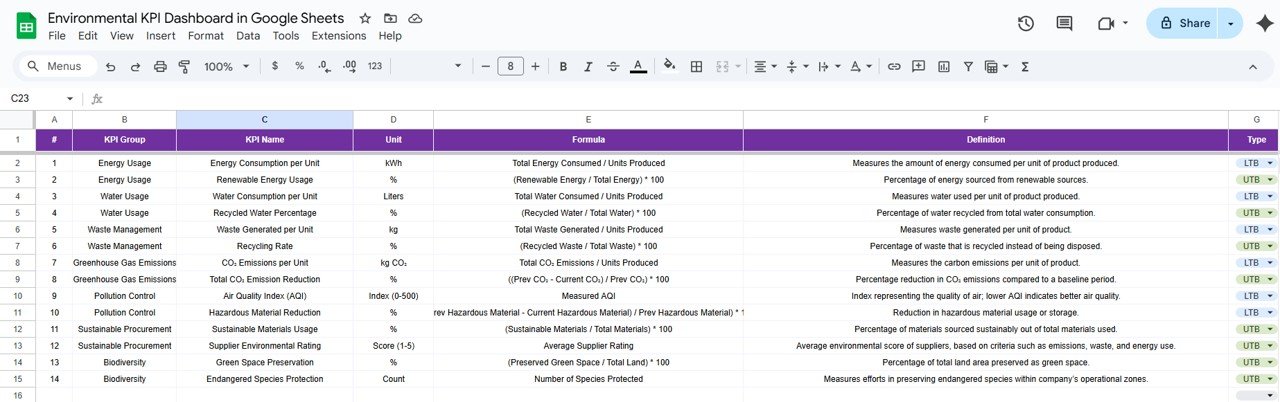
KPI Definition Sheet Tab
This tab is used to document the definition, formula, and calculation method for each KPI.
Advantages of Using the Environmental KPI Dashboard
Implementing an Environmental KPI Dashboard in Google Sheets offers several advantages for organizations focused on sustainability:
-
Centralized Data: All environmental data is stored in one place, making it easier for businesses to access, analyze, and act upon the information.
-
Real-time Updates: The ability to select months and dynamically update the data ensures that the dashboard is always up-to-date, providing a real-time view of the organization’s environmental performance.
-
Data Visualization: With built-in charts and conditional formatting, users can quickly visualize trends, identify problem areas, and track progress toward sustainability goals.
-
Easy to Use: The Google Sheets template is user-friendly, requiring no special technical skills to input data and generate reports.
-
Cost-effective: Google Sheets is free, making it a cost-effective solution for businesses of all sizes, regardless of budget constraints.
Opportunities for Improvement in the Environmental KPI Dashboard
Click to buy Environmental KPI Dashboard in Google Sheets
While the Environmental KPI Dashboard is a powerful tool, there are always opportunities for improvement. Here are a few areas that organizations can consider enhancing:
-
Automation: Implementing Google Apps Scripts or integrating with other tools can automate data entry and reduce manual effort.
-
Advanced Reporting: Adding more complex reporting features, such as predictive analytics or benchmarking, could help organizations make more informed decisions.
-
Integration with IoT: Leveraging Internet of Things (IoT) devices for real-time data collection on energy consumption, water usage, and air quality could enhance the dashboard’s accuracy.
Best Practices for the Environmental KPI Dashboard
To maximize the effectiveness of the Environmental KPI Dashboard, organizations should adhere to the following best practices:
-
Regular Data Updates: Ensure that the data is updated regularly to maintain the accuracy of the dashboard. Set reminders or automate the process wherever possible.
-
Clear Definitions: Clearly define each KPI and ensure that all team members understand how they are measured. This will prevent confusion and misinterpretation of the data.
-
Review Progress Monthly: Review the dashboard on a monthly basis to assess whether the company is on track to meet its environmental goals.
-
Actionable Insights: Use the dashboard to generate actionable insights. If any KPIs are underperforming, investigate the cause and take corrective action.
Frequently Asked Questions (FAQs)
1. What is an Environmental KPI Dashboard?
An Environmental KPI Dashboard is a tool used to track and monitor key performance indicators related to a company’s environmental impact, such as energy consumption, waste generation, and carbon emissions.
2. How can I create an Environmental KPI Dashboard in Google Sheets?
You can create an Environmental KPI Dashboard in Google Sheets by using the provided template, entering your actual and target data for each KPI, and utilizing Google Sheets’ built-in charts and functions to visualize and analyze the data.
3. What are the most important KPIs to track for sustainability?
Key KPIs for sustainability include energy consumption, water usage, waste generation, carbon emissions, recycling rate, and air and water quality metrics.
4. Can I automate the data entry in the Google Sheets template?
Yes, you can automate the data entry using Google Apps Script or integrate with other platforms to automatically pull in data from IoT sensors or third-party systems.
5. How often should I update the Environmental KPI Dashboard?
It’s best to update the dashboard at least monthly to ensure that the data reflects the latest environmental performance and allows for timely adjustments.
Conclusion
The Environmental KPI Dashboard in Google Sheets is an invaluable tool for businesses committed to improving their environmental performance. By tracking key metrics, visualizing trends, and comparing data over time, organizations can stay on top of their sustainability efforts. With the potential for automation and advanced reporting features, this tool can evolve to meet the growing demands of environmental management.
Visit our YouTube channel to learn step-by-step video tutorials
Youtube.com/@NeotechNavigators
Watch the step-by-step video Demo: