Insurance Agency Dashboard in HTML is a browser-based, interactive analytics template built for insurance agencies, brokers, underwriters, and risk managers who need to monitor policy performance, premium collection, claims activity, agent productivity, and customer satisfaction from a single HTML file. This Insurance Agency Dashboard in HTML includes 5 interactive pages covering Overview, Agent Performance, Claims Analysis, Policy Insights, and a detailed Data View page with search, sort, pagination, and CSV export. The dashboard tracks 6 key metrics — Total Policies, Total Premium, Total Claims, Total Commission, Avg Satisfaction, and Claim Rate — all updated dynamically through interactive charts and filters.
Whether you run a small brokerage or manage a large multi-agent agency, this dashboard provides instant clarity on premium trends, claims patterns, agent rankings, and policy portfolio composition — without installing any software. Simply open index.html in any modern browser and start analyzing. If you prefer spreadsheet-based analytics, check out the Insurance Agency Dashboard in Excel or the Insurance Agency Dashboard in Power BI for advanced reporting. Browse all HTML Dashboard Templates from NextGen Templates.
Key Features of Insurance Agency Dashboard in HTML
This HTML dashboard delivers comprehensive insurance analytics across 5 interactive pages with dynamic charts, KPI cards, and smart filters. The Overview page displays 6 KPI cards — Total Policies, Total Premium, Total Claims, Total Commission, Avg Satisfaction, and Claim Rate — alongside 5 analytical charts covering Premium by Policy Type, Claims by Region, Policies by Channel, Claim Status Distribution, and Monthly Premium vs Claims Trend. Built-in slicers enable instant filtering across all pages, allowing managers to drill down into specific policy types, regions, channels, or time periods within seconds.
The template runs entirely in your web browser with no software installation required. It features a professional SaaS-style design with multi-tab navigation, responsive layout for desktops and tablets, and a Data View page with searchable, sortable records and CSV export. Every chart updates dynamically as you filter — giving you a live, interactive analytics experience comparable to enterprise-grade BI tools.
Click here to Purchase Insurance Agency Dashboard in HTML
Dashboard Pages Explained
1. Overview Page
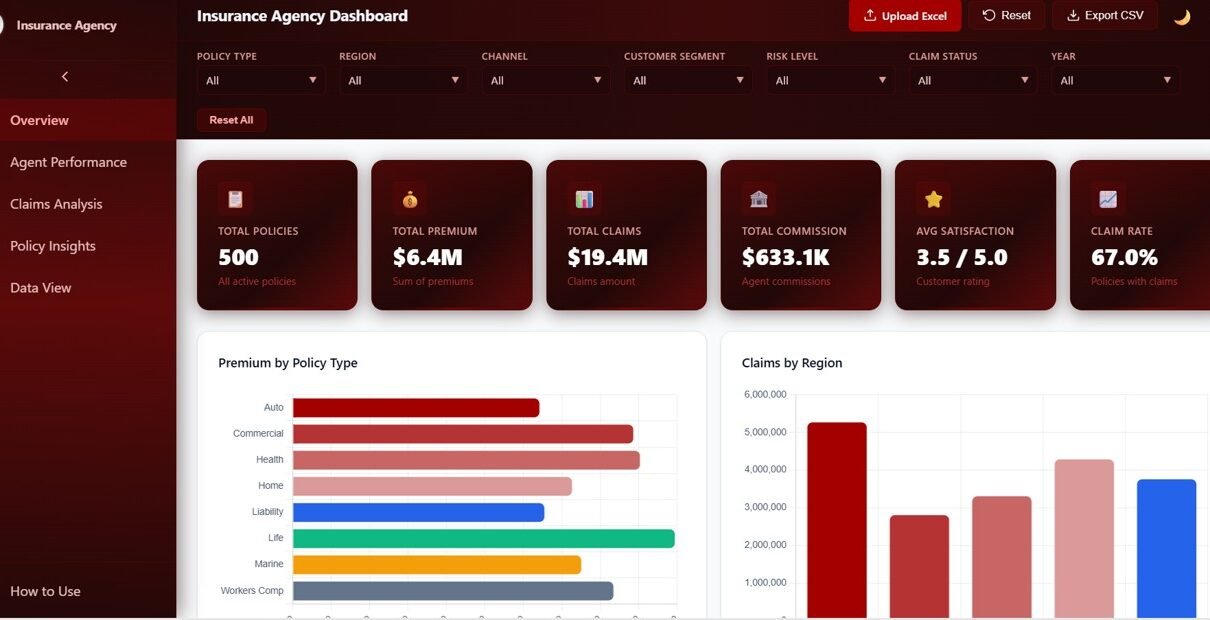
The command center of your insurance analytics. Six high-level KPI cards display Total Policies, Total Premium, Total Claims, Total Commission, Avg Satisfaction, and Claim Rate. Below the cards, five interactive charts provide a comprehensive snapshot: Premium by Policy Type shows how your premium collection is distributed across life, health, auto, property, and other insurance lines. Claims by Region highlights which geographic areas generate the most claims activity. Policies by Channel reveals which acquisition channels — online, agent, referral, direct — drive the most policy sales. Claim Status Distribution breaks down claims into approved, pending, rejected, and settled categories. Monthly Premium vs Claims Trend tracks the relationship between premiums collected and claims paid over time, helping you identify seasonal patterns and profitability trends.
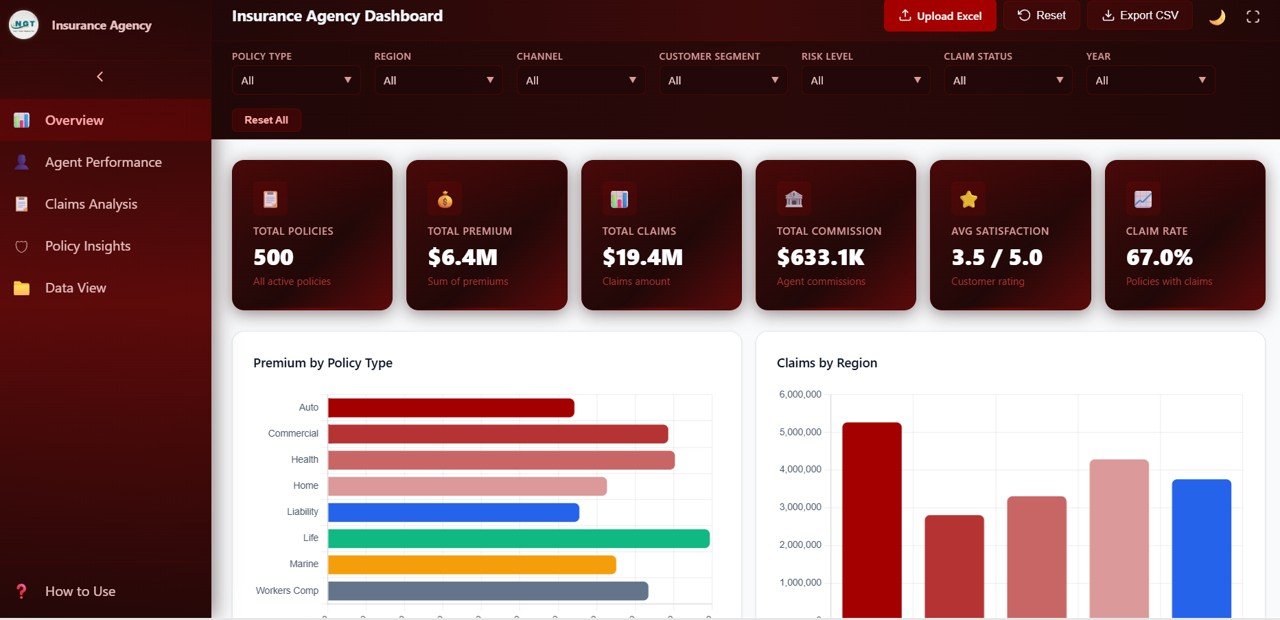
Insurance Agency Dashboard Overview
2. Agent Performance
This page evaluates individual agent productivity and effectiveness across four key dimensions. Premium by Agent ranks your agents by total premium generated, making it easy to identify your top revenue producers. Claims by Agent shows claims volume per agent, helping managers spot agents with unusually high claim ratios. Commission by Agent tracks commission earnings across the team. Satisfaction Score by Agent measures customer satisfaction ratings for each agent, enabling quality-of-service comparisons and targeted coaching.
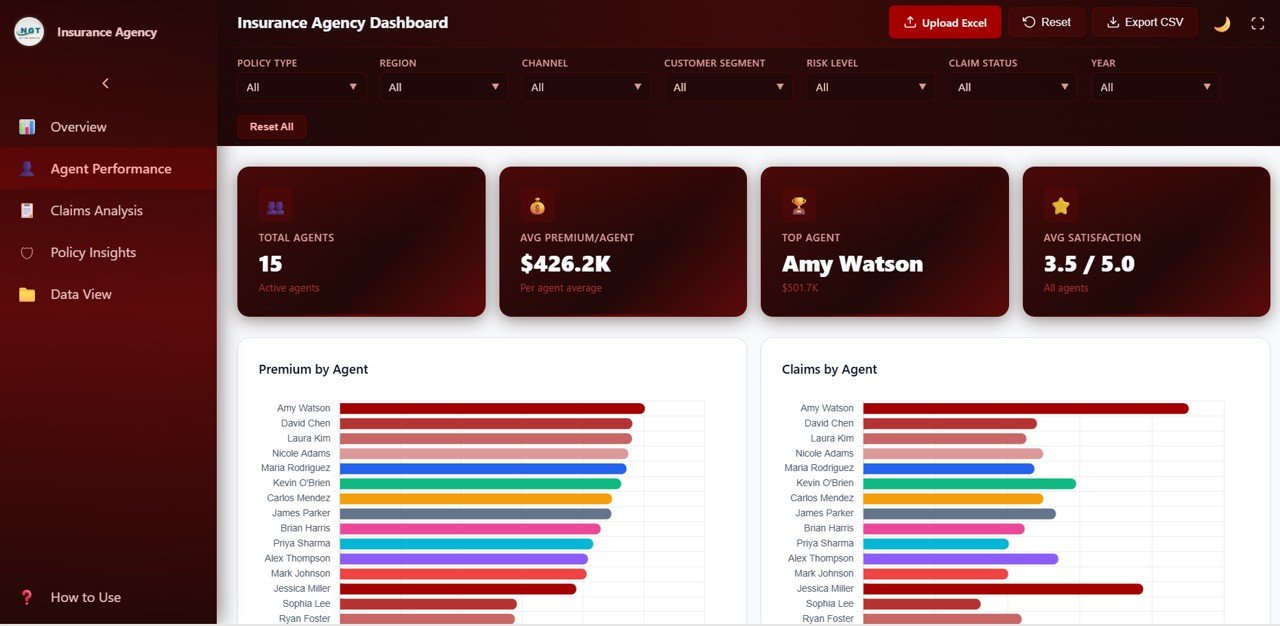
Agent Performance
3. Claims Analysis
A deep dive into claims behavior and risk patterns across your insurance portfolio. Claims by Policy Type breaks down claim volumes across insurance categories to identify which products generate the most claims. Claims by Risk Level segments claims into low, medium, and high risk categories for risk management planning. Claims by Customer Segment analyzes claims across individual, family, corporate, and other customer types. Claim Amount by Region compares total claim amounts across geographic regions to identify high-cost areas requiring attention.
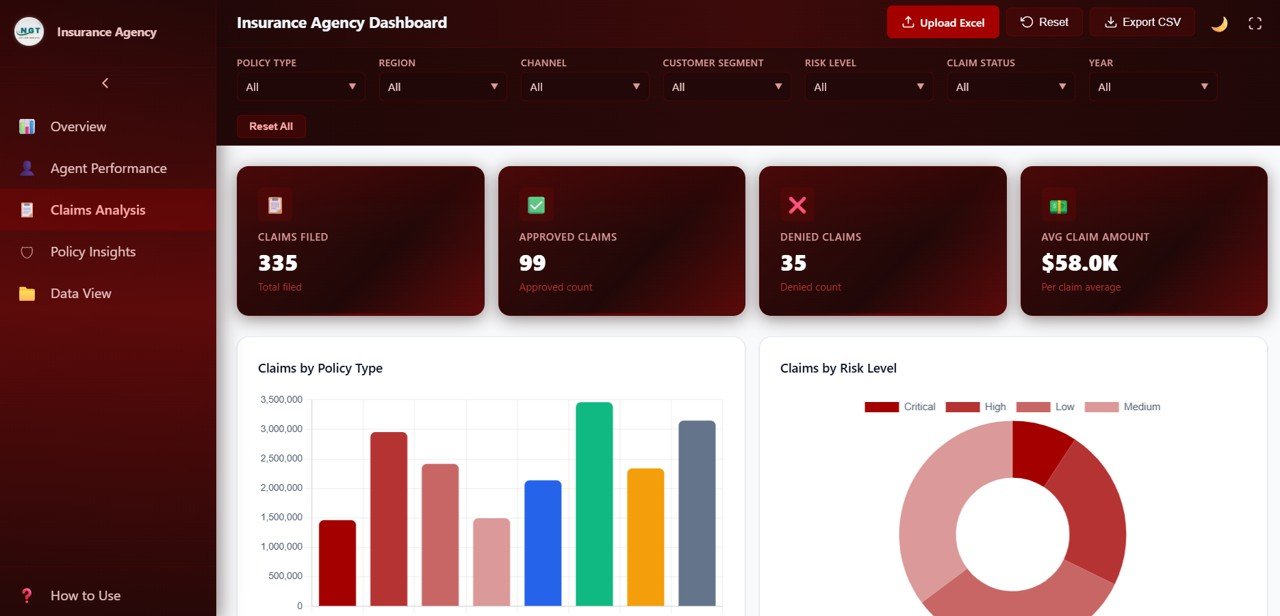
Claims Analysis
4. Policy Insights
Understand your policy portfolio composition and customer distribution. Premium by Customer Segment shows how premium collection is distributed across customer types. Coverage by Policy Type analyzes the coverage amounts by insurance category. Policies by Payment Frequency reveals how customers prefer to pay — monthly, quarterly, semi-annually, or annually. Premium by Region displays regional premium distribution to support market expansion and territory planning. For cloud-based insurance analytics, explore the Policy Performance and Risk Analysis Dashboard in Google Sheets.
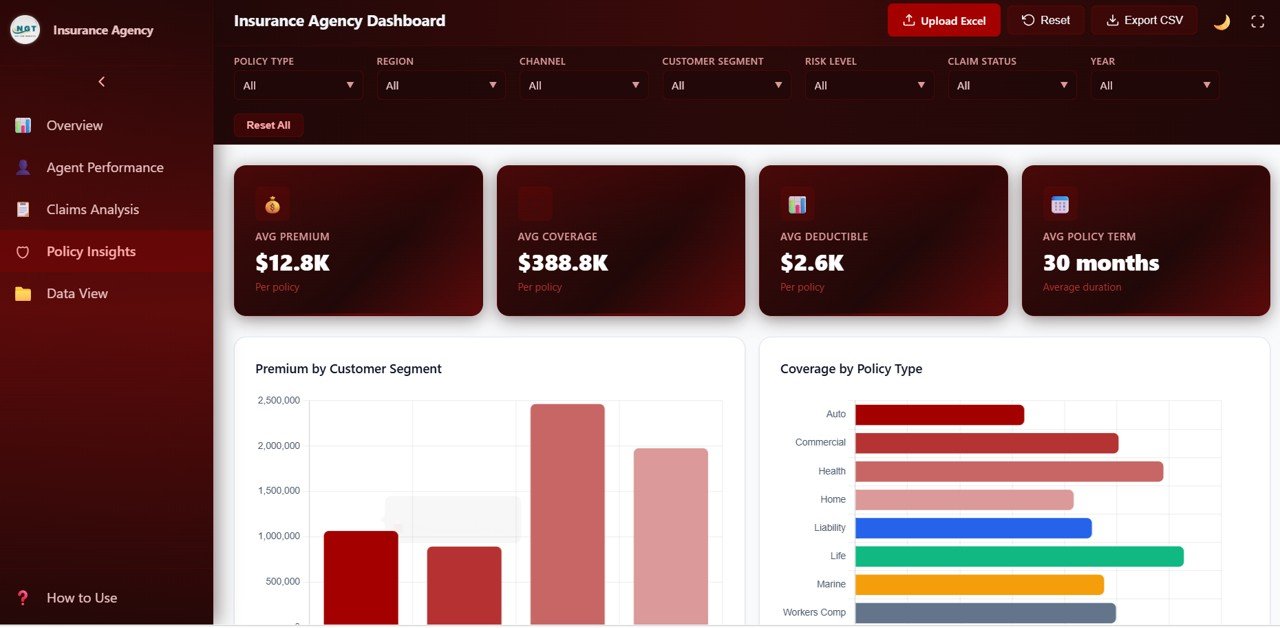
Policy Insights
5. Data View
A detailed data table page where you can see all insurance records with search, sort, and pagination features. Search for any policy by keyword, sort columns ascending or descending, and navigate through pages of records. You can also export the filtered data to CSV for use in Excel, Google Sheets, Power BI, or any other analytics tool.
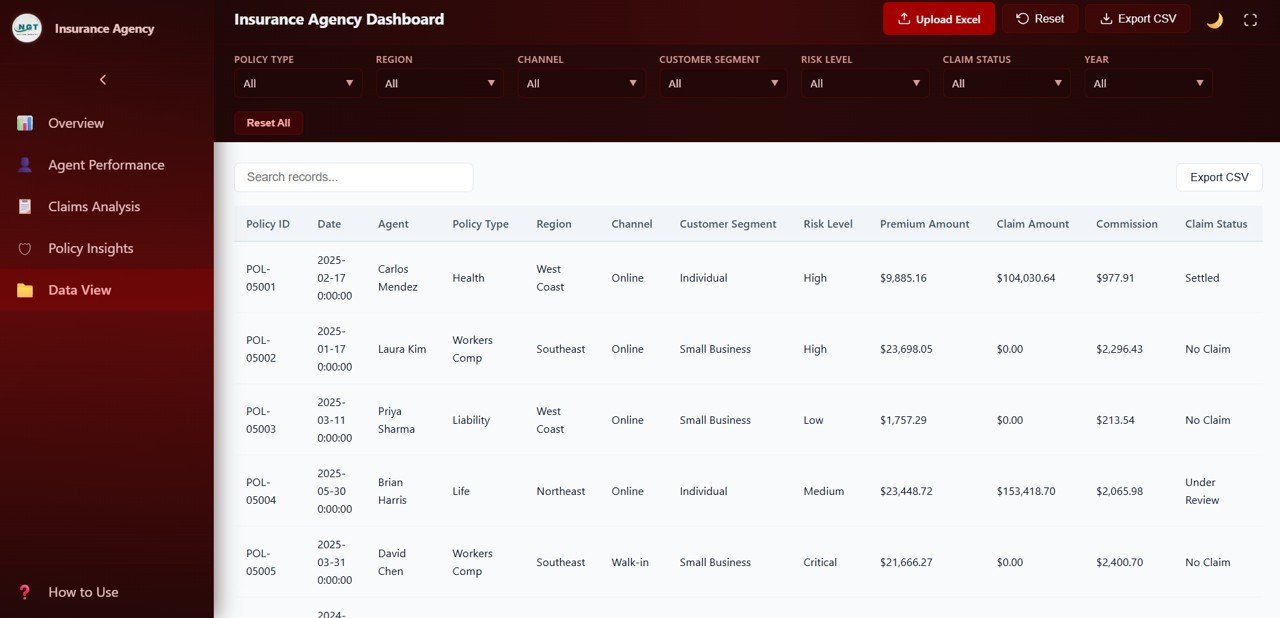
Data View
Advantages of Insurance Agency Dashboard in HTML
- Zero Software Installation — Runs entirely in your web browser. No Excel, Power BI, or database setup needed.
- Instant Insights — 6 KPI cards and 5+ charts on the Overview page give you a complete agency health check in seconds.
- Agent Accountability — Compare premium production, claims volume, commission, and satisfaction scores across all agents in one view.
- Risk Visibility — Claims Analysis page segments claims by policy type, risk level, customer segment, and region to support proactive risk management.
- Portfolio Intelligence — Policy Insights page helps optimize your product mix, payment structures, and regional strategies.
- Data Portability — Export filtered records to CSV from the Data View page for further analysis in any tool.
- Professional Design — SaaS-grade visual design that impresses stakeholders during presentations and reviews.
Opportunities for Improvement
- Adding a trend line or forecast feature to the Monthly Premium vs Claims chart would help with budgeting and financial planning.
- An agent ranking scorecard combining all four performance metrics into a single composite score would simplify performance reviews.
- Including a policy renewal tracking page would add lifecycle management capabilities for proactive retention strategies.
- A customer feedback or NPS tracking section would complement the existing satisfaction score analysis.
Best Practices for Using This Dashboard
- Update your data regularly — monthly or weekly — to keep KPIs and charts current and actionable.
- Use the filters strategically to compare regions, agents, or policy types side by side for performance benchmarking.
- Share the dashboard with your leadership team during quarterly reviews to drive data-informed decision making.
- Export the Data View to CSV before meetings so team members can reference specific records during discussions.
- Customize the data file structure to match your agency’s internal fields for seamless integration with your existing workflows.
Explore Relevant Templates
Insurance Agency Dashboard in Excel — Pivot-driven Excel version with 7 sheet tabs, slicers, and KPI cards for spreadsheet-based insurance analytics.
Insurance Agency Dashboard in Power BI — Interactive Power BI version with 5 pages and dynamic slicers for advanced analytics.
Policy Performance and Risk Analysis Dashboard in Google Sheets — Cloud-based insurance policy tracking with risk analysis and premium monitoring.
Hospital Patient Flow Dashboard in HTML — Browser-based healthcare dashboard tracking patient flow, treatment costs, and satisfaction.
Frequently Asked Questions
What is the best HTML dashboard for tracking insurance agency performance?
The Insurance Agency Dashboard in HTML from NextGenTemplates is a comprehensive browser-based solution that tracks 6 KPIs across 5 interactive pages including Overview, Agent Performance, Claims Analysis, Policy Insights, and Data View. It requires no software installation and runs in any modern web browser.
How do I customize this insurance HTML dashboard with my own data?
Simply replace the sample data in the included data file with your own insurance agency records — policies, premiums, claims, agents, and customer details. All charts, KPI cards, and filters update automatically to reflect your data.
Can I track individual agent performance with this dashboard?
Yes. The Agent Performance page provides four dedicated charts: Premium by Agent, Claims by Agent, Commission by Agent, and Satisfaction Score by Agent. You can compare agents side by side and use filters to drill into specific metrics.
Does this dashboard support data export?
Yes. The Data View page includes a CSV export feature that lets you download filtered insurance records for use in Excel, Google Sheets, Power BI, or any other analytics tool.
Is this template available in Excel or Power BI?
Yes. NextGen Templates offers the Insurance Agency Dashboard in Excel with pivot tables and slicers, and the Insurance Agency Dashboard in Power BI with interactive Power BI visuals and dynamic filtering.
Do I need coding skills to use this HTML dashboard?
No. This dashboard is ready to use out of the box. Simply unzip the downloaded file, open index.html in your browser, and start exploring. No coding, no plugins, no server setup required.
Conclusion
The Insurance Agency Dashboard in HTML gives insurance agencies a powerful, browser-based analytics solution to monitor policies, premiums, claims, agent performance, and customer satisfaction — all without installing any software. With 5 interactive pages, 6 KPI cards, smart filters, and CSV export, this template transforms raw insurance data into clear, actionable insights that drive smarter decisions and better agency outcomes.
Click here to Purchase Insurance Agency Dashboard in HTML
Visit our YouTube channel for step-by-step video tutorials: Youtube.com/@NeoTechNavigators