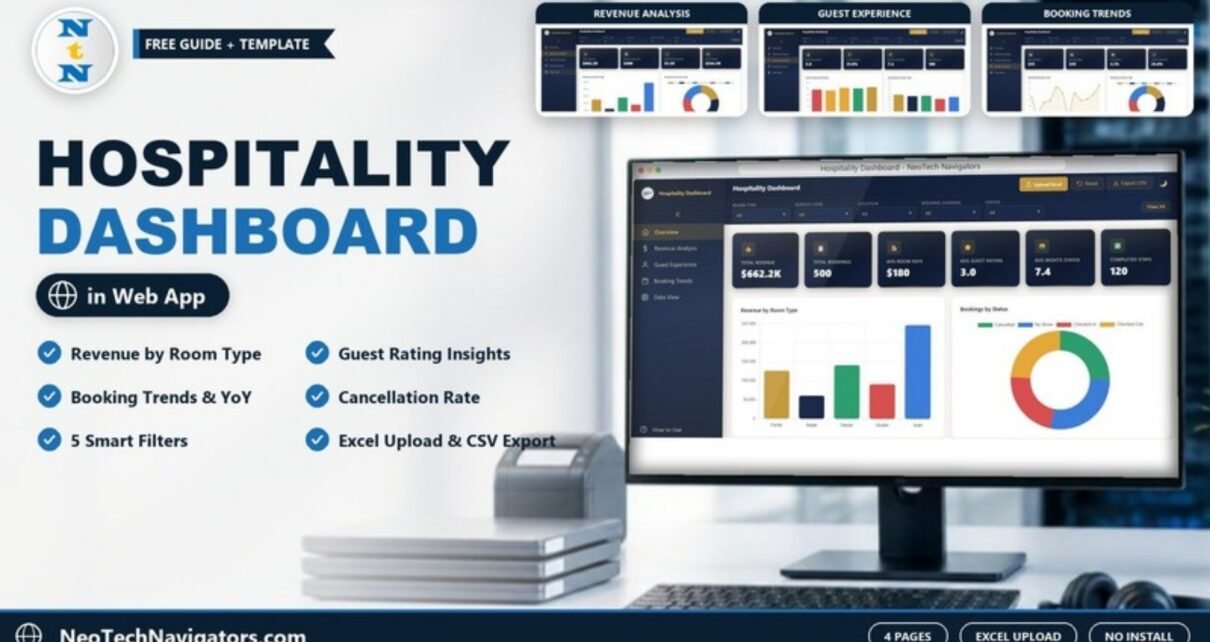
The Hospitality Dashboard in HTML is a browser-based dashboard for hotels, resorts, guesthouses and serviced apartments. It turns a booking list into clear numbers: total revenue, total bookings, average room rate, guest rating, nights stayed, cancellations and year-over-year growth. You open it in Chrome, Edge or Firefox; there is no Excel, Power BI or database to install.
It is built for hotel owners, general managers, front office and revenue managers who want a quick, presentable view of performance without building reports by hand. Inside you get four analysis pages (Overview, Revenue Analysis, Guest Experience and Booking Trends), a Data View page, five drop-down filters, an Upload Excel button for your own data, Export CSV, a Reset button and a light/dark mode toggle.
🎥 Watch the Video Tutorial
Get the Hospitality Dashboard in HTML
What Problem Does a Hospitality Dashboard Solve?
Most small and mid-sized properties keep bookings in a property management system export or a spreadsheet. The data is there, but answering simple questions takes time: Which room type earns the most? How many bookings are cancelled? Are guests rating Double rooms lower than Suites? Is this year busier than last year?
This dashboard answers those questions on screen. Load your booking data, choose a filter, and every card and chart updates together. Because it is a single web page, you can also show it in a management meeting or share it with an owner who does not use Excel.
Filters and Controls
A filter bar runs across the top of every page with five drop-downs:
- Room Type – Family, Single, Deluxe, Double and Suite in the sample data
- Service Used – Gym, Laundry, Room Service, Concierge and Spa
- Location
- Booking Channel
- Status – Cancelled, No Show, Checked In and Checked Out
A Clear All button resets the filters. In the header you also get Upload Excel, Reset, Export CSV and a moon icon to switch between light and dark display. A How to Use link sits at the bottom of the sidebar.
The Dashboard Pages Explained
1. Overview
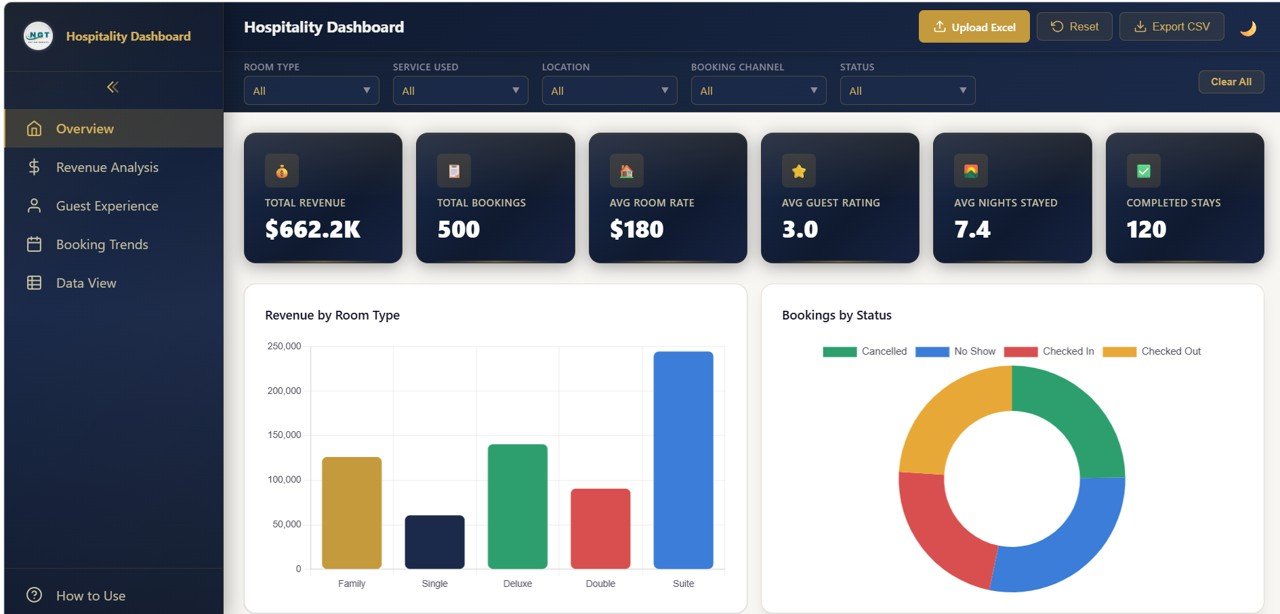
The Overview page shows six KPI cards. With the sample data these read: Total Revenue $662.2K, Total Bookings 500, Avg Room Rate $180, Avg Guest Rating 3.0, Avg Nights Stayed 7.4 and Completed Stays 120. Below them, Revenue by Room Type compares Family, Single, Deluxe, Double and Suite, and Bookings by Status splits bookings into Cancelled, No Show, Checked In and Checked Out.
2. Revenue Analysis
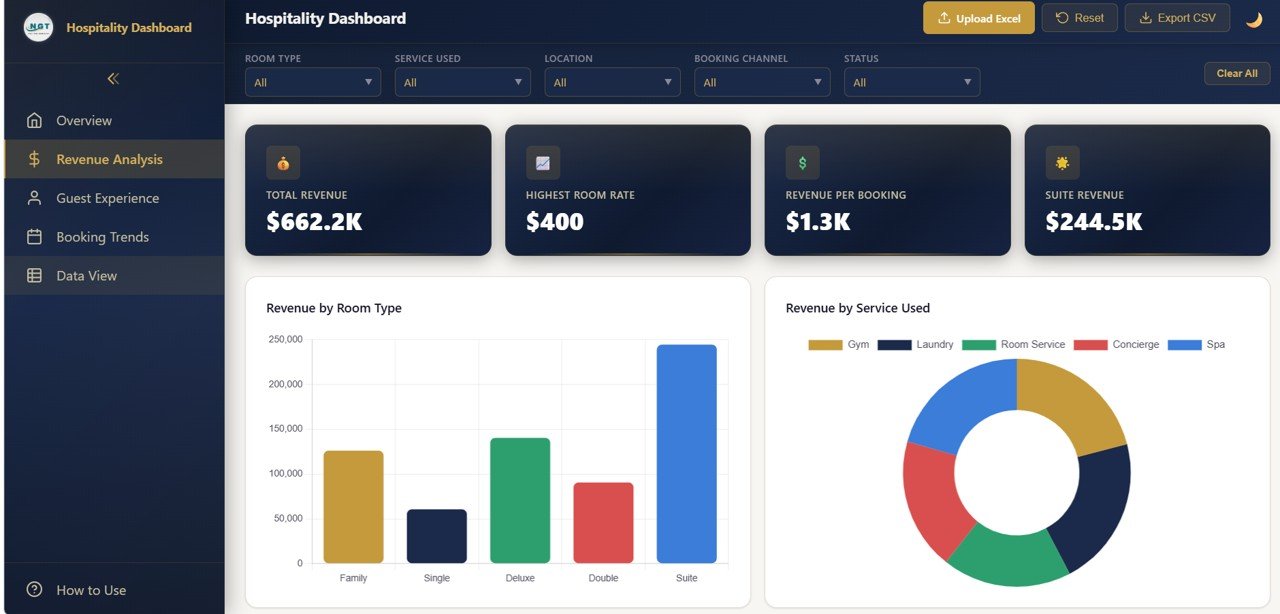
This page focuses on money. Its cards show Total Revenue $662.2K, Highest Room Rate $400, Revenue per Booking $1.3K and Suite Revenue $244.5K. The charts are Revenue by Room Type, where Suite is clearly the largest earner in the sample, and Revenue by Service Used, a donut covering Gym, Laundry, Room Service, Concierge and Spa.
3. Guest Experience
The Guest Experience page tracks how guests rate their stay. Cards show Avg Guest Rating 3.0, 5-Star Ratings 21.0%, Avg Stay Duration 7.4 and Spa Bookings 100. Guest Rating Distribution counts ratings from 1 to 5, and Avg Rating by Room Type compares satisfaction across Family, Single, Deluxe, Double and Suite. In the sample, Double rooms score lowest, which is the kind of signal that prompts a closer look at room condition or pricing.

4. Booking Trends
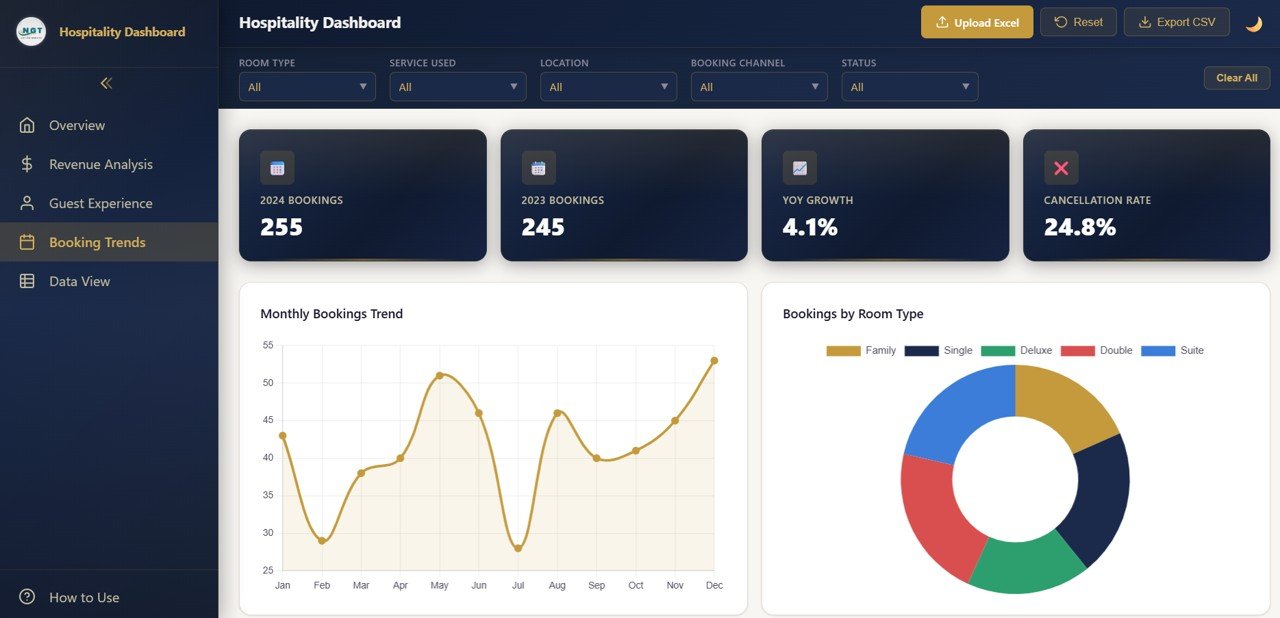
The Booking Trends page compares years and months. Cards show 2024 Bookings 255, 2023 Bookings 245, YoY Growth 4.1% and Cancellation Rate 24.8%. The Monthly Bookings Trend line runs from January to December (the sample peaks in May and December and dips in February and July), and Bookings by Room Type shows the room mix as a donut.
5. Data View
The sidebar also includes a Data View page, so you can look at the underlying records behind the charts without leaving the dashboard.
Hospitality KPIs in the Dashboard
The table below lists the KPI cards shown on the four analysis pages, how each one relates to the booking data, and which direction is better. Where the exact calculation is not shown on screen, it is described in words.
| KPI | What it measures | How it is worked out | Sample | Better when |
|---|---|---|---|---|
| Total Revenue | Income from all bookings in view | Sum of booking revenue | $662.2K | Higher |
| Total Bookings | Number of bookings | Count of booking records | 500 | Higher |
| Avg Room Rate | Typical nightly price | Average of the room rate field | $180 | Depends on strategy |
| Revenue per Booking | Value of an average booking | Total Revenue ÷ Total Bookings | $1.3K | Higher |
| Avg Guest Rating | Guest satisfaction on a 1–5 scale | Average of guest ratings | 3.0 | Higher |
| 5-Star Ratings | Share of top ratings | Bookings rated 5 ÷ rated bookings | 21.0% | Higher |
| Avg Nights Stayed | Length of stay | Average nights per booking | 7.4 | Higher (usually) |
| Completed Stays | Stays that have finished | Count of bookings counted as completed | 120 | Higher |
| YoY Growth | Change in bookings vs last year | (2024 − 2023) ÷ 2023 | 4.1% | Higher |
| Cancellation Rate | Bookings lost to cancellation | Cancelled bookings ÷ total bookings | 24.8% | Lower |
You can confirm two of these from the sample numbers:
Revenue per Booking = 662,200 / 500       = 1,324  → $1.3K
YoY Growth          = (255 - 245) / 245   = 0.0408 → 4.1%
Other hotel KPIs worth tracking
Many hotels also watch occupancy rate (rooms sold ÷ rooms available), ADR (room revenue ÷ rooms sold) and RevPAR (room revenue ÷ rooms available). These are general industry measures and are not cards in this template, because they need your total room inventory, which a booking list does not contain.
How to Use It With Your Own Data
- Unzip and open. Extract the download and open the HTML file in a modern browser.
- Explore the sample. Click through Overview, Revenue Analysis, Guest Experience and Booking Trends, and read the How to Use section in the sidebar.
- Prepare your Excel file. Export bookings from your PMS or spreadsheet and match the column layout used by the sample data (room type, service used, location, booking channel, status, revenue, rating, nights and dates).
- Click Upload Excel and select your file. The cards and charts recalculate from your rows.
- Filter. Use Room Type, Service Used, Location, Booking Channel and Status to focus on one segment, and Clear All to return to the full view.
- Export. Use Export CSV when you need the filtered data in a spreadsheet.
- Reset returns the dashboard to its starting state.
Three Real-World Use Cases
Boutique hotel monthly review
The owner opens Revenue Analysis and Booking Trends each month. If Suite revenue grows while Single rooms stay flat, it may be time to re-price or repackage the smaller rooms.
Resort cancellation control
A revenue manager filters by Booking Channel and watches the Cancellation Rate card. A channel with a much higher rate might need a stricter deposit policy.
Guest experience improvement
A guest relations lead uses Avg Rating by Room Type to find the weakest room category, then checks reviews for that room type and plans fixes.
Best Practices
- Upload fresh data on a fixed schedule, such as every Monday or month-end.
- Keep status labels identical (Cancelled, No Show, Checked In, Checked Out) so counts stay correct.
- Compare the same months year over year rather than reading the trend line alone.
- Look at ratings together with booking counts; a room type with few bookings can swing easily.
- Keep a copy of each month’s Excel file so you can reload any period later.
Limitations and Who Should Not Use It
This dashboard reads the data you upload; it does not connect live to a PMS or channel manager, so figures are only as current as your last upload. It does not calculate occupancy or RevPAR, since it has no room inventory input. Large hotel groups that need automated multi-property reporting will be better served by a connected BI setup. For single properties and small groups that want a fast, presentable view, it fits well.
Related Dashboards and Guides
Prefer spreadsheets? See the Hospitality Dashboard in Google Sheets, the Hospitality KPI Dashboard in Google Sheets and the Hospitality KPI Scorecard. For other HTML dashboards in the same style, look at the Restaurant Profit and Loss Dashboard in HTML and the Customer Satisfaction Dashboard in HTML.
Related templates on NextGenTemplates: the Hospitality Dashboard in Power BI and the Hospitality Dashboard in Excel.
If you would like to build your own reporting dashboards in Excel, the Excel Pivot Tables & Dashboards course on NextGenTemplates Academy teaches the summarising and charting steps behind dashboards like this one.
Frequently Asked Questions
Do I need special software to open the Hospitality Dashboard in HTML?
No. It runs in any modern browser such as Chrome, Edge or Firefox. There is nothing to install.
How do I add my own hotel data?
Use the Upload Excel button in the header and select an Excel file laid out like the sample data. The cards and charts recalculate from your rows.
Which filters are available?
Room Type, Service Used, Location, Booking Channel and Status, plus a Clear All button.
Does it calculate occupancy rate and RevPAR?
No. Those measures need total room inventory. The dashboard focuses on revenue, bookings, room rate, ratings, length of stay, cancellations and year-over-year growth.
Can I export filtered data?
Yes. The Export CSV button saves data from the dashboard as a CSV file you can open in Excel or Google Sheets.
Is there a dark mode?
Yes. The moon icon in the header switches the display theme.
Wrapping Up
The Hospitality Dashboard in HTML gives a hotel or resort a clean, filterable view of revenue, guest ratings and booking trends in a single browser file. Export last year’s bookings, upload them, and start with two questions: which room type earns the most, and where are cancellations coming from.
Get the Hospitality Dashboard in HTML
📅 Last updated: October 2026