Law Firm Performance Dashboard in HTML is a professionally designed, browser-based analytics template built for law firms, legal departments, solo practitioners, and corporate counsel teams who need instant visibility into billing, collections, attorney performance, client segmentation, and practice area profitability. This interactive HTML dashboard features 5 analytical pages that transform your raw legal case data into clear, actionable visual insights you can access from any modern web browser without installing any software.
Whether you manage a boutique litigation firm or a large corporate legal department, this dashboard delivers instant clarity on realization rates, billed vs collected amounts, attorney win rates, and client type analysis. The Law Firm Performance Dashboard in HTML tracks 6 key performance indicators including Total Cases, Total Billed, Total Collected, Avg Satisfaction, Realization Rate, and Total Case Value across 5 interactive dashboard pages.
Key Features of the Law Firm Performance Dashboard in HTML
The Law Firm Performance Dashboard in HTML is packed with features designed specifically for legal professionals. It includes 5 interactive dashboard pages — Overview, Attorney Analysis, Practice Insights, Client Analysis, and Data View — covering every critical dimension of law firm operations. The Overview page displays 6 high-level KPI cards and 5 analytical charts with interactive filtering. The Attorney Analysis page provides deep insights into individual attorney performance metrics. The Practice Insights page analyzes revenue by practice area and billing method. The Client Analysis page segments your client base for profitability analysis. The Data View page offers a searchable, sortable data table with CSV export.
All charts and KPI cards update dynamically when you apply filters or update the data file. The dashboard uses a professional dark-themed SaaS-style design that is perfect for partner meetings, board presentations, and client reports. No Excel, Power BI, or any other software installation is required — simply open the HTML file in any modern browser.
Dashboard Pages Explanation
Overview Page
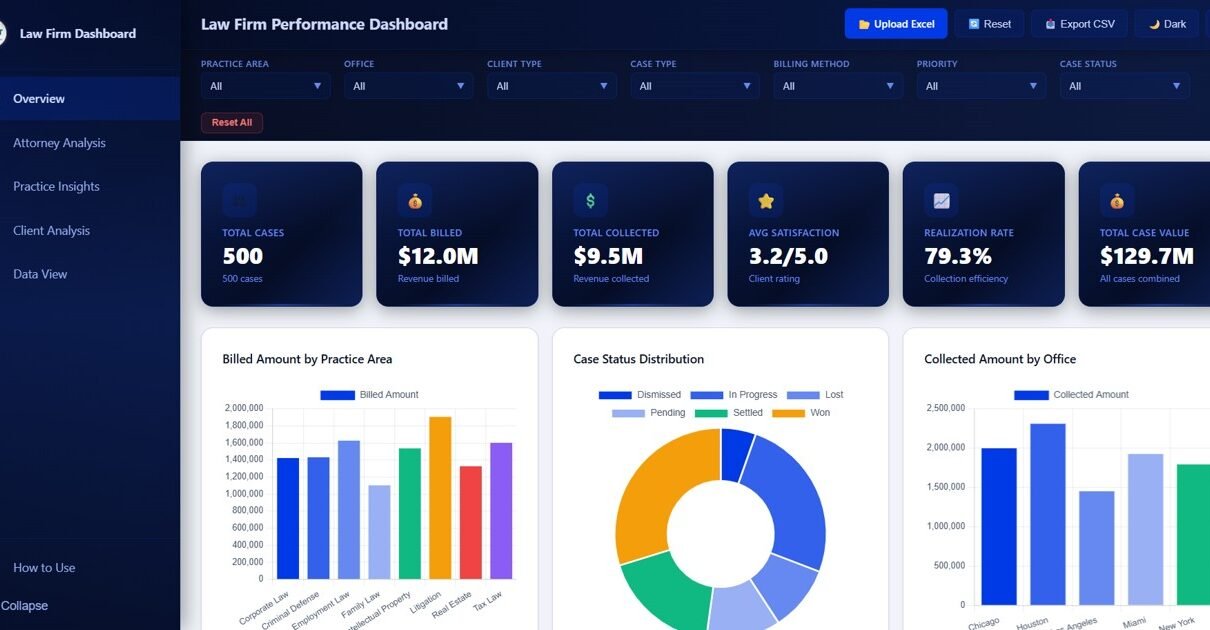
The Overview page is the command center of the Law Firm Performance Dashboard in HTML. At the top, you will find 6 KPI cards displaying Total Cases, Total Billed, Total Collected, Avg Satisfaction, Realization Rate, and Total Case Value. Below the KPI cards, there are 5 analytical charts: Billed Amount by Practice Area shows revenue distribution across different legal practice areas. Case Status Distribution displays the breakdown of cases by their current status. Collected Amount by Office compares collection performance across different office locations. Monthly Billing Trend tracks billing amounts over time to identify seasonal patterns. Case Value by Priority analyzes case values segmented by priority level. Multiple slicers allow you to filter the entire dashboard instantly.
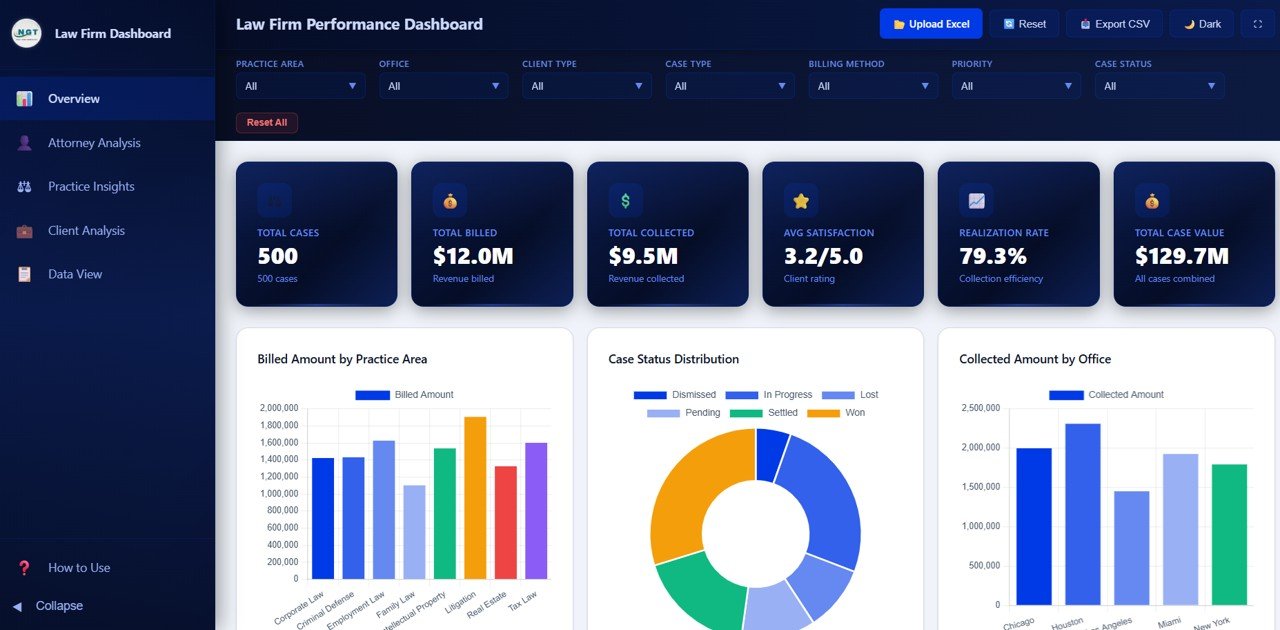
Law Firm Performance Dashboard Overview
Attorney Analysis
The Attorney Analysis page provides a deep dive into individual attorney performance metrics. This page includes 4 analytical charts: Billable Hours by Attorney compares the total billable hours logged by each attorney, helping identify workload distribution. Win Rate by Attorney shows the percentage of cases won by each attorney, essential for performance reviews. Billed vs Collected by Attorney compares billing amounts against actual collections for each attorney, revealing collection efficiency. Satisfaction Score by Attorney tracks client satisfaction ratings per attorney, valuable for quality management and client retention strategies.
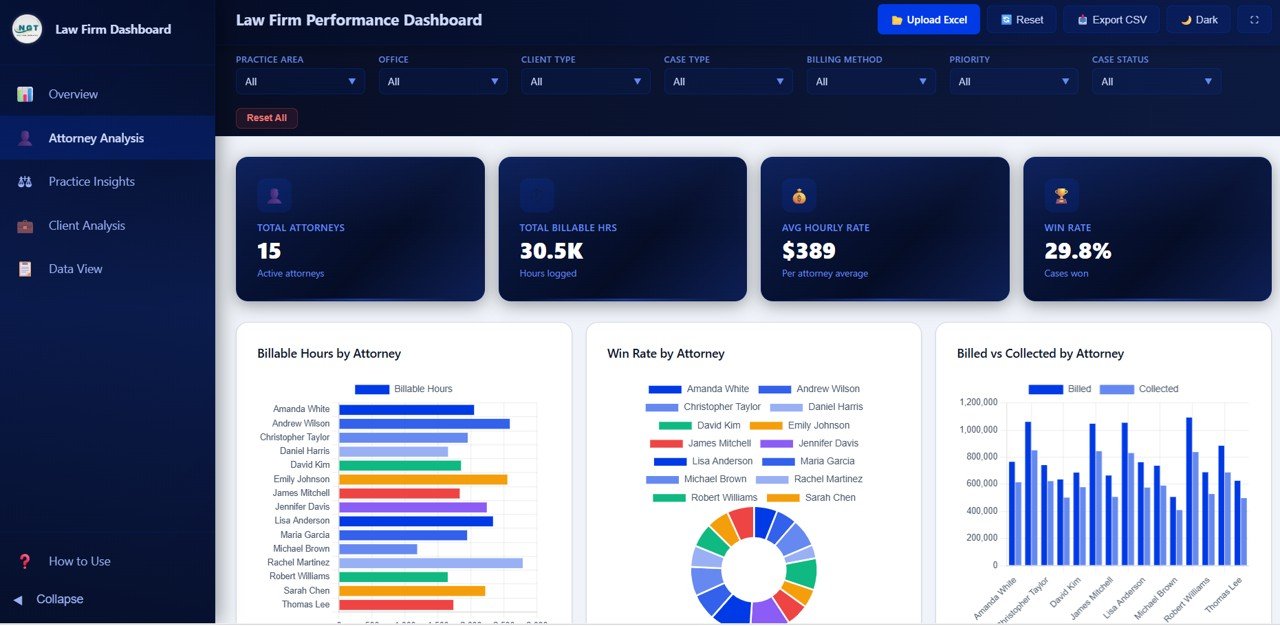
Attorney Analysis
Practice Insights
The Practice Insights page focuses on analyzing your law firm’s practice areas and billing methods. This page features 4 charts: Case Value by Practice Area reveals which practice areas generate the highest case values. Cases by Billing Method shows the distribution of cases across different billing arrangements such as hourly, contingency, and flat fee. Billed Amount by Case Type breaks down billing revenue by case type categories. Cases by Case Status provides a view of how cases are distributed across different status stages. These insights help law firm managers optimize practice area strategies and billing method selection.
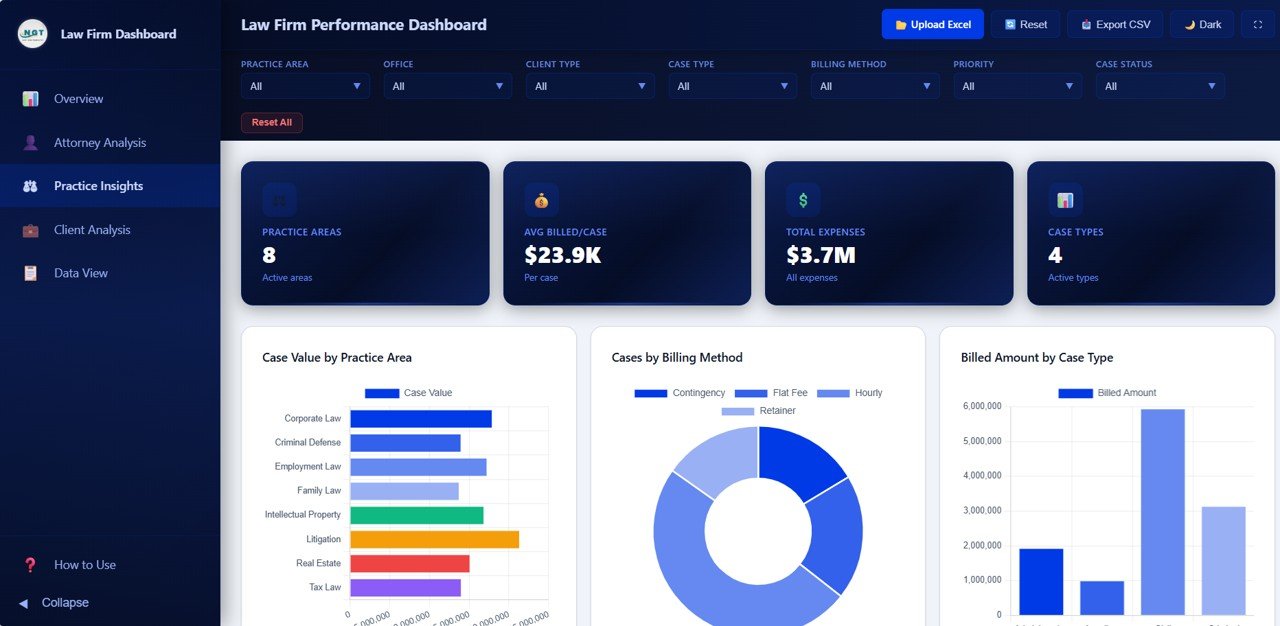
Practice Insights
Client Analysis
The Client Analysis page segments your client base to reveal profitability patterns and billing trends. This page includes 4 charts: Cases by Client Type shows the distribution of cases across different client categories such as corporate, individual, and government. Billed vs Collected by Client Type compares billing and collection performance by client segment. Case Value by Partner Group analyzes case values by the responsible partner group. Expenses by Client Type tracks operational expenses associated with each client category. These insights enable law firms to focus resources on the most profitable client segments and improve collection strategies.
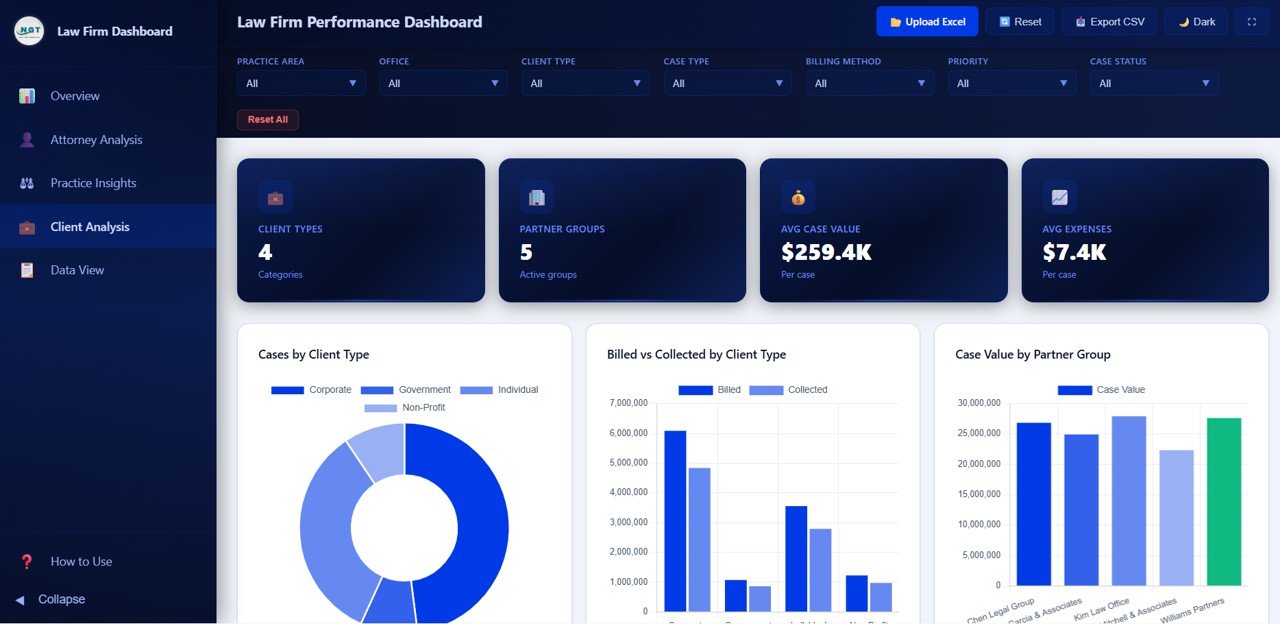
Client Analysis
Data View
The Data View page is a detailed data table page where you can see all records with search, sort, and pagination features. This page provides granular record-level access to your case data. You can search for specific cases using the search bar, sort columns in ascending or descending order, navigate through pages of records, and export the filtered data to CSV format for further analysis in spreadsheets or other tools. This makes the Data View page essential for auditing, compliance reporting, and detailed case-level investigation.
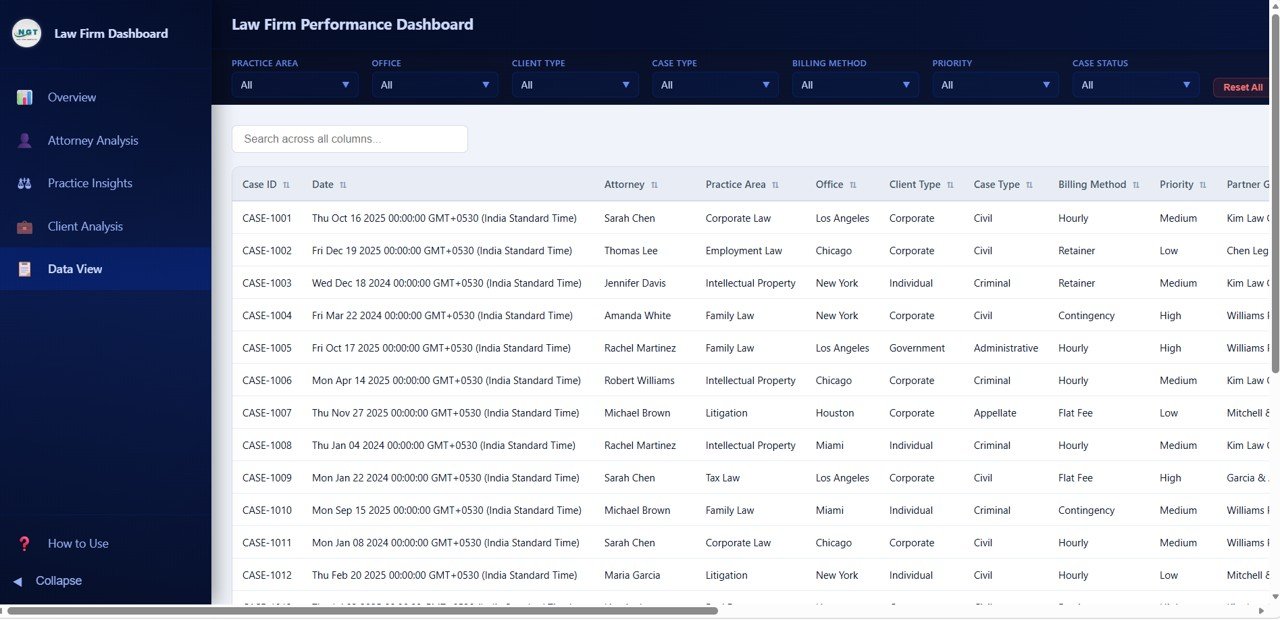
Data View
Advantages of the Law Firm Performance Dashboard in HTML
The Law Firm Performance Dashboard in HTML offers several advantages over traditional legal analytics tools. First, it requires zero software installation — simply open the file in any modern browser. Second, the responsive design works on desktops, laptops, and tablets, making it accessible from anywhere. Third, the interactive filters and slicers allow instant drill-down analysis without any technical skills. Fourth, the CSV export feature from the Data View page enables easy data sharing and integration with other tools. Fifth, the professional dark-themed design is presentation-ready for partner meetings and client reports. Finally, the template includes realistic sample data so you can explore the dashboard immediately before adding your own records.
Opportunities for Improvement
While the Law Firm Performance Dashboard in HTML is feature-rich, there are areas where users might want to extend it further. Adding a dedicated financial trends page with monthly revenue vs expense comparisons would enhance financial planning capabilities. Integrating automated data import from practice management systems like Clio or PracticePanther would streamline data entry. Adding team-level grouping for multi-office firms with regional comparisons could benefit larger organizations. Including benchmark comparisons against industry averages would add context to KPI values. Users with JavaScript knowledge can customize the charts, add new pages, or modify the color scheme to match their firm’s branding.
Best Practices
To get the most out of the Law Firm Performance Dashboard in HTML, follow these best practices. Update your case data regularly — ideally weekly or monthly — to keep the dashboard current and actionable. Use the interactive filters to isolate specific practice areas, attorneys, or client types for focused analysis during review meetings. Export data from the Data View page before important presentations to have backup documentation. Share the dashboard file with partners and team leads for collaborative review. Compare monthly billing trends over time to identify seasonal patterns and plan resource allocation accordingly. Use the attorney analysis page during annual reviews to support performance evaluations with data-driven insights.
Explore Relevant Templates
If you found the Law Firm Performance Dashboard in HTML useful, explore these related templates on NextGenTemplates:
- Law Firm Performance Dashboard in Power BI — The same law firm analytics powered by Power BI with interactive slicers and DAX-driven visuals.
- Law Firm Performance Dashboard in Excel — Pivot-powered law firm analytics in Excel with automatic refresh and slicer filtering.
- Arbitration and Mediation Dashboard in Excel — Track dispute resolution cases, claim amounts, and settlement outcomes with interactive charts.
- Legal Dashboard in Power BI — Track legal cases, costs, and performance with interactive Power BI visuals.
Frequently Asked Questions
What KPIs does the Law Firm Performance Dashboard in HTML track?
The Law Firm Performance Dashboard in HTML tracks 6 key performance indicators on the Overview page: Total Cases, Total Billed, Total Collected, Avg Satisfaction, Realization Rate, and Total Case Value. Additional analysis pages provide breakdowns by attorney, practice area, client type, billing method, and monthly trends across 5 interactive pages.
Do I need any software to use this HTML dashboard?
No. Simply open the index.html file in any modern web browser such as Chrome, Firefox, Edge, or Safari. No Excel, Power BI, or any other software installation is required. The dashboard works entirely in your browser.
Can I customize the dashboard with my own law firm data?
Yes. Replace the sample data in the included data file with your own law firm case records. All charts, KPI cards, and visuals update automatically based on the new data without any coding required.
How many dashboard pages are included in this template?
This template includes 5 interactive pages — Overview, Attorney Analysis, Practice Insights, Client Analysis, and Data View — each designed to provide focused insights into different aspects of law firm operations and performance.
What is the best HTML dashboard template for tracking law firm performance?
The Law Firm Performance Dashboard in HTML from NextGenTemplates is one of the most comprehensive browser-based law firm analytics templates available. It covers billing, collections, attorney productivity, practice area revenue, client analysis, and data export across 5 interactive pages with dynamic filtering capabilities.
Conclusion
The Law Firm Performance Dashboard in HTML is a powerful, ready-to-use analytics solution for any law firm that wants to gain instant visibility into billing, collections, attorney performance, and client profitability. With 5 interactive pages, 6 KPI cards, and dynamic filtering, this template transforms complex legal data into clear, actionable insights. Open it in any browser, replace the sample data, and start making data-driven decisions today.
Click here to Purchase the Law Firm Performance Dashboard in HTML
Visit our YouTube channel for step-by-step video tutorials: Youtube.com/@NeoTechNavigators