Personal Finance Dashboard in HTML is a browser-based, interactive analytics template that empowers individuals, families, and financial professionals to take complete control of their income, expenses, savings, budgets, and transaction activity — all from one centralized dashboard that opens in any modern web browser. This ready-to-use HTML Dashboard Template includes 5 interactive pages with 6 KPI cards, category analysis, trend charts, account comparisons, and a full data view for comprehensive personal finance tracking.
Whether you are a working professional managing monthly budgets, a freelancer tracking income from multiple sources, or a financial coach providing clients with visual analytics, this Personal Finance Dashboard in HTML delivers clear, actionable insights without requiring any software installation. Simply unzip the file, open index.html in your browser, and start analyzing your finances instantly.
Click to buy personal finance dashboard in html
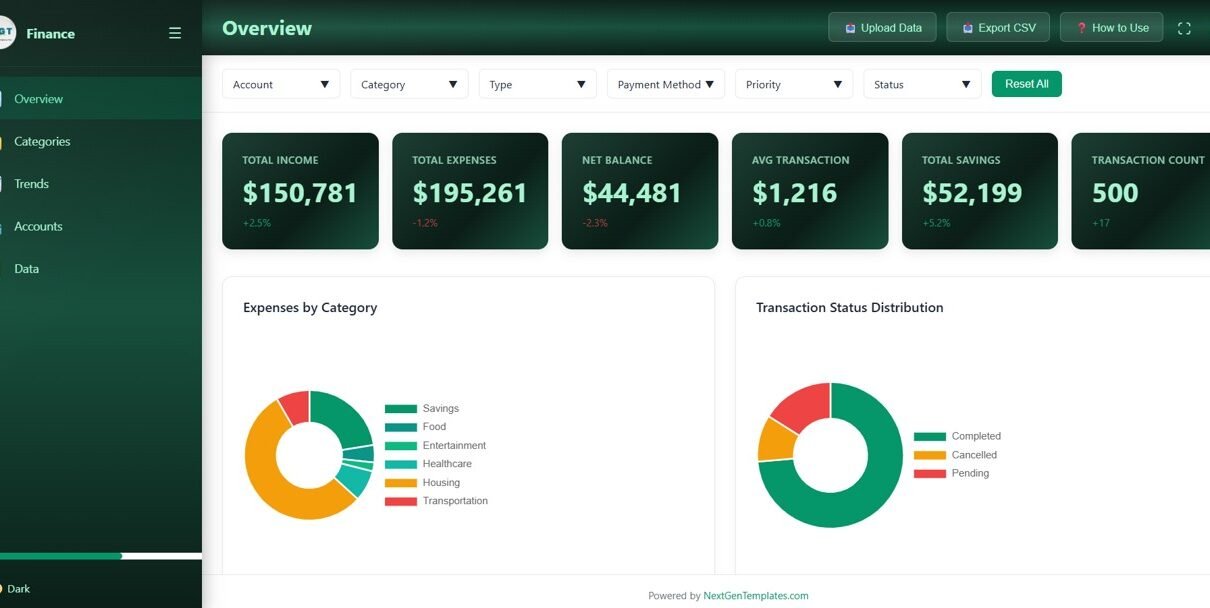
The Personal Finance Dashboard in HTML is packed with powerful features designed to make personal finance management effortless and insightful. This template includes 5 interactive dashboard pages that collectively track 6 key financial metrics: Total Income, Total Expenses, Net Balance, Avg Transaction, Total Savings, and Transaction Count.
The dashboard provides category-level spending analysis with Amount by Category and Budget Allocated vs Actual Expense comparisons. It features Monthly Income vs Expense Trend and Monthly Savings Contribution charts for tracking financial patterns over time. Account-level insights include Expense by Payment Method and Account Balance Comparison visuals. A full data view with search functionality allows you to browse and find specific transaction records. Multiple slicer filters enable instant drill-down into specific categories, accounts, or time periods.
The template works in any modern web browser without any software installation, and data replacement is simple — swap the sample dataset with your own records and everything updates automatically. If you prefer working in spreadsheets, explore the Personal Finance Dashboard in Excel for a pivot-table-powered alternative.
Dashboard Pages Explanation
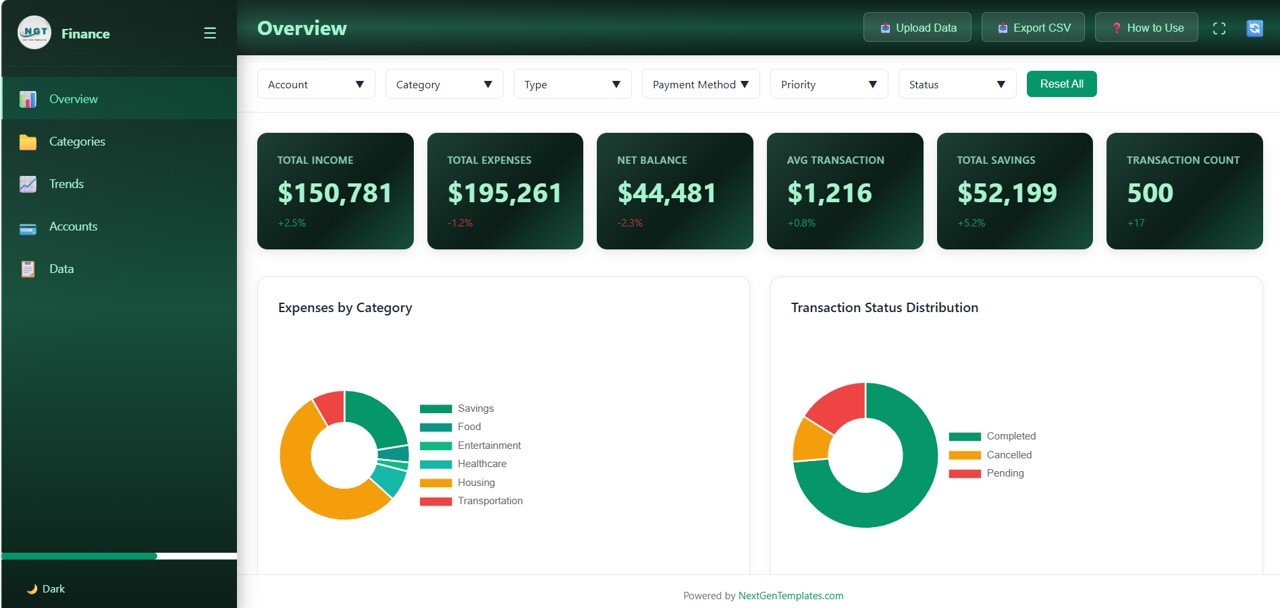
1. Overview Page
The Overview page is the main landing page that displays 6 KPI cards at the top — Total Income, Total Expenses, Net Balance, Avg Transaction, Total Savings, and Transaction Count — giving you an instant executive summary of your financial health. Below the cards, interactive charts show Expenses by Category, which breaks down where your money goes across spending categories, and Transaction Status Distribution, which displays the proportion of completed, pending, and other transaction statuses. Multiple slicer filters let you quickly drill down into specific dimensions for targeted analysis.
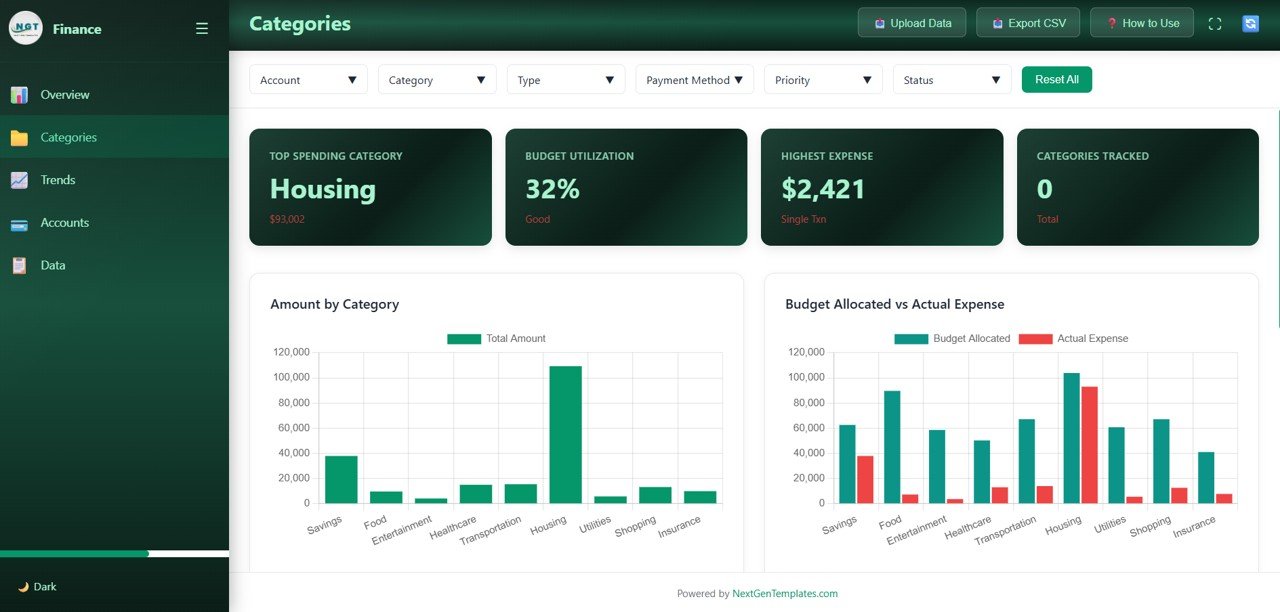
2. Categories
The Categories page provides a deep-dive into category-level financial metrics. It features Amount by Category, which reveals which spending categories consume the most of your budget, and Budget Allocated vs Actual Expense, which compares your planned budget against real spending to identify variances and uncover opportunities for savings. This page is essential for understanding your spending habits and making informed budget adjustments.
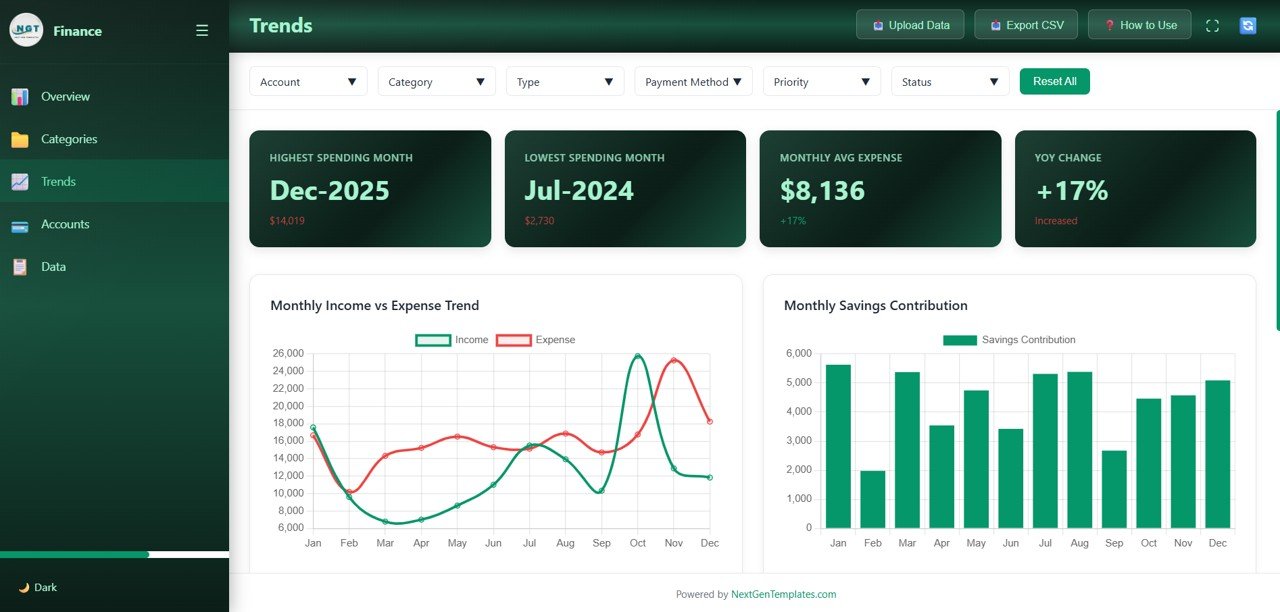
3. Trends
The Trends page helps you analyze your financial trajectory over time. It features Monthly Income vs Expense Trend, which tracks how your earnings compare to spending month by month, and Monthly Savings Contribution, which monitors how much you save each month to build long-term financial security. These trend charts are invaluable for spotting financial patterns and adjusting your strategy accordingly.
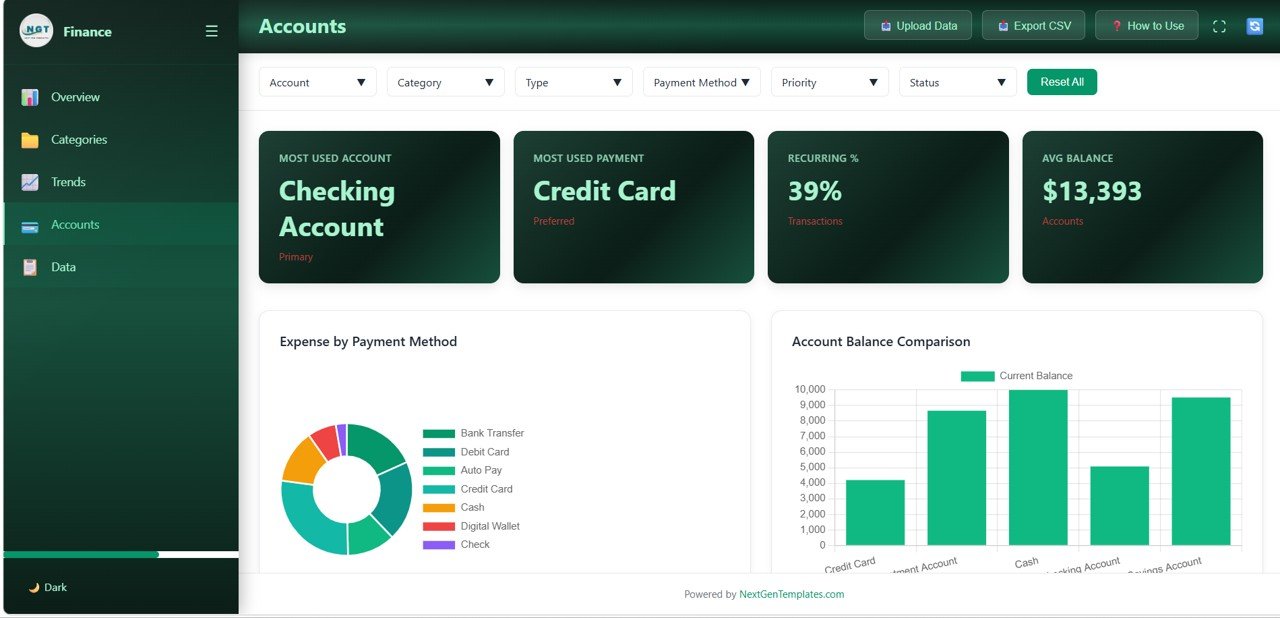
4. Accounts
The Accounts page lets you compare your financial accounts side by side. Expense by Payment Method shows how spending is distributed across cash, credit card, bank transfer, and other payment channels. Account Balance Comparison provides a clear view of how your various accounts stack up, enabling better cash management and allocation decisions.
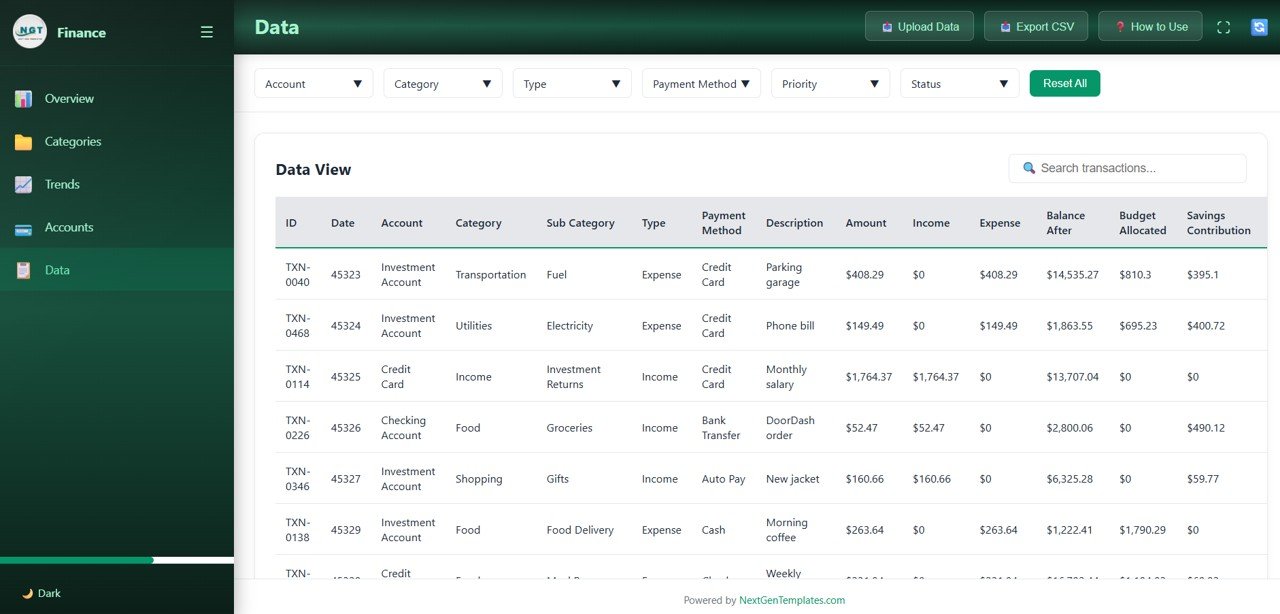
5. Data
The Data page provides a comprehensive transaction data view with search functionality. You can browse all financial records, search for specific transactions, and review detailed information for audits, compliance, or personal record-keeping. This page ensures complete transparency into every financial transaction tracked by the dashboard.
Advantages of Personal Finance Dashboard in HTML
This dashboard offers several compelling advantages for personal finance management. It requires zero software installation — just a web browser — making it accessible on any device. The 5-page structure provides both high-level overview and granular detail across categories, trends, accounts, and raw data. Dynamic slicer filters allow instant filtering without modifying underlying data. The visual KPI cards provide at-a-glance financial health monitoring. Data replacement is simple and the entire dashboard auto-refreshes with your own records. It complements other platforms too — users who want advanced analytics can pair it with the Personal Finance Dashboard in Power BI.
Opportunities for Improvement
While the dashboard is comprehensive, users could enhance it by adding custom expense subcategories for more granular tracking. Integration with external data feeds could automate data entry. Adding goal-setting features for savings targets would strengthen financial planning capabilities. Users with web development knowledge can extend the dashboard with additional charts or pages to match their specific needs.
Best Practices
To get the most from the Personal Finance Dashboard in HTML, update your financial data regularly — ideally weekly or monthly — to maintain accurate insights. Use the slicer filters to focus on specific time periods or categories during your analysis. Compare the Budget Allocated vs Actual Expense chart monthly to identify and correct overspending early. Review the Trends page quarterly to assess whether your savings contributions are meeting your goals. Keep your transaction categories consistent for reliable trend analysis over time.
Explore Relevant Templates
If you found the Personal Finance Dashboard in HTML useful, explore these related templates from NextGenTemplates:
- Personal Finance Dashboard in Excel — The Excel version with pivot tables, interactive charts, and 7 sheets for comprehensive personal finance tracking.
- Personal Finance Dashboard in Power BI — The Power BI version with advanced analytics, dynamic slicers, and 5 interactive pages.
- Personal Finance KPI Scorecard in Excel — A KPI-focused scorecard that monitors your financial health with monthly targets and actuals.
- Training and Development Dashboard in HTML — Another browser-based HTML dashboard for HR and training analytics.
Frequently Asked Questions
What metrics does the Personal Finance Dashboard in HTML track?
The Personal Finance Dashboard in HTML tracks 6 key metrics on the Overview page: Total Income, Total Expenses, Net Balance, Avg Transaction, Total Savings, and Transaction Count. Additional analysis across 5 interactive pages covers category breakdowns, monthly income vs expense trends, savings contributions, payment method analysis, and account balance comparisons.
Do I need any software to use this HTML dashboard?
No. Simply unzip the downloaded file and open index.html in any modern web browser like Chrome, Firefox, Edge, or Safari. No Excel, Power BI, or additional software installation is needed.
Can I replace the sample data with my own financial data?
Yes. The dashboard is designed for easy data replacement. Update the data file included in the download with your own financial records, and all charts, KPIs, and tables refresh automatically.
How many dashboard pages are included in this template?
This template includes 5 interactive dashboard pages: Overview, Categories, Trends, Accounts, and Data. Each page focuses on a specific dimension of personal finance analytics.
What is the best HTML template for tracking personal finances?
The Personal Finance Dashboard in HTML from NextGenTemplates is an ideal choice. It features 5 interactive pages, 6 KPI cards, category analysis, trend charts, account comparisons, slicer filters, and a full data view — making it one of the most comprehensive browser-based personal finance analytics tools available.
How does this compare to the Excel and Power BI versions?
The HTML version works directly in a browser with no software needed. The Excel version offers pivot-table-powered analysis with 7 sheets, while the Power BI version provides advanced interactive analytics. All three track the same core personal finance metrics but differ in their platform and analytical capabilities. Choose based on your preferred tool and technical comfort level.
Conclusion
The Personal Finance Dashboard in HTML is a powerful, browser-based financial analytics tool that brings together income tracking, expense analysis, budget comparisons, trend monitoring, and transaction management into 5 clean, interactive pages. With 6 KPI cards, category-level insights, monthly trend charts, account comparisons, and a full searchable data view, this template provides everything you need to take control of your personal finances — without installing any software.
Click here to Purchase Personal Finance Dashboard in HTML
Visit our YouTube channel for step-by-step video tutorials: Youtube.com/@NeoTechNavigators
Click to buy personal finance dashboard in html