🛍️ Click here to Purchase Procurement Management Dashboard in Google Sheets
Procurement teams at mid-size organizations typically manage 50-300 purchase orders per month across 10-40 suppliers, yet 62% still track this data in disconnected spreadsheets or email threads. The Procurement Management Dashboard in Google Sheets consolidates 4 procurement KPIs, 10 interactive charts, and a PO search tool into 6 structured pages — giving procurement managers, operations directors, and finance teams a single browser-based view of spend, approvals, suppliers, and contracts. Setup takes under 10 minutes, and every chart updates automatically when you replace the sample data.
🌍 Join 8,400+ teams in 40+ countries using NextGenTemplates to replace paid SaaS tools with one-time-purchase Excel, Google Sheets, Power BI, and HTML templates.
✅ Instant download · One-time payment · No subscription · No per-user fees · Lifetime access
Key Features of Procurement Management Dashboard in Google Sheets
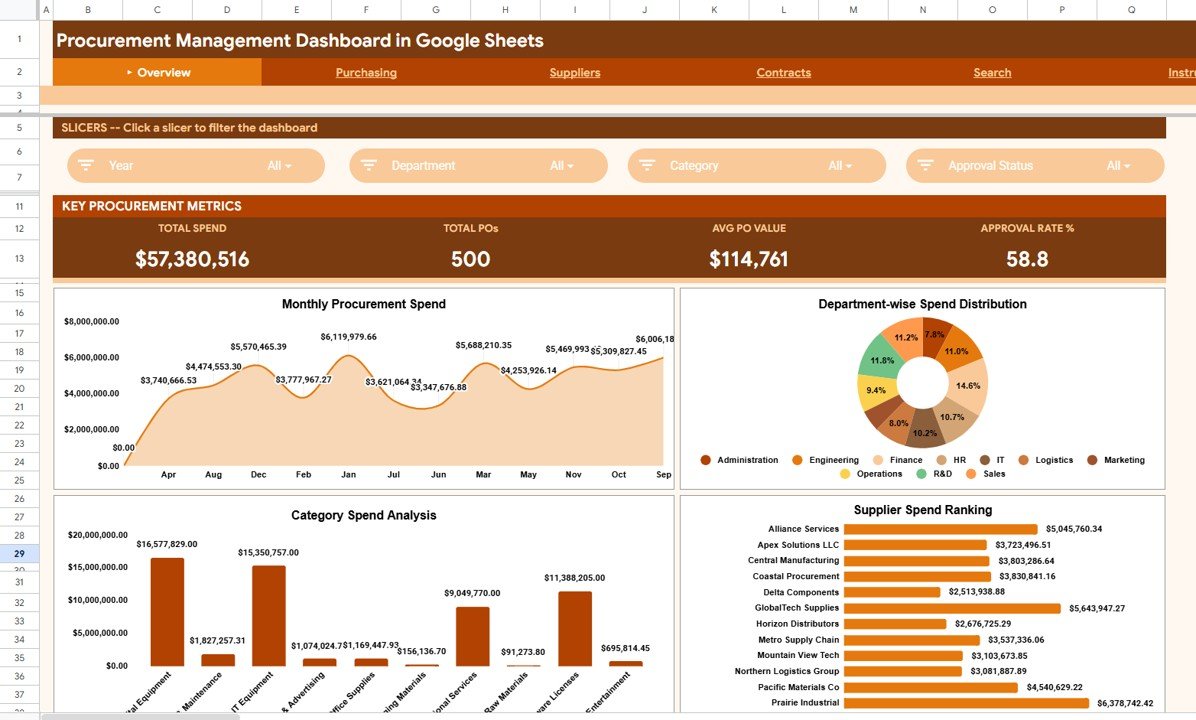
The Procurement Management Dashboard in Google Sheets delivers complete procurement visibility across 6 dedicated worksheets. The Overview page displays 4 KPI cards — Total Spend, Total POs, Avg PO Value, and Approval Rate % — alongside 4 charts covering monthly spend trends, department-wise distribution, category-level analysis, and supplier rankings. Multiple slicers let you filter the entire dashboard by department, supplier, category, or approval status in one click.
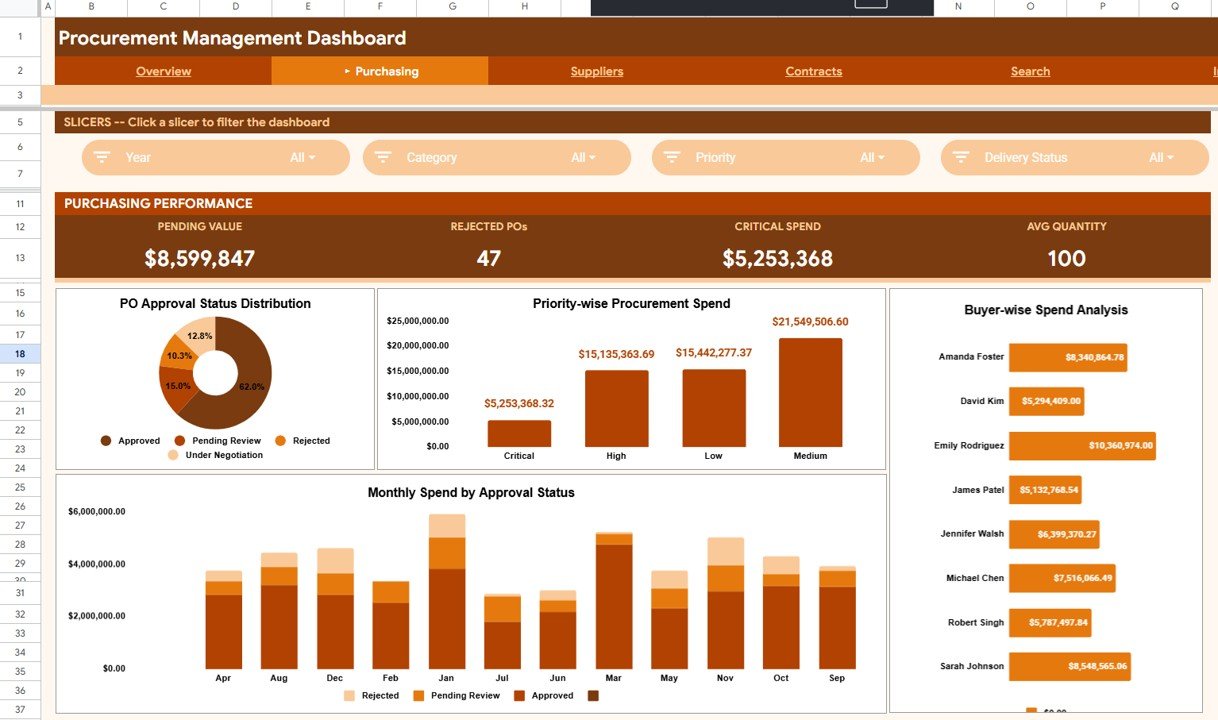
The Purchasing page provides 4 charts focused on PO approval workflows: Approval Status Distribution by Approval Status, Priority-wise Procurement Spend by Priority, Buyer-wise Spend Analysis by Buyer, and Monthly Spend by Approval Status by Month. This is where procurement leads identify approval bottlenecks and monitor buyer-level spending patterns.
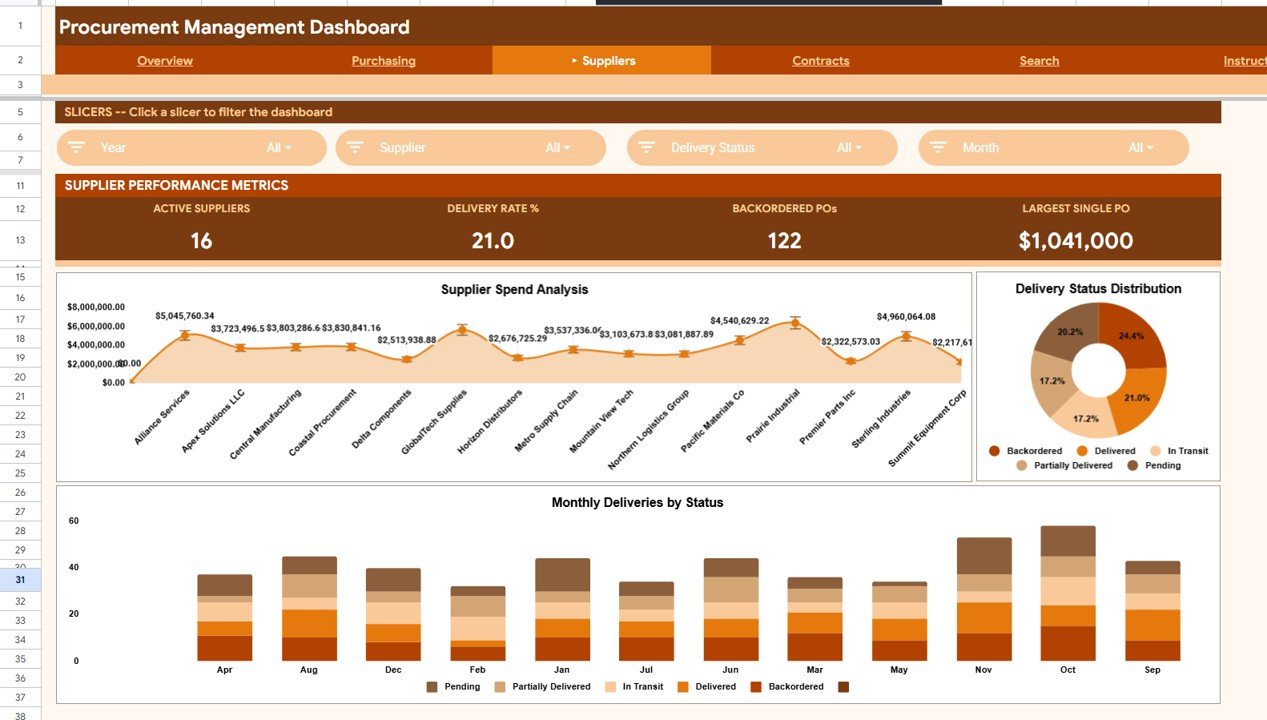
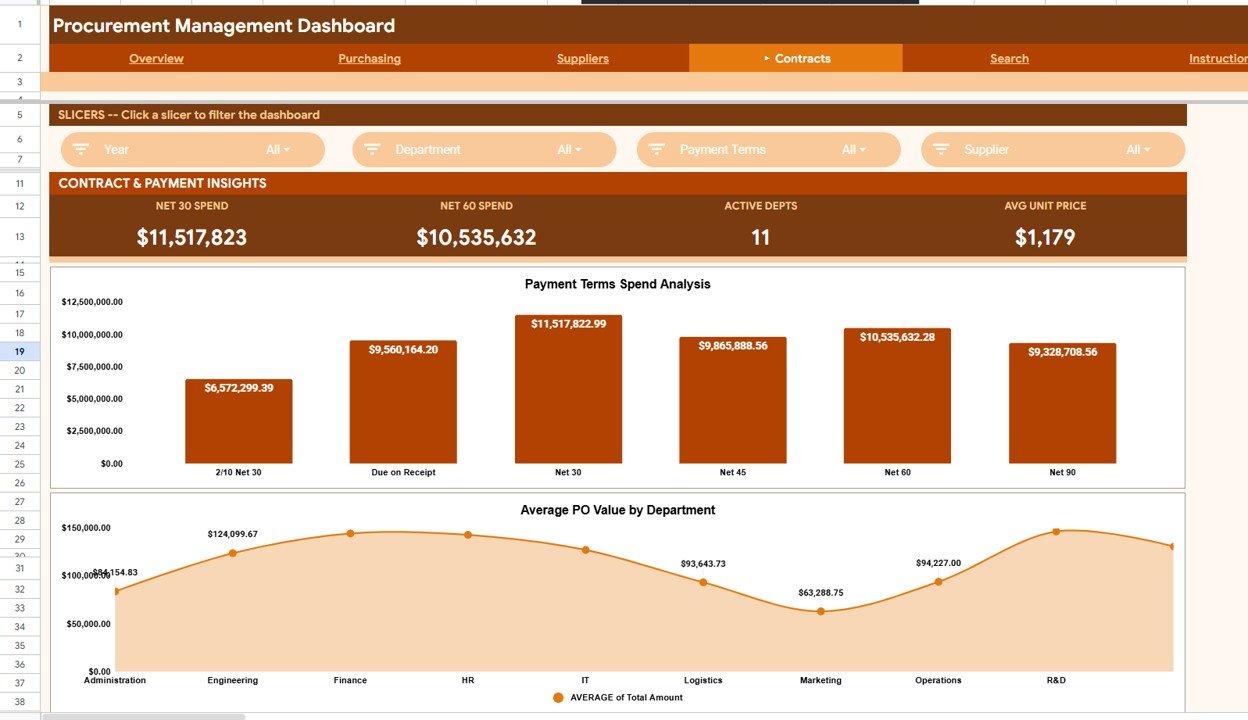
The Suppliers page tracks supplier reliability with 3 charts: Supplier Spend Analysis by Supplier, Delivery Status Distribution by Delivery Status, and Monthly Deliveries by Status by Month. The Contracts page adds 2 more views covering Payment Terms Spend Analysis by Payment Terms and Average PO Value by Department. A dedicated Search page lets you look up any PO by number and view the complete PO Details — supplier, amount, department, approval status, and delivery information — without scrolling through the raw data.
Dashboard Pages Explanation
🛍️ Click here to Purchase Procurement Management Dashboard in Google Sheets
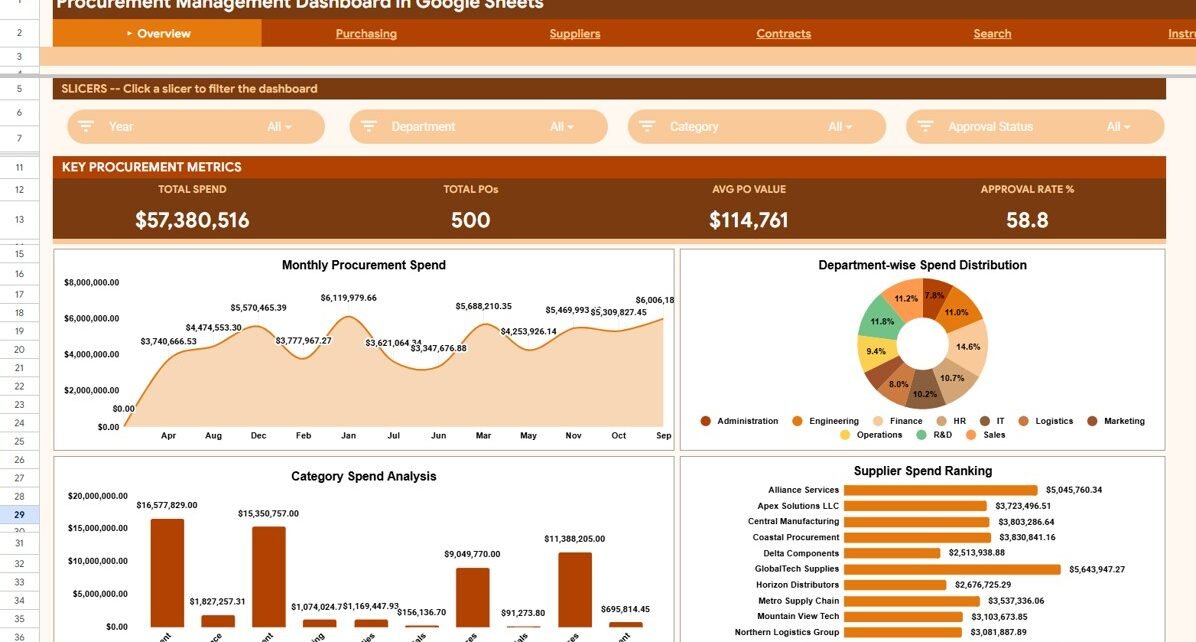
Overview Page
The Overview page is the executive summary of your procurement operations. At the top, 4 KPI cards show Total Spend, Total POs, Avg PO Value, and Approval Rate %. Below the cards, 4 charts visualize procurement performance across time, departments, categories, and suppliers. Slicers on the page enable instant filtering — select a specific department or supplier and every chart recalculates in real time. This is the page you open in your Monday procurement review meeting.
Procurement Management Dashboard in Google Sheets
Purchasing Page
The Purchasing page drills into purchase order operations with 4 focused charts. PO Approval Status Distribution shows the share of approved, pending, and rejected POs. Priority-wise Procurement Spend reveals how spending breaks down across urgency levels. Buyer-wise Spend Analysis identifies which buyers are generating the most spend, and Monthly Spend by Approval Status tracks approval workflow performance over 12 months. Procurement managers use this page to flag slow approval chains and redistribute workload across buyers.
Purchasing Page
Suppliers Page
The Suppliers page evaluates vendor performance with 3 charts. Supplier Spend Analysis ranks vendors by total purchase order value. Delivery Status Distribution shows the share of on-time, delayed, and pending deliveries across all suppliers. Monthly Deliveries by Status tracks delivery reliability trends over 12 months. This view is used during quarterly vendor reviews and contract renegotiations — the delivery trend chart alone can justify a supplier switch or a performance penalty clause.
Suppliers Page
Contracts Page
The Contracts page provides financial visibility with 2 charts. Payment Terms Spend Analysis shows how procurement spend distributes across payment terms (Net 30, Net 60, Net 90, etc.) — helping finance teams understand cash flow exposure. Average PO Value by Department reveals which departments carry the highest average purchase order size, surfacing potential negotiation opportunities for bulk discounts.
Contracts Page
Search Page
The Search page is a PO lookup tool. Select any Purchase Order number from the dropdown and the page displays the complete PO Details for the selected PO — including supplier name, amount, department, category, priority, approval status, buyer, payment terms, and delivery status. Built for quick audits, vendor follow-ups, and finance reconciliations without navigating the raw data sheet.
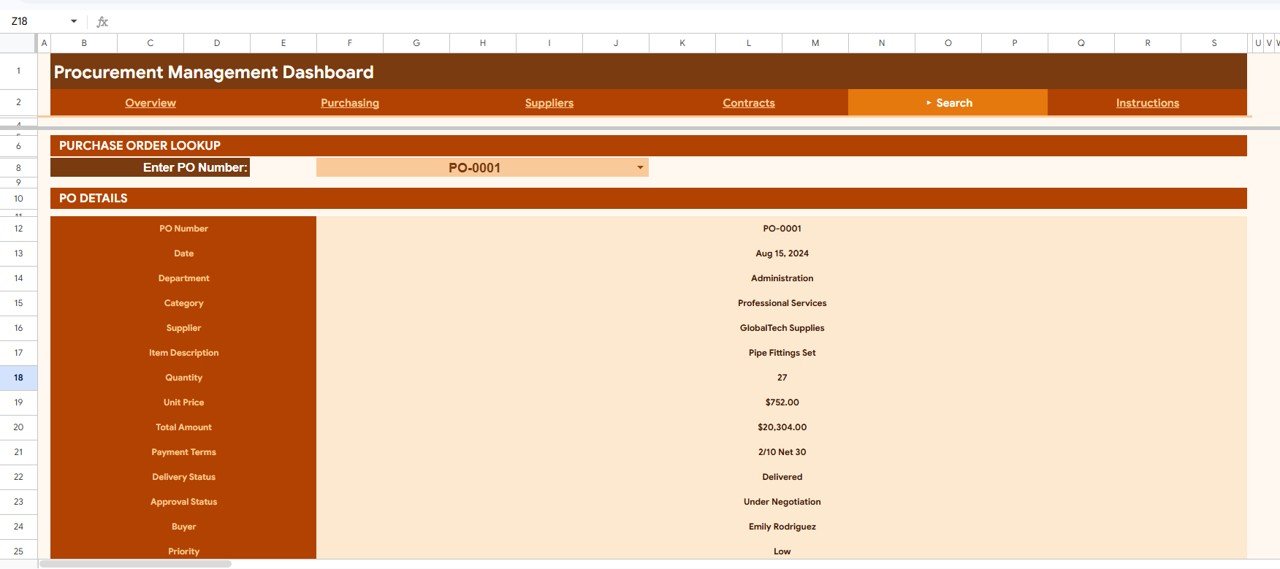
Search Page
Data Sheet
The Data sheet is the centralized input hub. Enter your purchase order records in the predefined column structure — PO Number, Date, Department, Supplier, Category, Amount, Priority, Approval Status, Buyer, Payment Terms, and Delivery Status. All 5 dashboard pages pull from this single source of truth. Replace the sample data with your own records and every chart, KPI card, and slicer updates automatically.
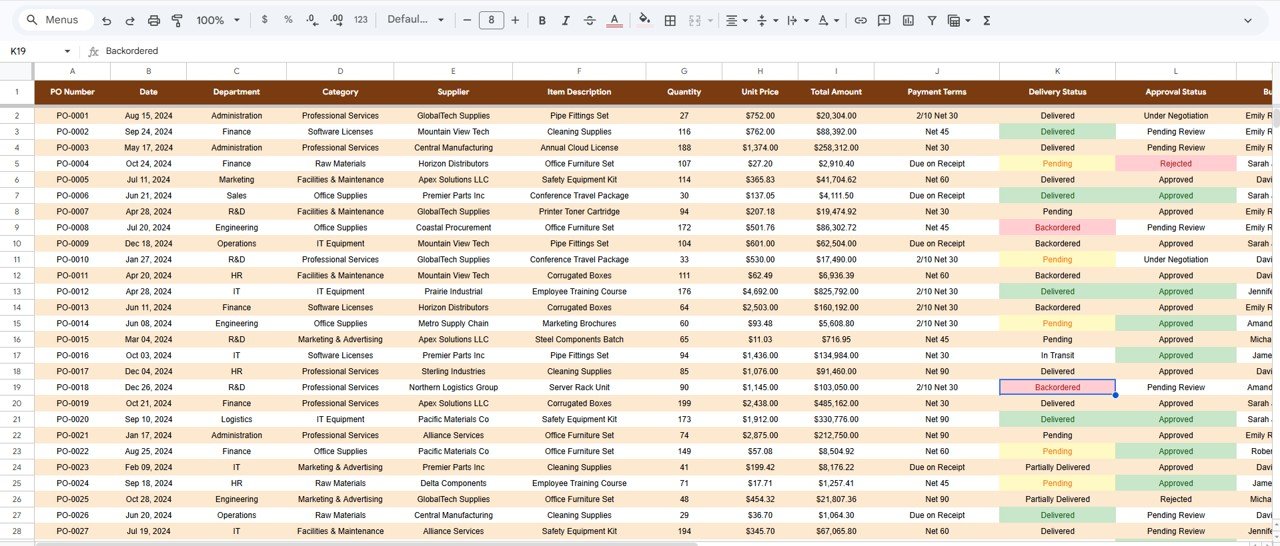
Data Sheet tab
Procurement Management Dashboard in Google Sheets vs. Microsoft Excel Dashboard vs. Coupa / SAP Ariba — Feature Comparison
| Feature | Procurement Management Dashboard (Google Sheets) | Microsoft Excel Dashboard | Coupa / SAP Ariba |
|---|---|---|---|
| Cost | $9.99 one-time | $14.99+ one-time | $50-200 / user / month |
| Platform | Google Sheets (free) | Microsoft Excel (license required) | Cloud SaaS (browser) |
| Setup Time | Under 10 minutes | 15-30 minutes | Weeks to months |
| Real-Time Collaboration | ✅ Built-in | Requires OneDrive/SharePoint | ✅ Yes |
| Mobile Access | ✅ Google Sheets app | Limited on mobile | ✅ Yes |
| PO Search/Lookup | ✅ Dedicated search page | Manual filtering | ✅ Built-in search |
| Customizable Fields | ✅ Fully editable | ✅ Fully editable | Limited without admin plan |
| Year-1 Cost at 5 Users | $9.99 total | $14.99 + Excel licenses | $3,000-12,000 |
| No IT Department Needed | ✅ Self-service | ✅ Self-service | ❌ IT setup required |
For procurement teams that want structured spend tracking and PO analysis without paying $50-200 per user per month, the Procurement Management Dashboard in Google Sheets sits in the sweet spot.
Who Should Use This Template
🛍️ Click here to Purchase Procurement Management Dashboard in Google Sheets
Perfect for:
- Procurement managers at organizations with 10-500 employees tracking purchase orders, supplier spend, and approval workflows
- Operations directors who need a shared, browser-based procurement dashboard for monthly spend reviews
- Finance teams monitoring payment terms distribution, department-level spending, and category-level procurement patterns
- Small business owners managing 5-50 suppliers without dedicated procurement software
- Consultants building procurement analytics frameworks for clients transitioning from manual PO tracking
Not a fit if:
- You run an enterprise procurement operation with 10,000+ POs per month needing real-time API integrations with SAP, Oracle, or Coupa
- Your organization requires SOC 2 compliance, audit trails, and role-based access control for procurement data
- You need automated supplier onboarding, three-way matching, and contract lifecycle management workflows
Real-World Use Cases
🛍️ Click here to Purchase Procurement Management Dashboard in Google Sheets
Rahul manages procurement at a 120-person manufacturing company in Pune. He tracks 200+ purchase orders per month across 15 suppliers using the Procurement Management Dashboard in Google Sheets. The Supplier Spend Ranking chart helped him identify that 3 suppliers accounted for 68% of total spend — leading to consolidated negotiations that reduced material costs by 12%. His team accesses the same Google Sheet from their browsers, replacing the email-based PO tracking they used before.
Jessica runs operations at a 40-person healthcare clinic in Chicago. She uses the Purchasing page to monitor PO approval bottlenecks — the Monthly Spend by Approval Status chart revealed that 22% of POs were stuck in pending status for 10+ days. After implementing a 3-day approval SLA based on this data, pending POs dropped to 8%. The template replaced a $150/month procurement add-on she was evaluating.
Ahmed is a procurement consultant helping mid-size retailers in Dubai. He duplicates this template for each client, customizes the Data sheet with their supplier and category lists, and delivers a branded procurement dashboard within a single 2-day engagement. The Search page is especially useful during vendor review meetings — clients can look up any PO number instantly without scrolling through raw data.
Advantages of Procurement Management Dashboard in Google Sheets
🛍️ Click here to Purchase Procurement Management Dashboard in Google Sheets
- Zero platform cost — Google Sheets is free for any Google account. The template costs $9.99 one-time with no recurring fees, versus $3,000-12,000 per year for enterprise procurement platforms.
- Built-in real-time collaboration — Unlike Excel, Google Sheets allows multiple users to view and edit simultaneously. Share a single link with your procurement team and eliminate version-control headaches.
- Dedicated PO search page — Look up any purchase order by PO number in seconds. No scrolling through 500 rows of data — select the PO number and see the complete details instantly.
- Customizable to any procurement structure — The Data sheet accepts any department names, supplier names, categories, buyers, and payment terms. All charts adapt automatically.
- Works on any device — Access the dashboard from desktop, tablet, or phone via the Google Sheets app.
Opportunities for Improvement
- The template does not connect to ERP or accounting systems automatically — you need to enter or paste purchase order data manually or use Google Sheets add-ons for data imports.
- For organizations with 1,000+ POs per month across 100+ suppliers, the single Data sheet may become dense. Consider splitting into monthly snapshots linked to a master summary.
- No built-in automated notifications for pending approvals — pair with Google Apps Script or a workflow tool if you need email alerts when POs exceed approval SLAs.
- The Search page looks up one PO at a time — bulk PO audits are better served by filtering the Data sheet directly.
Best Practices
🛍️ Click here to Purchase Procurement Management Dashboard in Google Sheets
- Standardize supplier names and department names before entering data — inconsistent naming (e.g., “IT” vs. “Information Technology”) creates duplicate entries in charts.
- Update the Data sheet weekly or bi-weekly to keep spend and delivery trend charts current.
- Use the Contracts page during budget planning season to analyze payment terms exposure and negotiate better terms with high-spend suppliers.
- Share the dashboard as view-only with executives and edit-access with the procurement team to maintain data integrity.
- Use the Suppliers page during quarterly vendor reviews to present delivery reliability trends and negotiate performance clauses.
Explore Relevant Templates
📊 Also available as: Procurement Management Dashboard in Excel and Procurement Management Dashboard in Power BI
📊 Vendor Contract Renewal Calendar in Google Sheets — Track vendor contract renewal dates with Annual, Monthly, and Daily calendar views
📊 Shared Services KPI Scorecard in Google Sheets — Monitor shared services performance across IT, HR, finance, and procurement
📊 Warehouse Efficiency Dashboard in Excel — Track fulfillment rate, pick time, and shipping cost across warehouses
📊 Billing Accuracy KPI Dashboard in Google Sheets — Track billing KPIs with MTD/YTD trend analysis
Browse all Google Sheets Dashboard Templates
Frequently Asked Questions
🛍️ Click here to Purchase Procurement Management Dashboard in Google Sheets
What KPIs does the Procurement Management Dashboard track?
The Procurement Management Dashboard in Google Sheets tracks 4 headline KPIs: Total Spend, Total POs, Avg PO Value, and Approval Rate %. It also includes 10 analytical charts across 4 analysis pages covering spend by department, supplier, category, buyer, approval status, priority, payment terms, and delivery status.
How long does setup take?
Setup takes under 10 minutes. Copy the template to your Google Drive, replace the sample data in the Data sheet with your purchase order records, and every chart and KPI card across all 6 pages refreshes automatically. No formulas to edit.
Can I customize the dashboard for my departments and suppliers?
Yes. The Data sheet accepts any department names, supplier names, categories, buyers, and payment terms you enter. All charts and slicers dynamically pick up new values — no structural modifications needed. For additional guidance on working with Google Sheets, refer to Google Sheets Help Center.
How does this compare to Coupa or SAP Ariba?
Coupa and SAP Ariba charge $50-200 per user per month and require weeks of implementation. The Procurement Management Dashboard in Google Sheets costs $9.99 one-time with no recurring fees. For teams processing under 500 purchase orders per month that need spend visibility and PO tracking, this template delivers the same analytics at a fraction of the cost.
Does this template work on mobile devices?
Yes. Since it runs on Google Sheets, you can access the dashboard from any device using the Google Sheets app. Review procurement spend, check PO status, and look up supplier details from your phone or tablet.
Can multiple team members use this dashboard simultaneously?
Yes. Google Sheets supports real-time collaboration. Multiple procurement team members can view the dashboard, enter data, and review charts at the same time — no file-sharing conflicts or version control issues.
Is there an Excel or Power BI version of this dashboard?
Yes. The Procurement Management Dashboard is also available as an Excel dashboard and a Power BI dashboard on NextGenTemplates — pick the format that matches your team’s tooling.
About the Author
Built by PK — Microsoft Certified Professional with 15+ years of Excel, Google Sheets, and Power BI experience. Founder of NextGenTemplates, reaching 300K+ subscribers across YouTube channels. Every template is hand-built and tested before release.
Conclusion
The Procurement Management Dashboard in Google Sheets gives procurement teams a structured, slicer-driven view of spend, approvals, suppliers, and contracts — across 6 pages with 10 charts and a PO search tool. For teams that need spend visibility without enterprise software overhead, this template delivers at $9.99 one-time with no subscription.
🛍️ Click here to Purchase Procurement Management Dashboard in Google Sheets
✅ Instant download · One-time payment · No subscription
🎥 Visit our YouTube channel for step-by-step tutorials: Youtube.com/@NeoTechNavigators