Property Management Dashboard in HTML is a browser-based, interactive dashboard template designed for property managers, landlords, real estate investors, and facility operations teams who want to monitor rent revenue, occupancy, maintenance costs, tenant satisfaction, and property performance from a single centralized interface. This ready-to-use HTML dashboard template includes 5 interactive pages — Overview, Financial Analysis, Property Insights, Maintenance Tracker, and Data View — delivering comprehensive property management analytics without any software installation.
Whether you manage a handful of residential units or an entire commercial property portfolio, this dashboard gives you instant visibility into occupancy trends, rent collection performance, maintenance spending, and lease status distributions. Simply unzip the file, open index.html in any modern browser, and start making data-driven property management decisions today.
Key Features of Property Management Dashboard in HTML
The Property Management Dashboard in HTML includes 5 interactive dashboard pages with 6 KPI cards on the Overview page: Total Properties, Total Rent Revenue, Occupancy Rate, Avg Monthly Rent, Total Maintenance Cost, and Avg Tenant Satisfaction. The dashboard provides interactive slicer-based filtering, financial analysis tools, property insights, maintenance tracking, and a data explorer with CSV export functionality.
This template is designed to help property management professionals track every critical metric without relying on expensive BI tools. All charts and KPI cards update dynamically based on the data you provide, and the interactive slicers let you drill down into specific property types, locations, buildings, and tenant segments instantly. It is one of the most comprehensive HTML dashboard templates available for the real estate industry.
Dashboard Pages Explanation
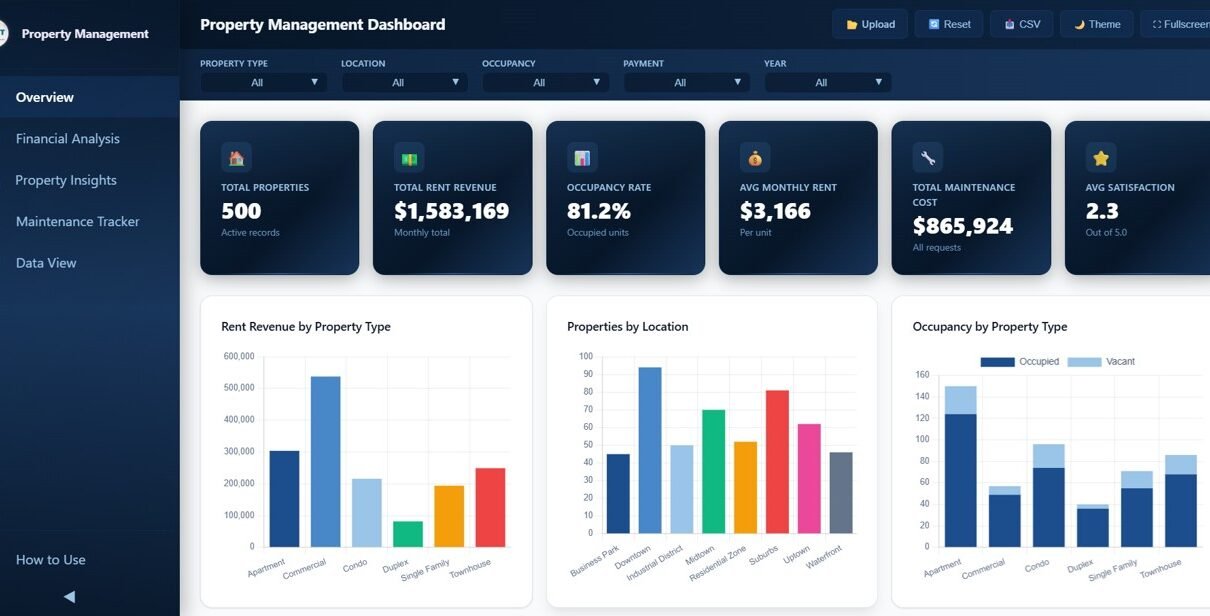
1 — Overview Page
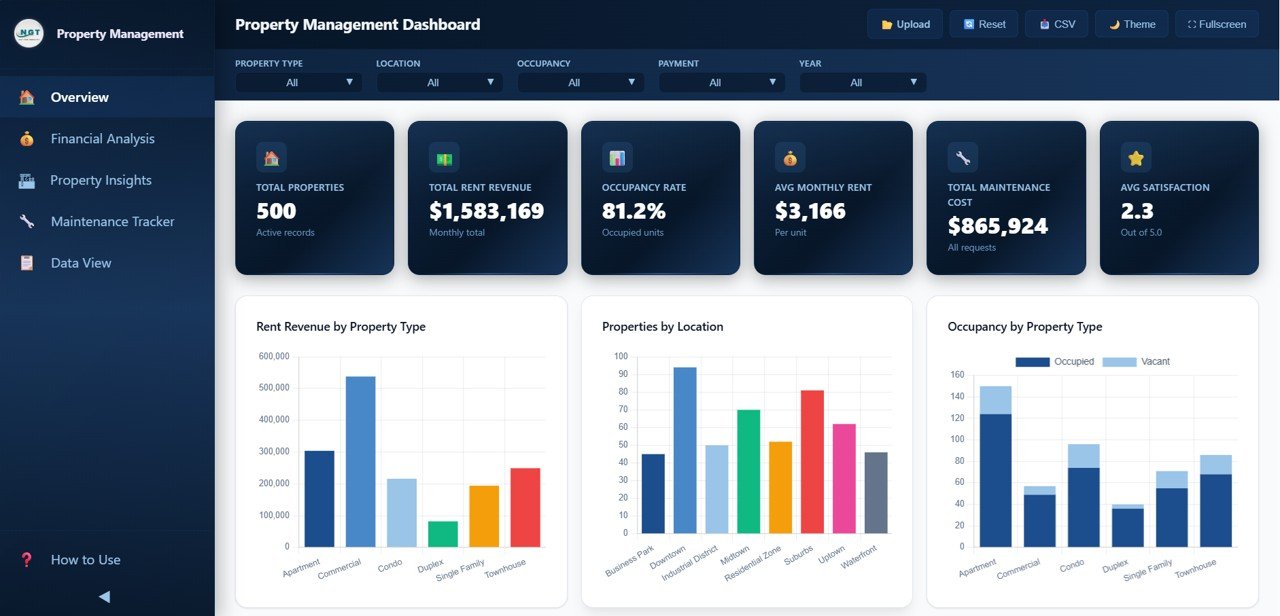
The Overview page serves as the main landing screen of the Property Management Dashboard in HTML. At the top, it displays 6 high-level KPI cards showing Total Properties, Total Rent Revenue, Occupancy Rate, Avg Monthly Rent, Total Maintenance Cost, and Avg Tenant Satisfaction. Below the cards, interactive charts visualize Rent Revenue by Property Type, Properties by Location, Occupancy by Property Type, Payment Status Distribution, and Monthly Rent Trend. Multiple slicers allow you to filter the entire dashboard quickly by property type, location, building, and other dimensions.
Property Management Dashboard in HTML
2 — Financial Analysis
The Financial Analysis page provides a deep-dive into the financial performance of your property portfolio. It includes charts for Collected vs Rent by Location, which helps identify collection gaps across different areas. The Payment Status by Property Type chart breaks down on-time, late, and pending payments by property category. Rent Revenue by Building shows which buildings contribute the most to your total revenue. The Monthly Revenue Trend by Year chart helps you understand seasonal revenue patterns and year-over-year growth. This page is essential for landlords and property managers who need to monitor cash flow and identify revenue leakage quickly.
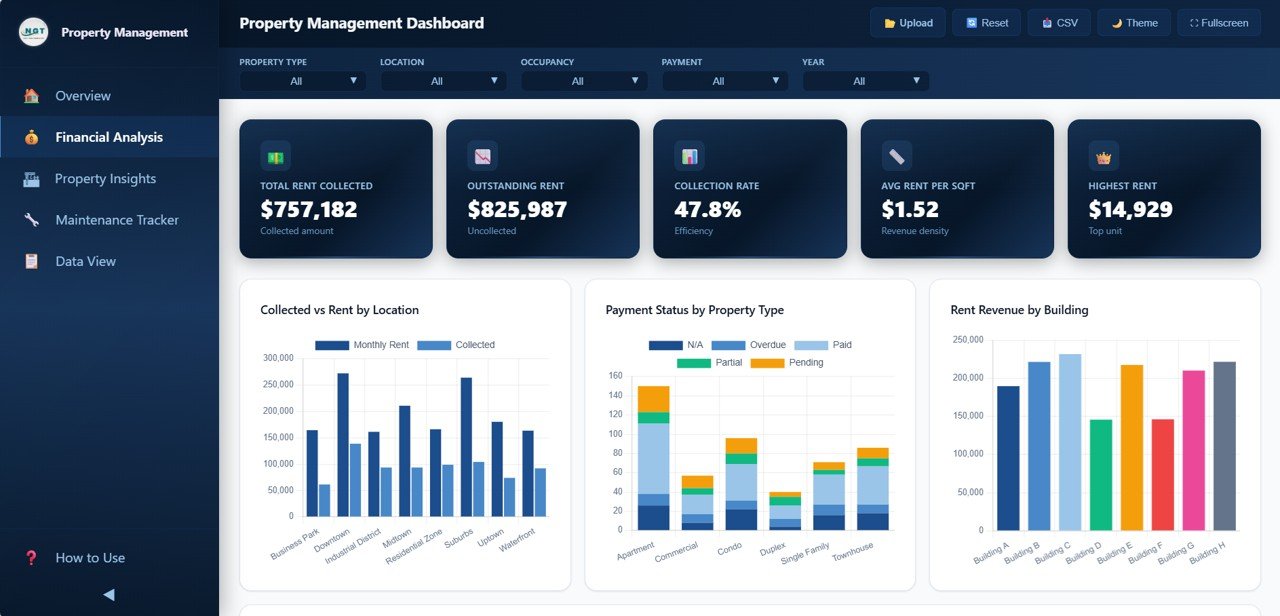
Financial Analysis
3 — Property Insights
The Property Insights page analyzes the composition and utilization of your property portfolio. Area by Property Type shows the total area distribution across different property categories. Properties by Tenant Type breaks down your portfolio by tenant segments such as residential, commercial, or mixed-use. The Bedrooms Distribution chart helps you understand the unit mix in your portfolio. Occupancy by Location reveals which locations have the highest and lowest occupancy rates. Lease Status Distribution shows the breakdown of active, expired, and pending leases across your properties. This page helps portfolio managers make informed decisions about property acquisitions and dispositions.
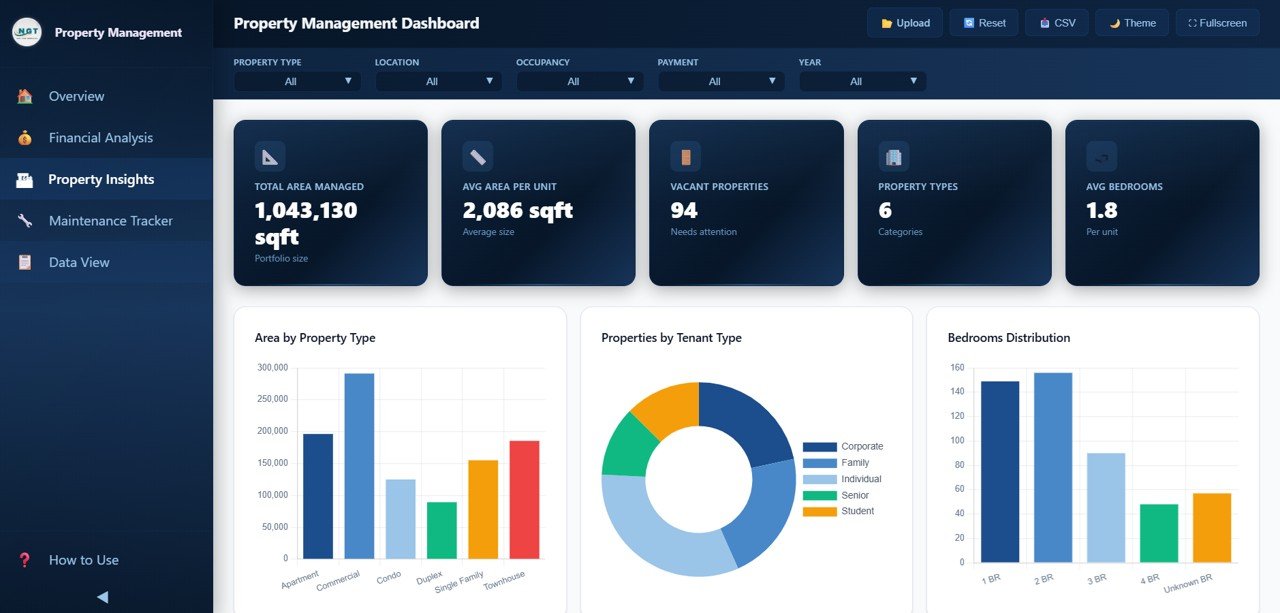
Property Insights
4 — Maintenance Tracker
The Maintenance Tracker page provides detailed visibility into property maintenance operations. Maintenance Cost by Type shows spending across different maintenance categories such as plumbing, electrical, HVAC, and general repairs. The Maintenance Status Distribution chart breaks down work orders by status — completed, in-progress, and pending. Priority Distribution shows how maintenance requests are distributed across high, medium, and low priority levels. Maintenance Cost by Building helps identify which properties consume the highest maintenance budgets. Monthly Maintenance Trend tracks spending over time to help you budget and forecast maintenance expenses accurately.

Maintenance Tracker
5 — Data View
The Data View page is the detailed data table page of the Property Management Dashboard in HTML. Here you can see all the property records displayed in a structured table format with search, sort, and pagination features. You can filter the data by any column and export the filtered results to CSV for use in other tools, presentations, or reports. This page gives property managers and analysts direct access to the underlying data powering the entire dashboard.

Data View Tab
Advantages of Property Management Dashboard in HTML
The Property Management Dashboard in HTML offers several distinct advantages for property management professionals. First, it requires absolutely no software installation — just open the HTML file in any modern browser and you are ready to analyze your data. Second, the template tracks 6 essential KPIs across 5 dedicated analysis pages, providing complete visibility into financial performance, occupancy, maintenance, and tenant satisfaction in one place.
Third, the interactive slicer and filter system lets you instantly narrow down your analysis to specific properties, locations, or property types without rebuilding charts or formulas. Fourth, the built-in CSV export from the Data View page makes it easy to share filtered data with stakeholders, accountants, or property owners. Finally, the professional SaaS-style design makes the dashboard suitable for both internal use and client-facing presentations.
Opportunities for Improvement
While the Property Management Dashboard in HTML delivers robust analytics out of the box, there are some areas where you could extend its capabilities. Adding tenant communication tracking or lease renewal forecasting modules would provide even deeper operational insights. Integration with accounting software via API connections could automate data entry and keep the dashboard always up-to-date. A mobile-responsive version would make it even more convenient for property managers who inspect properties on-site. Adding year-over-year comparison charts for maintenance costs and occupancy rates would enhance trend analysis capabilities.
Best Practices for Using This Dashboard
To get the most value from the Property Management Dashboard in HTML, update your data regularly — ideally weekly or monthly — so that KPIs and charts always reflect current performance. Use the slicer filters to compare performance across different property types and locations to identify underperforming assets. Review the Financial Analysis page monthly to catch collection issues early and follow up on late payments. Monitor the Maintenance Tracker page to ensure high-priority work orders are being addressed promptly. Export filtered data from the Data View page for board meetings or investor reports. Share the dashboard file with your property management team so everyone has access to the same performance data.
Explore Relevant Templates
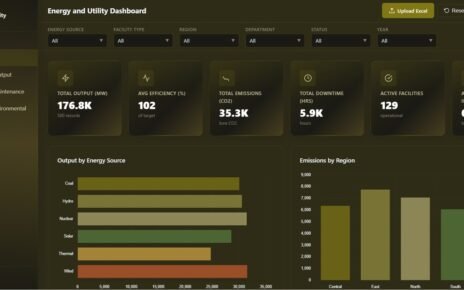
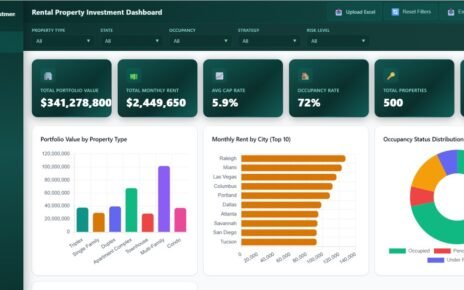
📌 Rental Property Investment Dashboard in HTML – Track rental income, portfolio value, ROI, risk assessment, and financing analytics in a browser-based dashboard.
📌 Real Estate Agent Dashboard in Excel – Monitor agent performance, commissions, market analysis, and property insights with 5 interactive pages.
📌 Rental Property Investment Dashboard in Google Sheets – Cloud-based rental property analytics with 6 interactive pages and real-time collaboration.
📌 Rental Property Investment Dashboard in Power BI – Advanced Power BI analytics for rental property portfolio management and ROI tracking.
Browse all our HTML Dashboard Templates and Real Estate Templates on NextGenTemplates.
Frequently Asked Questions
What KPIs does the Property Management Dashboard in HTML track?
The Property Management Dashboard in HTML tracks 6 key performance indicators: Total Properties, Total Rent Revenue, Occupancy Rate, Avg Monthly Rent, Total Maintenance Cost, and Avg Tenant Satisfaction. Additional analysis covers rent collection vs target, payment status, property type distribution, maintenance costs by building, occupancy by location, lease status, and monthly trends across 5 interactive dashboard pages.
Do I need any software to use this property management dashboard?
No. The Property Management Dashboard in HTML runs entirely in your web browser. Simply unzip the downloaded file and open index.html in Chrome, Firefox, Edge, or Safari. No installation, plugins, licenses, or coding skills are required.
Can I track multiple properties and buildings in this dashboard?
Yes. This dashboard is designed for multi-property portfolio management. You can track and compare performance across different buildings, locations, and property types using the interactive slicers and filters on each dashboard page.
What is the best HTML dashboard for property management?
The Property Management Dashboard in HTML from NextGenTemplates is one of the most comprehensive options available. It includes 5 interactive pages covering rent revenue, financial analysis, property insights, maintenance tracking, and a data explorer — all within a professionally designed, browser-based template that works without any software installation.
How do I customize the data in this dashboard?
Replace the sample data in the data file with your own property management records. The dashboard automatically updates all charts, KPIs, and filters based on the data you provide. You can also export filtered data from the Data View page to CSV for additional analysis or reporting.
Is this dashboard available in Excel or Power BI?
Yes. NextGenTemplates offers property management and rental property dashboards in multiple platforms including Excel, Power BI, Google Sheets, and HTML formats.
Conclusion
The Property Management Dashboard in HTML is an essential tool for anyone managing rental properties, residential complexes, or commercial real estate portfolios. With 5 interactive pages tracking everything from rent revenue and occupancy to maintenance costs and tenant satisfaction, this dashboard delivers the insights you need to make smarter property management decisions. The browser-based design means you can access your analytics from anywhere without installing any software. Download the Property Management Dashboard in HTML today and take control of your property portfolio analytics.
📌 Click here to Purchase Property Management Dashboard in HTML
🎥 Visit our YouTube channel to learn step-by-step video tutorials
👉 Youtube.com/@NeoTechNavigators