Salon and Spa Dashboard in HTML is a professionally designed, browser-based analytics template built for salon owners, spa managers, and beauty business operators who want to track revenue, monitor staff performance, analyze client behavior, and visualize service trends — all in one powerful interactive dashboard. This HTML dashboard includes 5 interactive pages covering every critical aspect of your salon and spa operations, from high-level KPI overviews to detailed data tables with search, sort, and export capabilities. If you’re managing a beauty business and want instant, data-driven insights without expensive software, this template is the perfect solution.
Click here to Purchase Salon and Spa Dashboard in HTML
Key Features of Salon and Spa Dashboard in HTML
This Salon and Spa Dashboard in HTML delivers everything you need to run a data-driven beauty business. It includes 5 dedicated dashboard pages — Overview, Service Analysis, Staff Performance, Client Insights, and Data View — covering every operational metric that matters. The template tracks 5 core KPIs on the overview page: Total Bookings, Total Revenue, Net Revenue, Completion Rate, and Avg Satisfaction. Multiple interactive slicers let you filter the entire dashboard by date, location, service category, and more. Whether you manage a single spa location or a multi-branch beauty salon chain, this dashboard scales to meet your analytical needs.
The dashboard is built using modern HTML, CSS, and JavaScript — making it lightweight, fast, and compatible with every modern web browser. No Power BI license, no Excel installation, no plugins needed. Just open the file and start exploring your data. For users who prefer other platforms, the Salon and Spa Dashboard in Excel and Salon and Spa Dashboard in Power BI are also available on NextGenTemplates.com.
Dashboard Pages Explained
1 — Overview Page
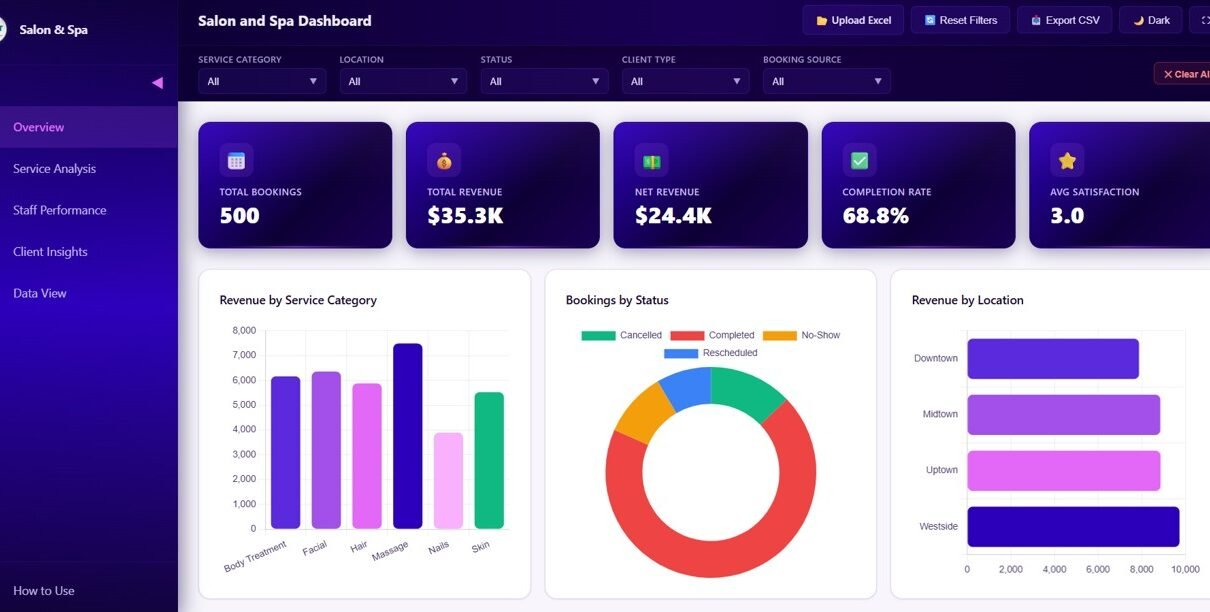
The Overview page is your high-level command center. At the top, you’ll find KPI cards showing Total Bookings, Total Revenue, Net Revenue, Completion Rate, and Avg Satisfaction. Below, interactive charts display Revenue by Service Category, Bookings by Status, Revenue by Location, Bookings by Month, and Monthly Revenue Trend. Dynamic slicers let you filter the entire dashboard instantly by any dimension.
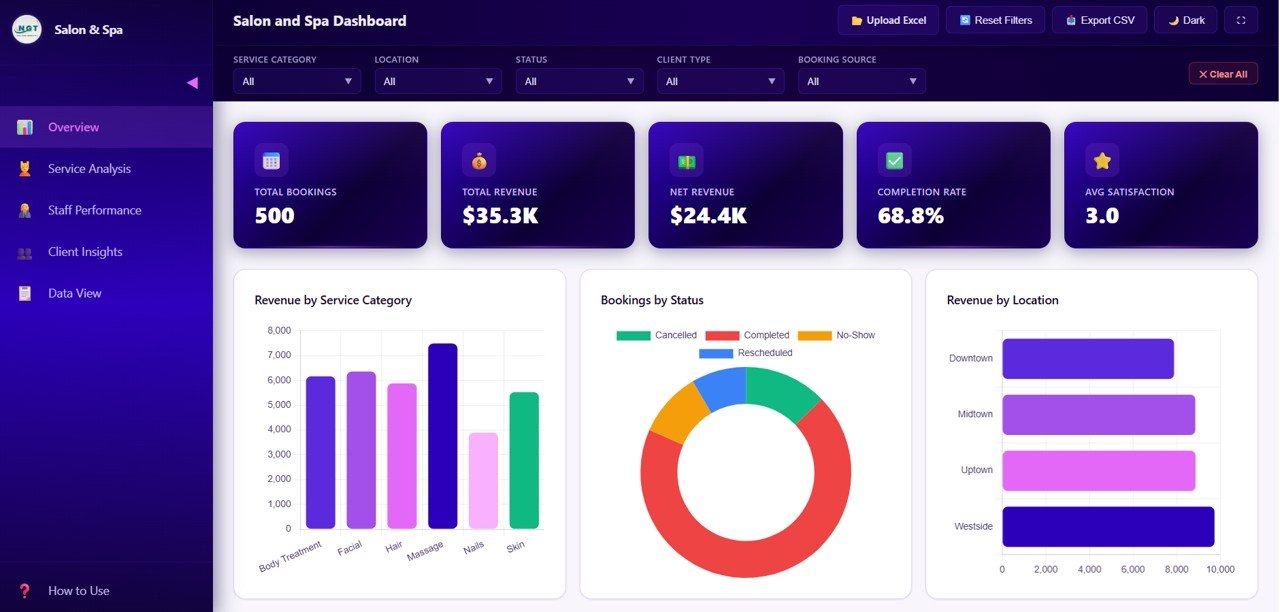 Salon and Spa Dashboard Overview
2 — Service Analysis
The Service Analysis page dives deep into your service offerings with charts showing Revenue by Service, Bookings by Service Category, Average Duration by Category, Tips by Service Category, and Satisfaction Rating by Service Category. This page helps you understand which services generate the most revenue, which ones deliver the highest client satisfaction, and where you can optimize your service menu for better profitability.
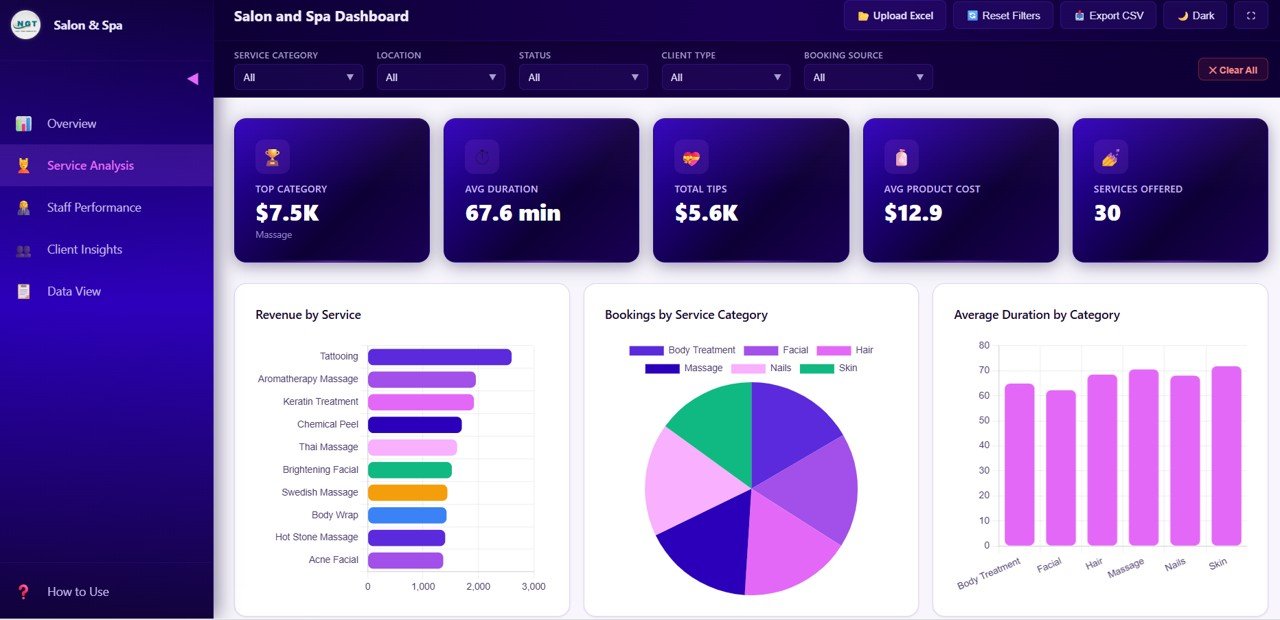 Service Analysis
3 — Staff Performance
The Staff Performance page evaluates your team with Revenue by Therapist, Bookings by Therapist, Satisfaction by Therapist, Completion Rate by Therapist, and Revenue and Tips by Therapist. This page is essential for performance reviews, incentive planning, and identifying your highest-performing staff members who drive the most business.
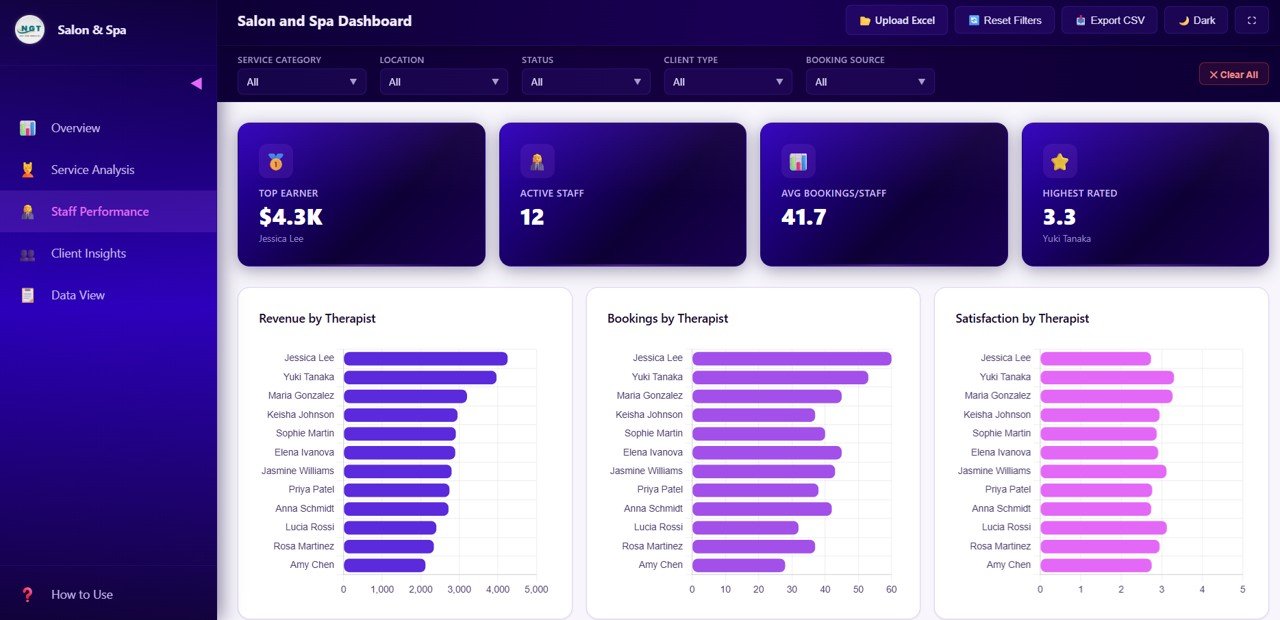 Staff Performance
4 — Client Insights
The Client Insights page helps you understand your customers better with analysis of Bookings by Client Type, Revenue by Client Type, Bookings by Payment Method, Bookings by Source, and Satisfaction Distribution by Client Type. Discover which booking channels bring in the most clients and which customer segments drive the highest revenue.
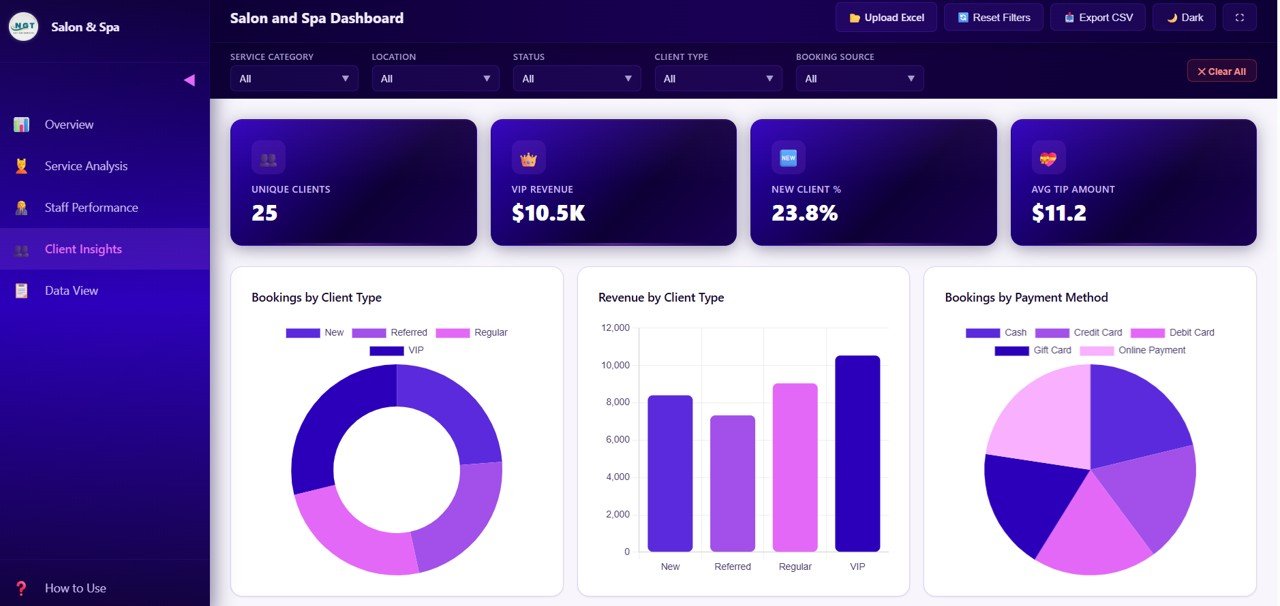 Client Insights
5 — Data View
The Data View page is a detailed data table where you can see all the records with search, sort, and pagination features. You can also export the filtered data to CSV for further analysis in Excel or Google Sheets. This page is perfect for drilling into individual records and verifying the data behind the dashboard charts.
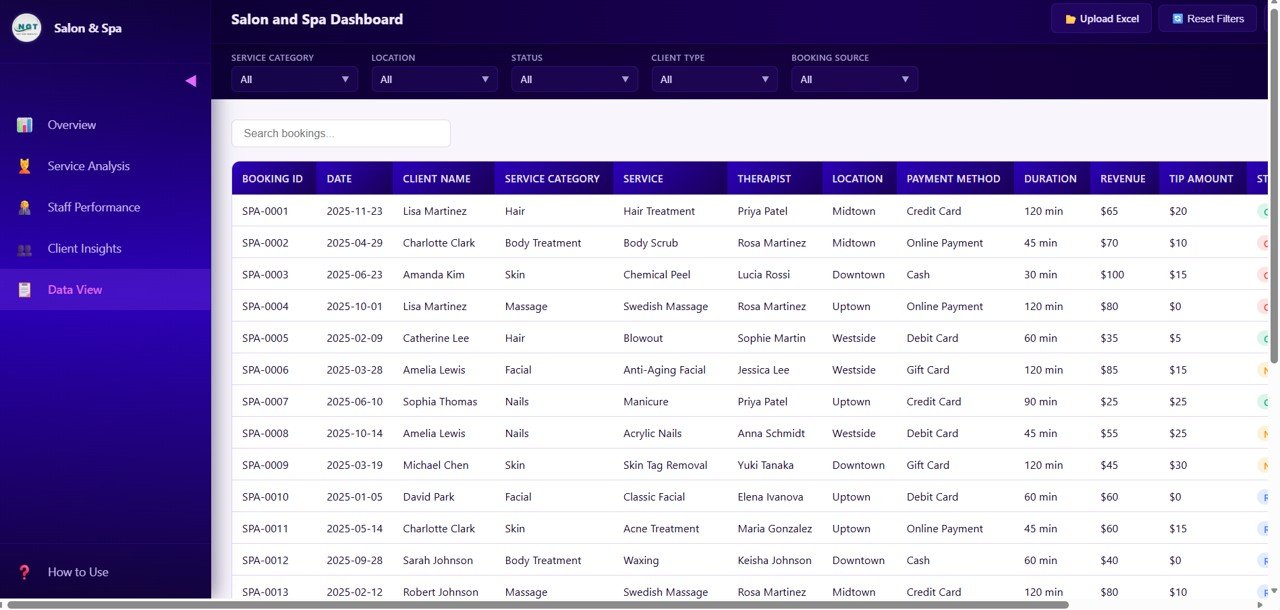 Data View
Advantages of Salon and Spa Dashboard in HTML
This HTML dashboard offers several distinct advantages over traditional spreadsheet or BI tools. First, it requires zero software installation — just open in any browser. Second, the modern SaaS-style design looks professional and impressive when presenting to stakeholders or partners. Third, the lightweight architecture means the dashboard loads instantly, even on lower-end devices. Fourth, data privacy is maintained because everything runs locally on your machine — no cloud upload required. Finally, the template is fully customizable if you have basic HTML and JavaScript knowledge.
Opportunities for Improvement
While the dashboard covers all essential salon analytics, users with advanced technical skills could extend it further by connecting live data sources via API, adding automated email alerts for KPI thresholds, or integrating with salon booking software for real-time data sync. Adding a forecasting module using JavaScript libraries could also provide predictive insights on revenue and booking trends.
Best Practices
To get the most from this Salon and Spa Dashboard in HTML, update your data regularly — ideally weekly or monthly — to keep insights current. Use the filter slicers to compare different time periods and identify trends. Share the dashboard with your team by simply sending the HTML file — no special access needed. For presentations, use full-screen mode in your browser for maximum visual impact. Refer to MDN Web Docs for further HTML customization guidance.
Explore Relevant Templates
If you’re looking for more salon and beauty business analytics, explore these related templates on NextGenTemplates.com:
- Salon and Spa Dashboard in Excel — The Excel version with pivot tables, slicers, and dynamic charts
- Salon and Spa Dashboard in Power BI — Advanced Power BI version with drill-through analysis
- Beauty Salons Dashboard in Power BI — Another Power BI dashboard for beauty industry analytics
- Beauty Salons Dashboard in Excel — Excel dashboard for salon analytics and reporting
Frequently Asked Questions
What is the Salon and Spa Dashboard in HTML?
The Salon and Spa Dashboard in HTML is a browser-based analytics template that tracks 5 core KPIs — Total Bookings, Total Revenue, Net Revenue, Completion Rate, and Average Satisfaction — across 5 interactive pages including Overview, Service Analysis, Staff Performance, Client Insights, and Data View.
Do I need any software to use this HTML dashboard?
No. Simply open the index.html file in any modern web browser like Chrome, Edge, or Firefox. No additional software, plugins, or licenses are required.
Can I use this dashboard for multiple salon locations?
Yes. The dashboard includes multi-location analytics with charts comparing Revenue by Location, making it ideal for salon chains and multi-branch spa businesses.
How do I replace the sample data with my own salon data?
Open the data file included in the download, replace the sample records with your own booking, revenue, and staff data, then refresh the browser. All charts and KPIs update automatically.
What is the best HTML dashboard for tracking salon and spa performance?
The Salon and Spa Dashboard in HTML from NextGen Templates is an excellent option. It covers 5 analytical pages including service analysis, staff performance, client insights, and a data view with search and export — all in a single, browser-ready HTML file.
Can I export data from this dashboard?
Yes. The Data View page includes a CSV export feature that lets you download filtered data for further analysis in Excel or Google Sheets.
Conclusion
The Salon and Spa Dashboard in HTML is the ultimate analytics solution for beauty business owners who want data-driven insights without the complexity of traditional BI tools. With 5 interactive pages, 5 core KPIs, and a modern browser-based interface, this dashboard transforms your salon data into actionable intelligence. Whether you’re tracking revenue, analyzing service performance, evaluating staff, or understanding client behavior — everything is at your fingertips.
Click here to Purchase Salon and Spa Dashboard in HTML
👉 Youtube.com/@NeoTechNavigators