In today’s fast-growing urban environment, managing water supply efficiently becomes more important than ever. Municipal authorities, utility companies, and infrastructure teams handle massive amounts of operational data daily. However, when this data remains scattered, it becomes difficult to track performance and make timely decisions.Water Supply KPI Scorecard in Google Sheets
So, how can water supply organizations monitor KPIs, improve service quality, and ensure efficient distribution—all in one place?Water Supply KPI Scorecard in Google Sheets
Water Supply KPI Scorecard in Google Sheets.
This powerful, ready-to-use scorecard helps you track, analyze, and optimize key performance indicators (KPIs) in real time. Moreover, it converts complex operational data into simple visuals using traffic lights, arrows, and percentage comparisons.
In this detailed guide, you will learn everything about this scorecard, including its features, structure, advantages, best practices, and frequently asked questions.
What is a Water Supply KPI Scorecard in Google Sheets?
A Water Supply KPI Scorecard in Google Sheets is an interactive reporting tool designed to monitor and evaluate water utility performance using key metrics.
Instead of using multiple reports, this scorecard allows you to:
- Track water distribution performance
- Monitor KPIs monthly and yearly
- Identify inefficiencies quickly
- Analyze performance trends
Therefore, it helps organizations improve efficiency and service quality.
Why Do You Need a Water Supply KPI Scorecard?
Click to Buy Water Supply KPI Scorecard in Google Sheets
Water supply systems require continuous monitoring. Therefore, having a centralized dashboard becomes essential.
Here’s why this scorecard is important:
- It provides a centralized KPI view
- It improves decision-making speed
- It enhances operational efficiency
- It reduces water loss and wastage
- It ensures better resource management
In short, this scorecard simplifies performance tracking and boosts efficiency.
Key Features of Water Supply KPI Scorecard in Google Sheets
This ready-to-use template includes multiple components that make KPI tracking easy and effective.
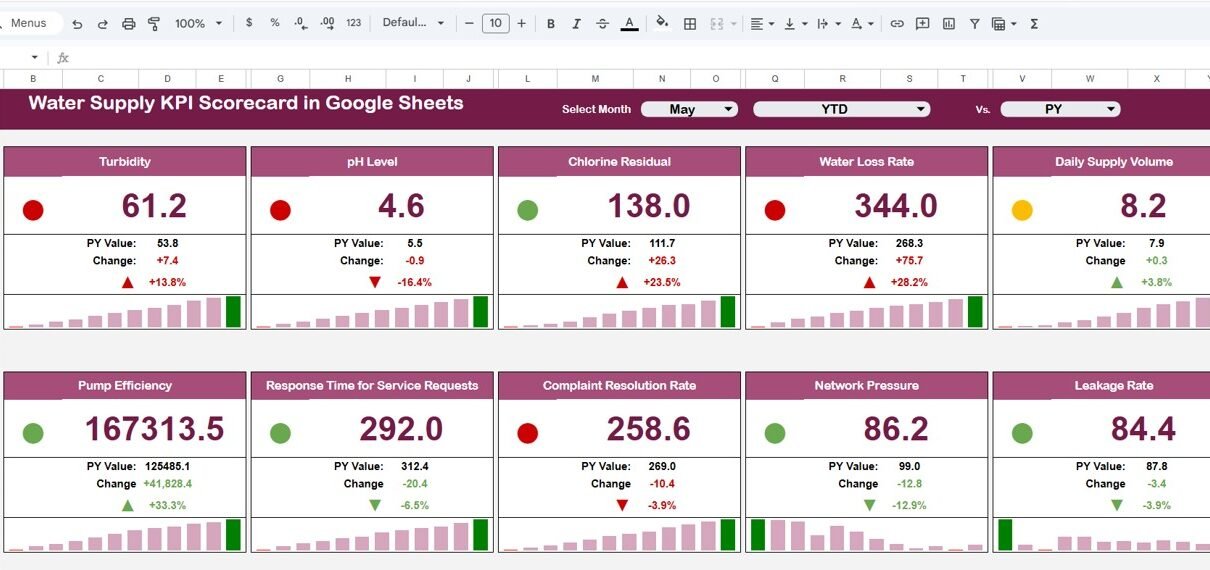
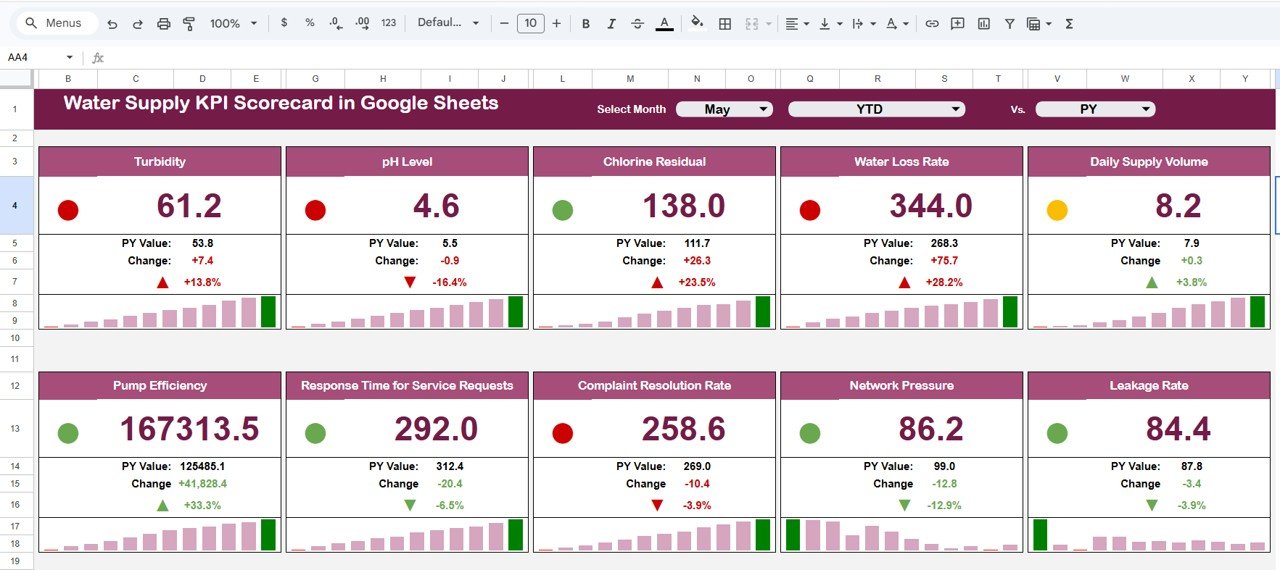
1. Monthly KPI Scorecard – Dynamic Overview
The main scorecard displays the performance of 10 different KPIs in a structured format.
Key Highlights:
- Month Dropdown (Top Section):
- Select any month
- All KPI values update automatically
- MTD & YTD Toggle:
- Click MTD to view monthly data
- Click YTD to view yearly performance
- Traffic Light Indicators:
- Green = Good performance
- Yellow = Moderate performance
- Red = Needs improvement
- 🔺🔻 Up & Down Arrows:
- Show percentage change in KPI performance
Water Supply KPI Scorecard in Google Sheets
Click to Buy Water Supply KPI Scorecard in Google Sheets
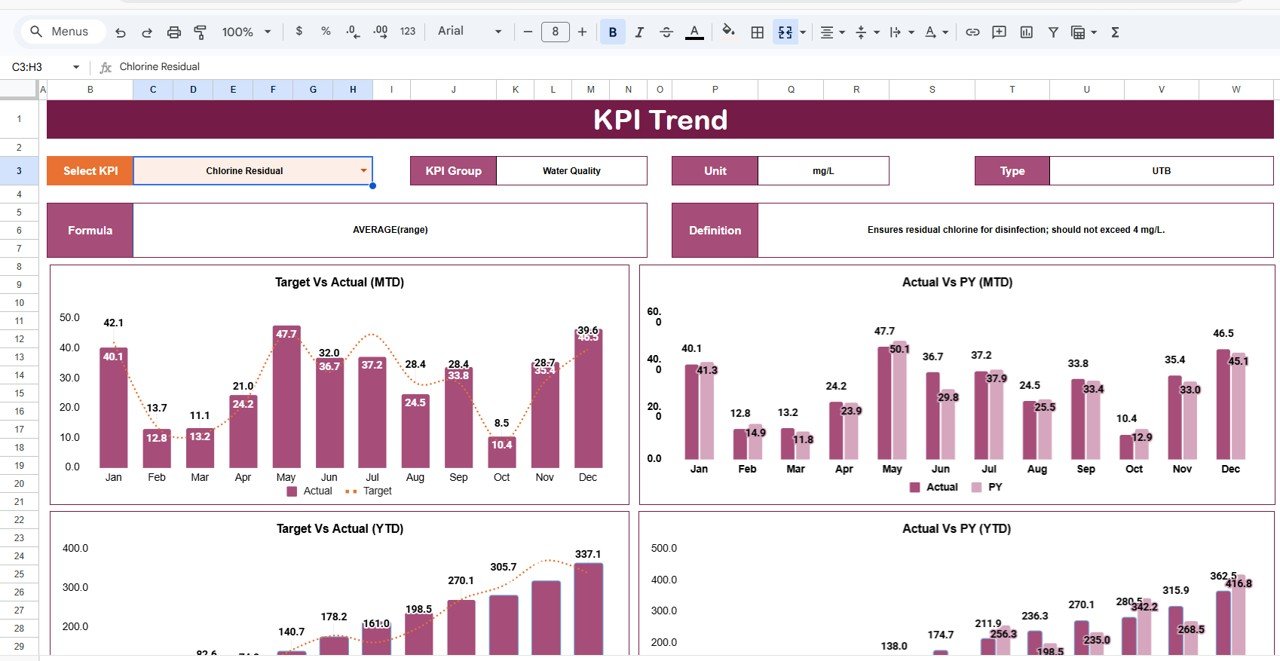
2. Trend Sheet Tab – Analyze KPI Performance Over Time
The Trend Sheet helps you understand how each KPI performs over time.
Key Features:
- KPI Selection Dropdown (Cell C3)
- Displays:
- KPI Group
- KPI Unit
- KPI Type (Lower the Better / Upper the Better)
Insights You Can Gain:
- Identify performance trends
- Detect improvements or declines
- Make data-driven decisions
Click to Buy Water Supply KPI Scorecard in Google Sheets
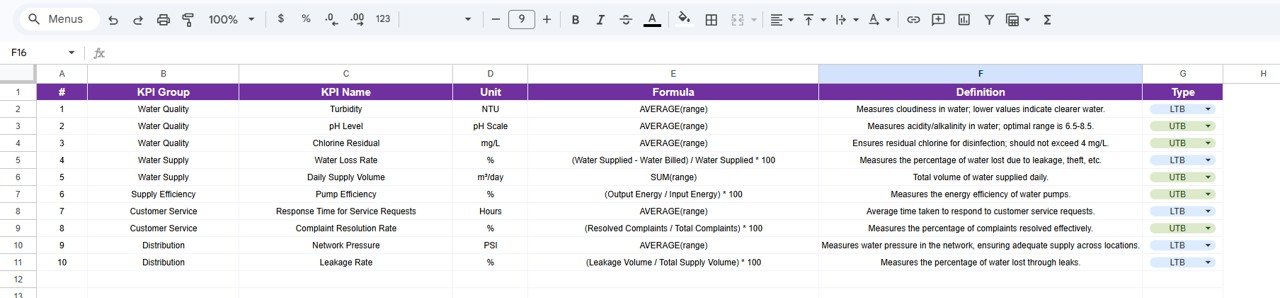
3. KPI Definition Sheet Tab – Understand KPI Logic
The KPI Definition Sheet provides detailed information about each KPI.
Includes:
- KPI Name
- KPI Group
- Unit
- Formula
- KPI Definition
Click to Buy Water Supply KPI Scorecard in Google Sheets
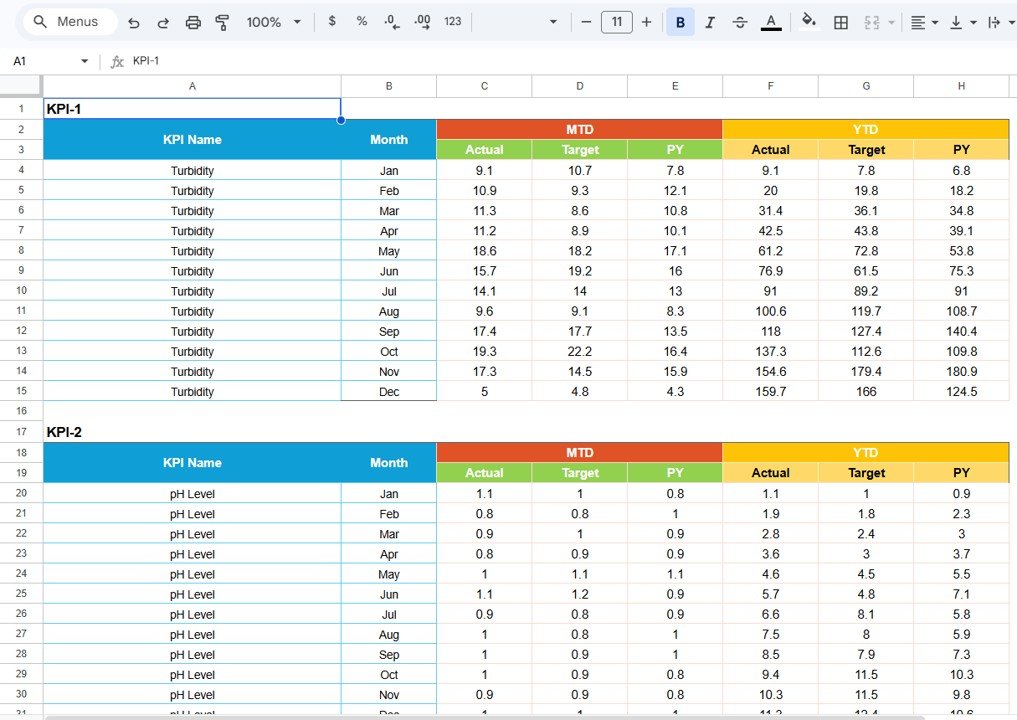
4. Data Input Sheet Tab – Enter KPI Data
The Data Input Sheet allows you to enter actual KPI values.
Includes:
- Monthly data entry
- MTD values
- YTD values
Click to Buy Water Supply KPI Scorecard in Google Sheets
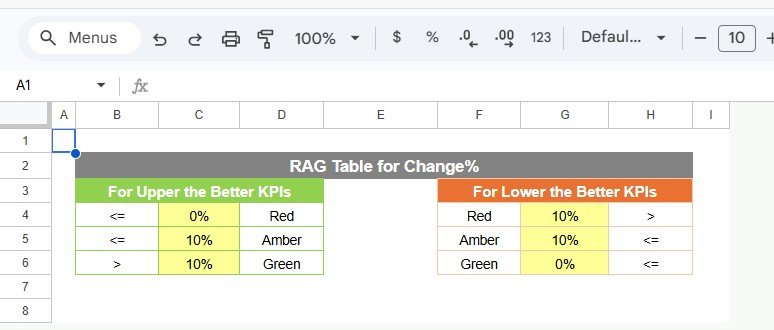
5. Color Settings – Visual Performance Indicators
The Color Settings Section controls how KPIs appear visually.
Features:
- Define thresholds for KPI performance
- Customize traffic light colors
- Set rules for arrows and percentage changes
Benefit:
Because visual indicators simplify analysis, users can quickly identify issues.
Click to Buy Water Supply KPI Scorecard in Google Sheets
Advantages of Water Supply KPI Scorecard in Google Sheets
Using this scorecard offers several benefits:
1. Real-Time Monitoring
You can track water supply KPIs instantly.
2. Improved Decision-Making
Clear visuals help you take faster actions.
3. Better Resource Management
You can optimize water usage and reduce waste.
4. Easy Data Visualization
Traffic lights and arrows make data easy to understand.
5. Cloud-Based Access
You can access the scorecard from anywhere.
6. Enhanced Accountability
Teams can track performance clearly.
Opportunities for Improvement
Click to Buy Water Supply KPI Scorecard in Google Sheets
You can enhance this scorecard further:
- 🤖 Add predictive analytics for water demand
- 🌐 Integrate with IoT water sensors
- 📱 Optimize for mobile viewing
- 🔔 Add alerts for performance drops
- 🔐 Improve data security
Best Practices for the Water Supply KPI Scorecard in Google Sheets
To maximize effectiveness, follow these best practices:
1. Keep Data Updated
Always update data regularly for accurate insights.
2. Define KPIs Clearly
Ensure each KPI has a proper definition and formula.
3. Use Visual Indicators Effectively
Set meaningful thresholds for colors and arrows.
4. Focus on Key Metrics
Track only important KPIs.
5. Monitor Trends Regularly
Analyze trends to improve planning.
6. Ensure Data Accuracy
Avoid errors in data entry.
Conclusion
Click to Buy Water Supply KPI Scorecard in Google Sheets
The Water Supply KPI Scorecard in Google Sheets is a powerful and user-friendly tool that simplifies performance tracking for water utilities. It transforms raw data into meaningful insights using interactive visuals and indicators.
Moreover, with features like traffic lights, trend analysis, and real-time updates, it helps organizations improve efficiency and make better decisions.
If you want to optimize water supply management, this scorecard is the perfect solution.
Visit our YouTube channel to learn step-by-step video tutorials