The Product Quality KPI Dashboard in Google Sheets is a ready-to-use performance tracking solution designed to help organizations monitor, measure, and improve product quality metrics in a structured and visual manner.
Instead of tracking quality KPIs across multiple spreadsheets and manual reports, this dashboard consolidates MTD, YTD, target, and previous-year performance into one interactive Google Sheets dashboard. As a result, quality teams and management gain instant visibility into product quality performance and trends.
Because the dashboard is built entirely in Google Sheets, it remains easy to update, collaborative, and accessible without technical skills.
What Is a Product Quality KPI Dashboard in Google Sheets?
Click to Buy Product Quality KPI Dashboard in Google Sheets
A Product Quality KPI Dashboard in Google Sheets is an analytics tool that tracks critical quality KPIs such as defect rates, rejection rates, rework levels, and compliance metrics.
Each KPI includes:
-
Unit of measurement
-
Aggregation formula
-
Clear KPI definition
-
KPI type (Lower the Better or Upper the Better)
This structure ensures clarity, consistency, and accurate performance evaluation.
What Are the Key Features of the Product Quality KPI Dashboard?
This dashboard focuses on monthly and yearly quality performance analysis using dynamic calculations, trend analysis, and visual indicators.
Key Highlights
- Monthly (MTD) and Yearly (YTD) KPI tracking
- Target vs Actual comparison
- Previous Year vs Current Year comparison
- Conditional formatting with up/down arrows
- KPI trends and definitions in one place
- Fully Excel-free, Google Sheets-based solution
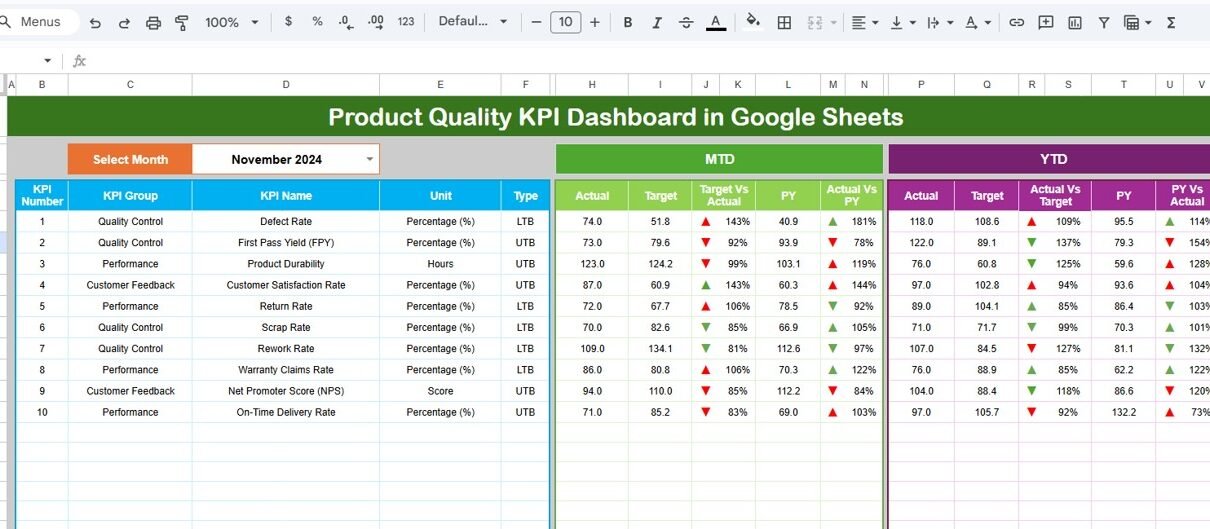
Dashboard Sheet Tab: How Is Overall Product Quality Performance Tracked?
Click to Buy Product Quality KPI Dashboard in Google Sheets
The Dashboard sheet tab is the main summary page of the file.
How the Dashboard Works
-
In cell D3, you can select the month from a dropdown
-
Once the month changes, all dashboard values update automatically
-
The dashboard displays performance for all quality KPIs in one view
Metrics Displayed on the Dashboard
MTD (Month-to-Date) Section
-
Actual value
-
Target value
-
Previous year value
-
Target vs Actual percentage
-
Previous Year vs Actual percentage
-
Conditional formatting with ▲ / ▼ arrows
YTD (Year-to-Date) Section
-
Actual value
-
Target value
-
Previous year value
-
Target vs Actual percentage
-
Previous Year vs Actual percentage
-
Conditional formatting with ▲ / ▼ arrows
This layout helps users quickly identify improving and declining quality KPIs.

Click to Buy Product Quality KPI Dashboard in Google Sheets
KPI Trend Sheet Tab: How Can Users Analyze KPI Trends?
The KPI Trend sheet tab focuses on detailed KPI analysis.
Features of the KPI Trend Sheet
-
KPI Name dropdown available in cell C3
Displays:
- KPI Group
- KPI Unit
- KPI Type (LTB or UTB)
- KPI Formula
- KPI Definition
This sheet ensures that users fully understand each KPI while reviewing its performance trend.

Click to Buy Product Quality KPI Dashboard in Google Sheets
Actual Number Sheet Tab: Where Are Actual KPI Values Entered?
The Actual Number sheet tab is used to enter actual performance values.
How to Use This Sheet
Enter the first month of the year in cell E1
Input:
- MTD actual values
- YTD actual values
-
Change the month in cell E1 to update actual data
Because of this structure, data entry remains simple and error-free.

Click to Buy Product Quality KPI Dashboard in Google Sheets
Target Sheet Tab: How Are KPI Targets Managed?
The Target sheet tab stores target values for each KPI.
Data Entered in This Sheet
-
KPI-wise MTD target values
-
KPI-wise YTD target values
-
Monthly target tracking
This sheet enables accurate target vs actual comparison across all KPIs.

Click to Buy Product Quality KPI Dashboard in Google Sheets
Previous Year Number Sheet Tab: How Is Historical Comparison Done?
The Previous Year Number sheet tab captures historical KPI values.
Purpose of This Sheet
- Enter previous year MTD values
- Enter previous year YTD values
- Enable year-over-year quality performance comparison
This helps teams evaluate whether quality performance is improving over time.

Click to Buy Product Quality KPI Dashboard in Google Sheets
KPI Definition Sheet Tab: Why Is This Sheet Important?
The KPI Definition sheet tab acts as the master reference sheet.
Information Captured
-
KPI Name
-
KPI Group
-
Unit of Measurement
-
Aggregation Formula
-
KPI Definition
-
KPI Type (Lower the Better / Upper the Better)
Because of this sheet, users always understand what each KPI measures and how it is calculated.

Click to Buy Product Quality KPI Dashboard in Google Sheets
Advantages of Product Quality KPI Dashboard in Google Sheets
Using this dashboard offers multiple benefits.
Key Advantages
- Centralized product quality tracking
- Clear MTD and YTD performance visibility
- Easy comparison with targets and previous year
- Reduced manual reporting effort
- Improved decision-making for quality improvement
- Fully cloud-based and collaborative
Best Practices for Using the Product Quality KPI Dashboard
Click to Buy Product Quality KPI Dashboard in Google Sheets
To get maximum value, follow these best practices:
-
Define quality KPIs clearly before data entry
-
Maintain consistent units and KPI formulas
-
Update actual and target data regularly
-
Review MTD performance weekly
-
Analyze YTD trends during monthly reviews
-
Train users to interpret LTB and UTB KPIs
Conclusion
The Product Quality KPI Dashboard in Google Sheets provides a structured, visual, and easy-to-use solution for tracking product quality performance. By combining actuals, targets, historical data, and KPI definitions in one dashboard, organizations can quickly identify quality issues and take corrective actions.
Visit our YouTube channel to learn step-by-step video tutorials
Youtube.com/@NeotechNavigators
Watch the step-by-step video tutorial: