Customer service plays a critical role in shaping customer satisfaction, brand loyalty, and long-term business success. However, many organizations still struggle to monitor support performance because data is scattered across spreadsheets, CRM tools, and ticketing platforms. As a result, managers find it difficult to track response times, agent performance, ticket volumes, and customer satisfaction metrics.
To address this challenge, we created the Customer Service Dashboard in HTML — a modern, interactive analytics solution that converts raw customer support data into clear visual insights. This dashboard allows managers to monitor service quality, analyze team productivity, track service trends, and identify operational improvements in real time.
Built with HTML, CSS, JavaScript, Chart.js, and Excel data integration, the dashboard delivers a fast, responsive, and visually engaging interface. Users can upload Excel data, apply filters, analyze support trends, and export reports — all directly within the browser without installing additional software.
In this guide, we will explore how the Customer Service Dashboard in HTML helps support teams improve operational efficiency and deliver exceptional customer experiences.
Why Businesses Need a Customer Service Dashboard
Click to Buy Customer Service Dashboard in HTML
Customer support operations generate large volumes of data every day. These include ticket volumes, resolution time, agent productivity, service ratings, and issue categories. Without structured analytics, it becomes difficult to evaluate service performance.
A customer service dashboard helps organizations:
- Monitor support performance in real time
- Track customer satisfaction metrics
- Identify service bottlenecks
- Evaluate agent productivity
- Improve response and resolution times
Instead of manually reviewing reports, managers can instantly view critical KPIs and service insights from a centralized dashboard.
Key Features of the Customer Service Dashboard
The Customer Service Dashboard in HTML includes multiple analytical pages designed to provide deep insights into customer service performance. Each page focuses on a specific operational dimension of the support process.
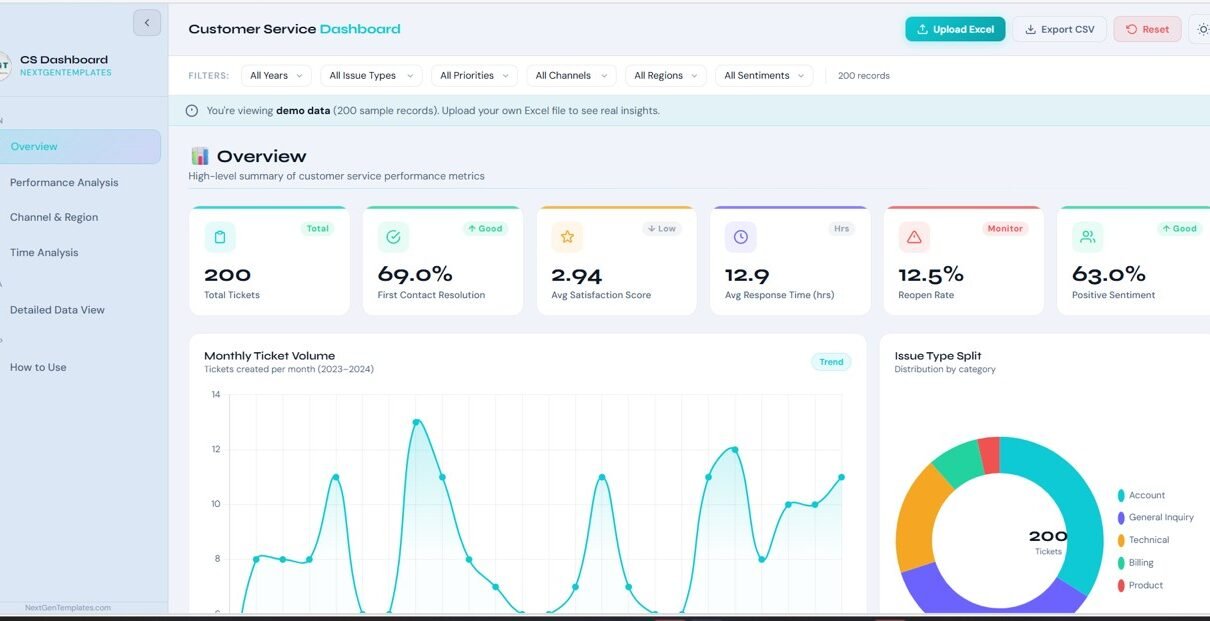
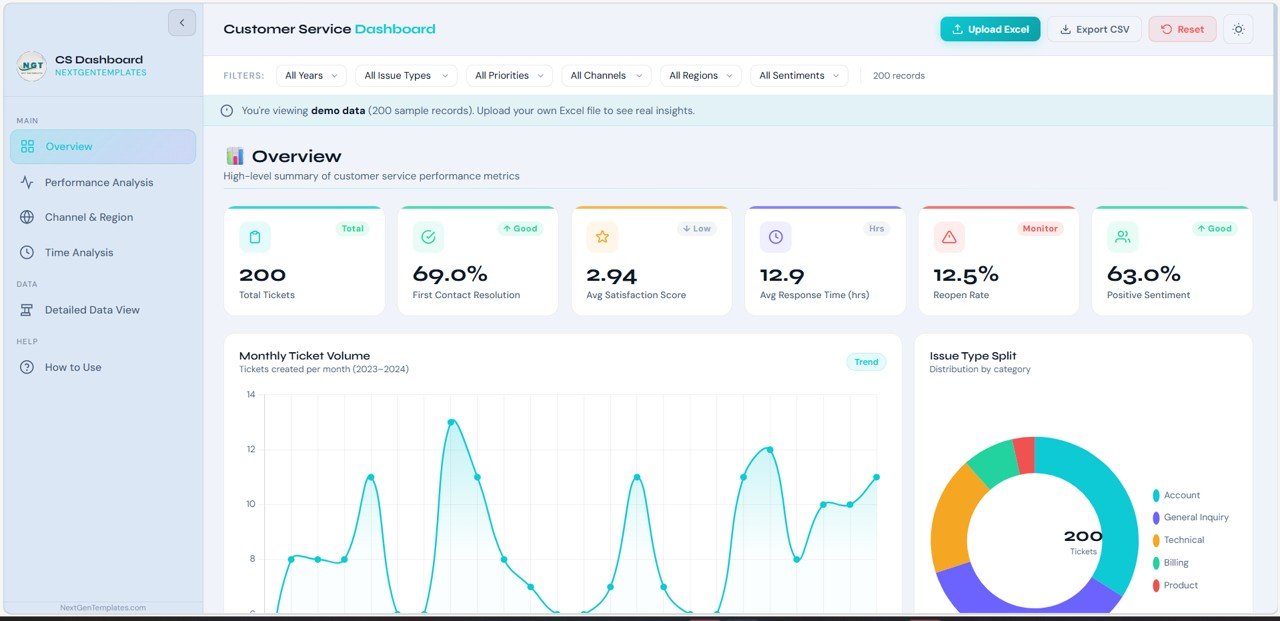
Overview Page
The Overview page provides a high-level summary of customer support performance. It displays important KPIs and quick insights that help managers understand service efficiency at a glance.
Key features include:
KPI Performance Cards
- Total Tickets Handled
- Average Resolution Time
- Customer Satisfaction Score
- First Response Time
- Ticket Backlog
KPI Trend Indicators
- Upward and downward trends highlight performance changes
- Color-coded indicators quickly identify improvements or declines
Interactive Sparkline Charts
- Small charts within KPI cards show performance movement over time
These KPIs allow managers to instantly evaluate the overall health of customer support operations.
Click to Buy Customer Service Dashboard in HTML
Service Performance Page
The Service Performance page focuses on operational performance metrics and service efficiency indicators.
Key analytics available on this page include:
Ticket Volume Analysis
- Shows the number of tickets received across different time periods
Resolution Time Distribution
- Measures how quickly customer issues are resolved
Service Level Performance
- Tracks whether support teams meet service-level agreements (SLAs)
Issue Category Distribution
- Identifies the most common types of customer problems
This analysis helps support managers identify service delays and improve operational processes.
Click to Buy Customer Service Dashboard in HTML
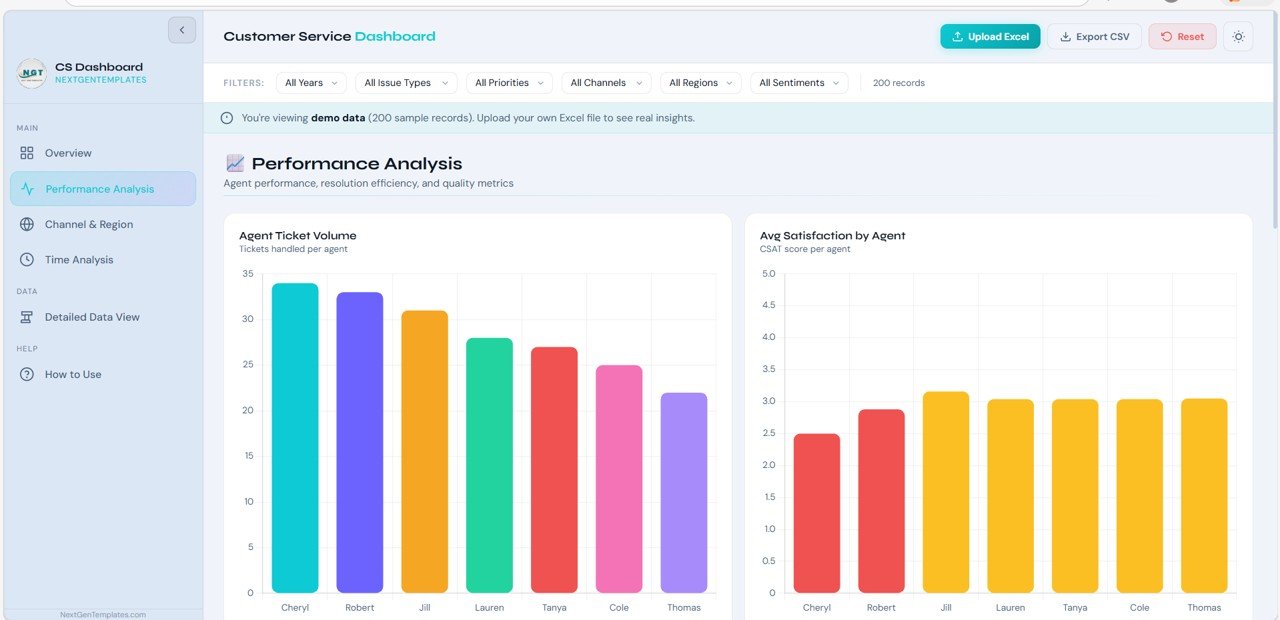
Agent Performance Page
The Agent Performance page highlights the productivity and efficiency of individual customer service agents.
Key features include:
Agent Leaderboard
- Displays top-performing support agents
- Includes ranking based on service performance
Agent Performance Scores
- Measures overall productivity based on ticket handling efficiency
Performance Progress Bars
- Visual indicators showing progress toward service goals
Agent Activity Metrics
- Tickets handled
- Resolution speed
- Customer feedback scores
This page helps management recognize high-performing employees and identify training opportunities.
Click to Buy Customer Service Dashboard in HTML
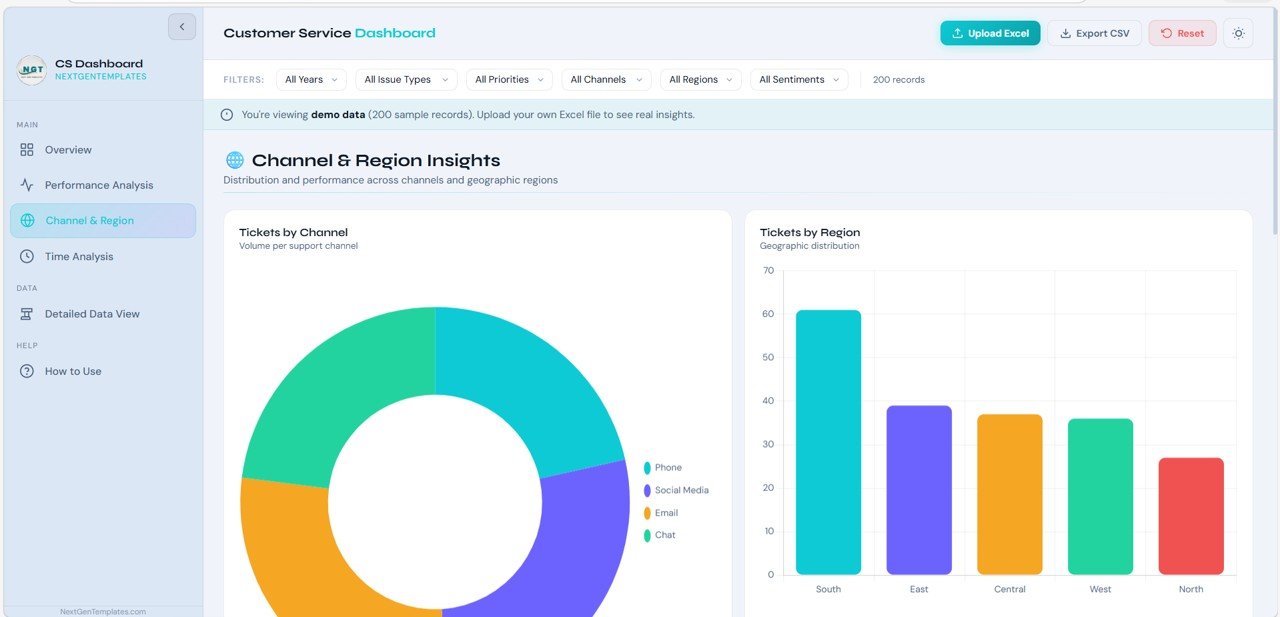
Ticket Analysis Page
The Ticket Analysis page focuses on understanding customer support trends and issue patterns.
Key analytics include:
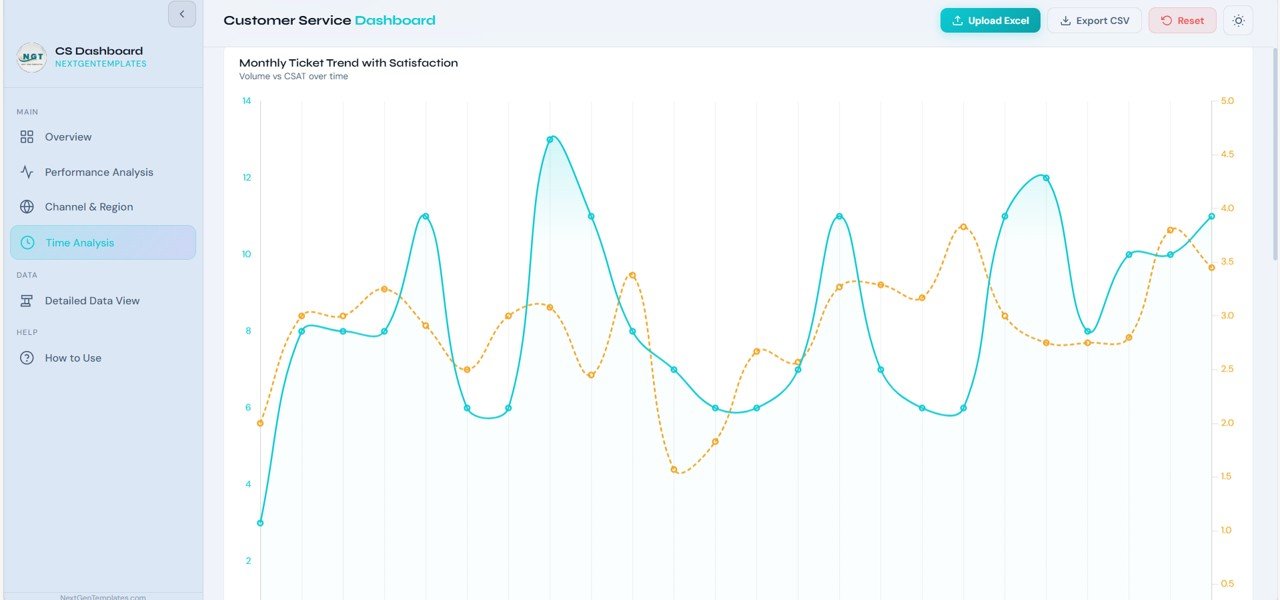
Ticket Trends Over Time
- Shows how ticket volume changes daily, weekly, or monthly
Ticket Priority Distribution
- Categorizes tickets into High, Medium, and Low priority
Customer Satisfaction Analysis
- Tracks satisfaction ratings based on support interactions
Issue Heatmaps
- Highlights areas where support demand is highest
These insights allow organizations to proactively manage customer support demand and allocate resources effectively.
Click to Buy Customer Service Dashboard in HTML
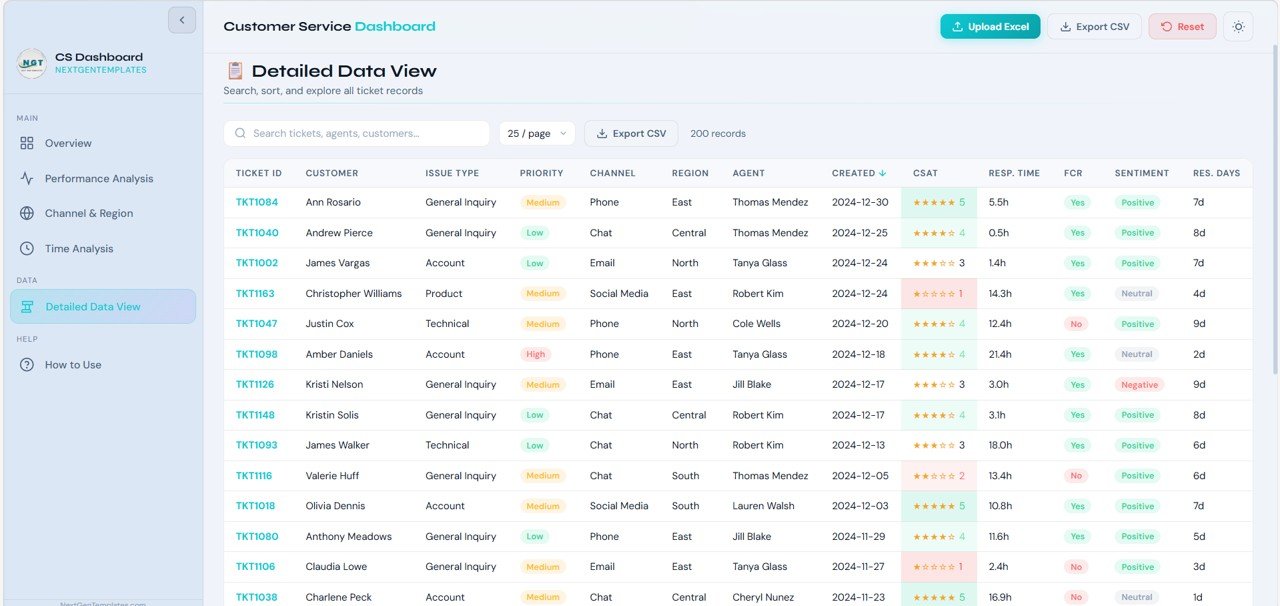
Detailed Data Page
The Detailed Data page provides a full table view of customer service records. This page allows users to explore individual ticket data used by the dashboard.
Key features include:
Interactive Data Table
- Displays detailed support records
Search Functionality
- Users can search tickets by ID, agent name, customer name, or issue category
Sorting Capabilities
- Table columns can be sorted for deeper analysis
Pagination Controls
- Allows navigation through large datasets
This page is particularly useful for detailed investigation and operational auditing.
Click to Buy Customer Service Dashboard in HTML
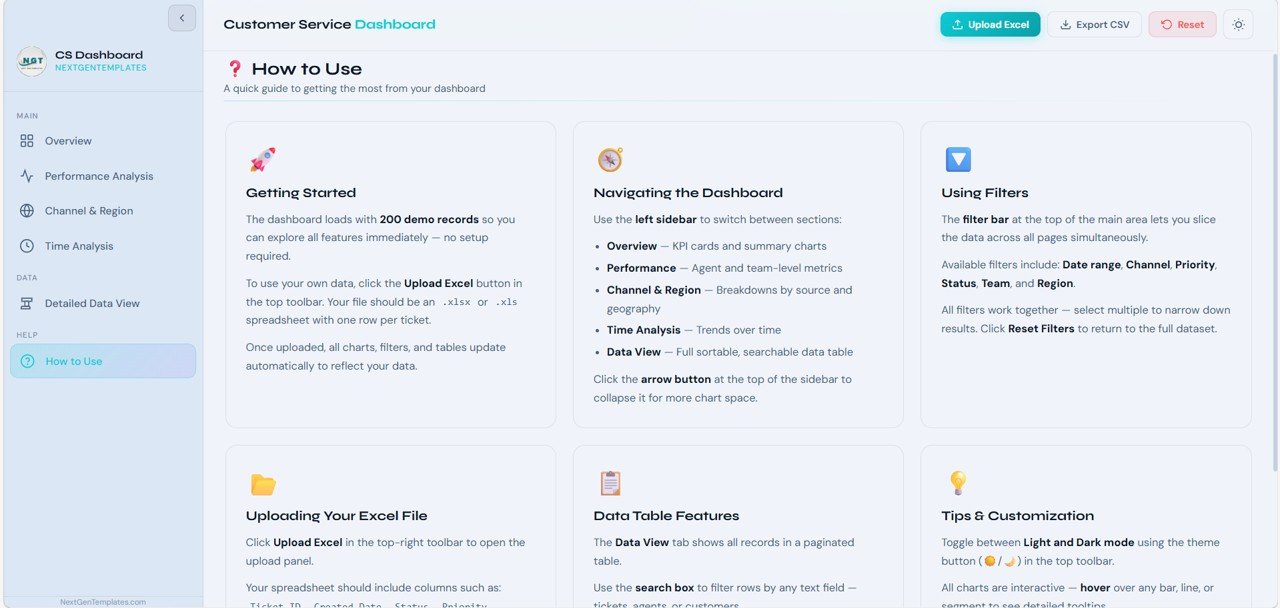
How to Use Page
The dashboard also includes a How to Use section that explains how users can interact with the dashboard effectively.
Key instructions include:
Uploading Excel Data
Users can upload their customer service dataset (.xlsx) to populate the dashboard with real support records.
Applying Filters
The dashboard includes filters to analyze support data based on:
- Agent
- Ticket Status
- Priority Level
- Date Range
- Issue Category
Searching Records
The detailed data page allows instant searching across all ticket records.
Exporting Data
Users can export filtered datasets into CSV files for reporting and sharing.
These features make the dashboard flexible and easy to use for both technical and non-technical users.
Click to Buy Customer Service Dashboard in HTML
Additional Interactive Dashboard Features
The Customer Service Dashboard in HTML also includes advanced features that enhance the overall user experience.
Excel Data Upload
Users can import support datasets directly from Excel files.
Dark & Light Theme Support
The dashboard supports both dark mode and light mode themes for improved usability.
Responsive Design
The layout adapts automatically to different screen sizes and devices.
Advanced Chart Visualizations
Interactive charts built using Chart.js provide dynamic visual analytics.
Export Reports
Users can export filtered reports for presentations or operational meetings.
These features ensure that the dashboard is both powerful and user-friendly.
Advantages of the Customer Service Dashboard in HTML
Using this dashboard provides multiple operational benefits:
- Real-time monitoring of customer service performance
- Improved visibility into ticket trends and service metrics
- Faster identification of service bottlenecks
- Better workforce performance tracking
- Enhanced customer satisfaction monitoring
- Data-driven support management decisions
These advantages help businesses deliver faster, more reliable customer service.
Best Practices for Using the Dashboard
Click to Buy Customer Service Dashboard in HTML
To maximize the effectiveness of the dashboard:
- Maintain clean and consistent ticket data
- Update datasets regularly
- Monitor response time and resolution KPIs
- Analyze ticket trends to predict service demand
- Track agent performance to improve training programs
- Export reports for team performance reviews
Following these practices ensures that the dashboard becomes a powerful operational intelligence tool.
Conclusion
The Customer Service Dashboard in HTML is a modern analytics solution designed to help organizations monitor and optimize their support operations. By transforming raw service data into interactive charts and performance metrics, the dashboard empowers managers to track KPIs, evaluate agent productivity, and improve customer satisfaction.
With its powerful visualization capabilities, Excel integration, responsive design, and interactive filtering, this dashboard provides a comprehensive platform for managing customer service analytics efficiently.
Organizations looking to improve service quality and operational transparency will benefit significantly from implementing this dashboard.
Visit our YouTube channel to learn step-by-step video tutorials
Watch the step-by-step video tutorial: