In today’s world, sustainability and environmental responsibility play a crucial role in business operations. Organizations, municipalities, and recycling centers must track recycling performance to ensure efficient waste management and environmental compliance. However, many organizations still rely on manual reports and scattered spreadsheets. As a result, they struggle to measure recycling efficiency and identify improvement areas.
Therefore, businesses and environmental organizations increasingly adopt data-driven tools to monitor performance. One of the most effective solutions is the Recycling KPI Scorecard in Google Sheets.
The Recycling KPI Scorecard in Google Sheets is a ready-to-use template designed to track and analyze recycling performance using key performance indicators (KPIs). Because it offers dynamic calculations, visual indicators, and interactive controls, it helps users monitor performance with ease.
In this comprehensive guide, you will learn everything about the Recycling KPI Scorecard in Google Sheets, including its features, structure, advantages, best practices, and FAQs.
What is a Recycling KPI Scorecard in Google Sheets?
A Recycling KPI Scorecard in Google Sheets is an analytical tool that helps organizations monitor recycling performance through structured KPIs.
It tracks key metrics such as:
-
Recycling rate
-
Waste diversion percentage
-
Collection efficiency
-
Processing efficiency
-
Cost per ton recycled
Because the scorecard uses Google Sheets, users can easily access and update data from anywhere.
Moreover, the template automatically updates calculations, charts, and indicators when users select different months.
Why Do Organizations Need a Recycling KPI Scorecard?
Click to Buy Recycling KPI Scorecard in Google Sheets
Managing recycling operations involves multiple processes such as waste collection, sorting, processing, and reporting. Therefore, tracking performance manually becomes difficult.
A KPI scorecard simplifies this process.
Organizations need a recycling KPI scorecard because it helps to:
-
Monitor recycling performance
-
Track environmental impact
-
Improve waste management efficiency
-
Identify operational gaps
-
Support sustainability goals
As a result, organizations can improve both operational performance and environmental outcomes.
Key Features of Recycling KPI Scorecard in Google Sheets
The Recycling KPI Scorecard in Google Sheets offers several powerful features that make performance tracking simple and effective.
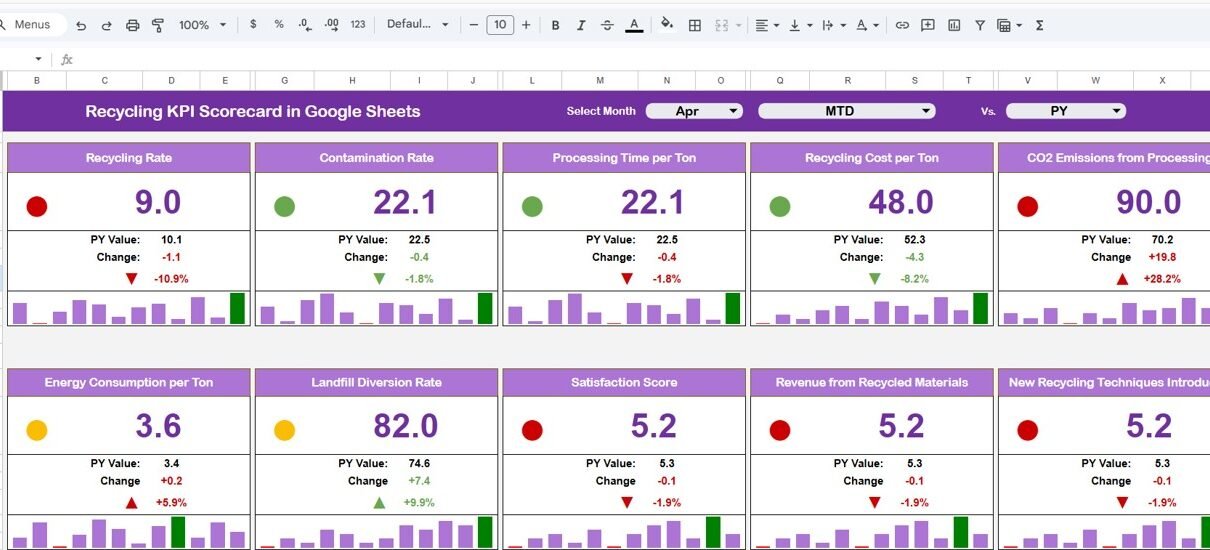
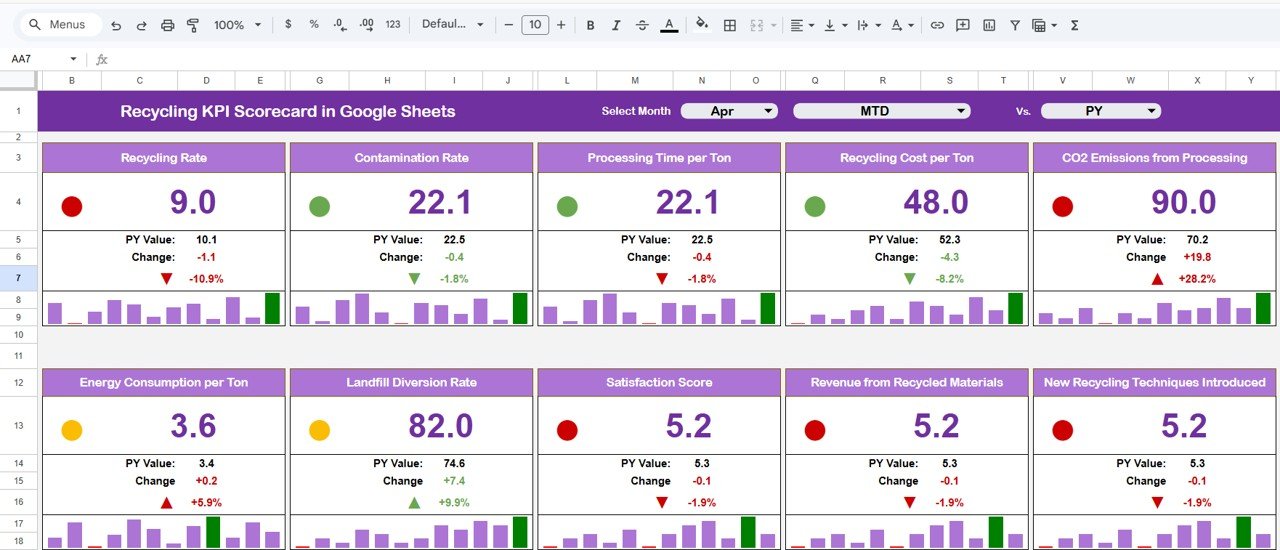
1. Dynamic Monthly Scorecard
At the top of the dashboard, users can select a Month from the dropdown list.
Because of this feature:
-
All KPI values update automatically
-
Charts adjust instantly
-
Performance indicators change dynamically
Therefore, users can easily analyze monthly performance.
2. KPI Performance Tracking
Click to Buy Recycling KPI Scorecard in Google Sheets
The scorecard tracks 10 different KPIs to measure recycling performance.
Each KPI includes:
-
KPI Name
-
KPI Group
-
Unit of measurement
-
KPI Type (LTB or UTB)
Because of this structured approach, users can analyze multiple performance areas.
3. Traffic Light Indicators
The dashboard uses traffic light colors to represent performance:
-
🟢 Green → Good performance
-
🟡 Yellow → Moderate performance
-
🔴 Red → Poor performance
Therefore, users can quickly identify which KPIs need attention.
4. Up and Down Arrows
The scorecard includes visual arrows:
-
▲ Up arrow → Performance improvement
-
▼ Down arrow → Performance decline
Because of these indicators, users can instantly understand trends.
5. MTD and YTD Analysis
The dashboard allows users to switch between:
-
MTD (Month-To-Date)
-
YTD (Year-To-Date)
By clicking the respective options:
-
Users can view monthly performance
-
Or analyze yearly performance
As a result, decision-makers gain both short-term and long-term insights.
Click to Buy Recycling KPI Scorecard in Google Sheets
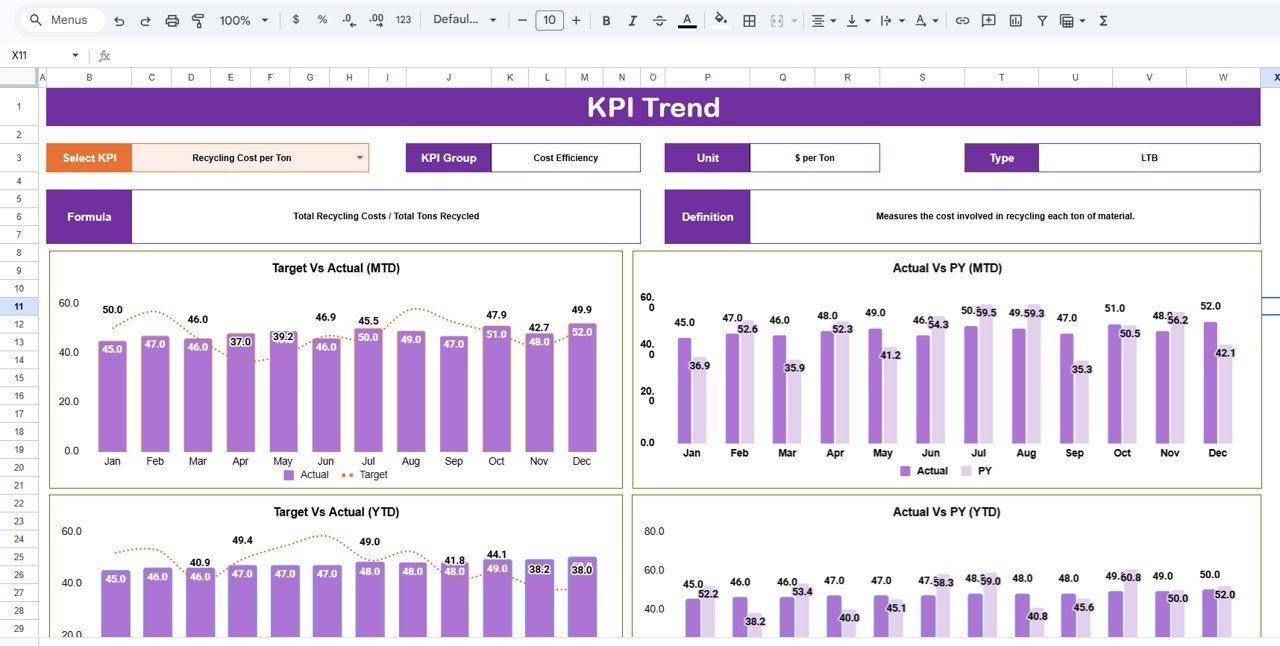
6. KPI Trend Sheet
The Trend Sheet provides detailed trend analysis.
Features:
-
KPI selection dropdown (Range C3)
-
Displays KPI Group
-
Shows KPI Unit
-
Indicates KPI Type (LTB or UTB)
Because of this, users can analyze performance trends over time.
Click to Buy Recycling KPI Scorecard in Google Sheets
7. KPI Definition Sheet
The KPI Definition Sheet contains all KPI-related details.
Users must enter:
-
KPI Name
-
KPI Group
-
Unit
-
Formula
-
KPI Definition
This ensures consistency and clarity in KPI tracking.
Click to Buy Recycling KPI Scorecard in Google Sheets
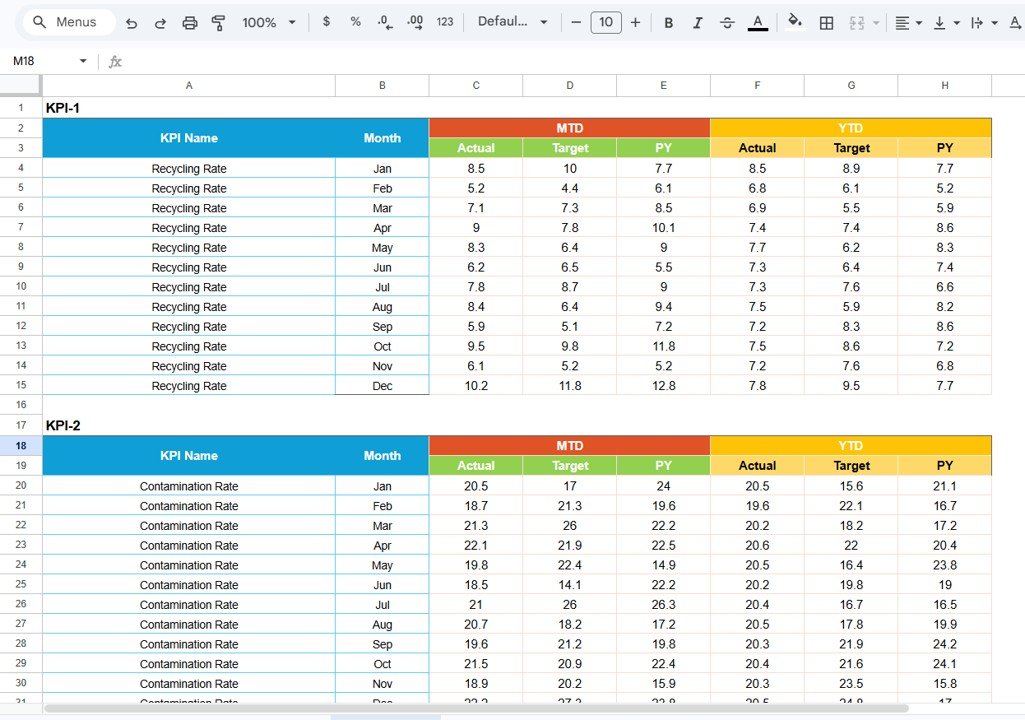
8. Data Input Sheet
The Data Input Sheet is where users enter raw data.
Required inputs:
-
KPI Name
-
Month
-
KPI values
Because the dashboard connects directly to this sheet, all updates reflect automatically in the scorecard.
Click to Buy Recycling KPI Scorecard in Google Sheets
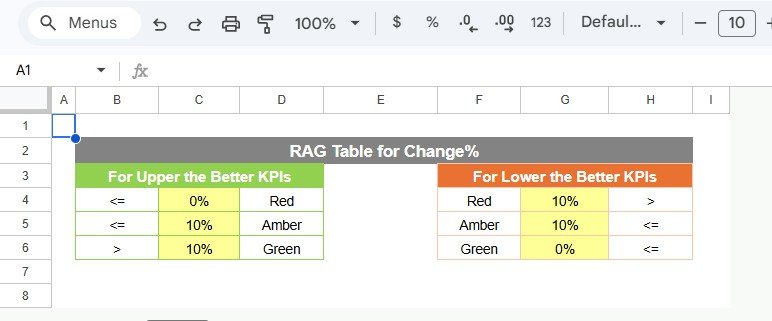
9. Color Settings Customization
The template allows users to customize color settings.
Users can:
-
Define performance thresholds
-
Adjust traffic light colors
-
Modify visual indicators
Therefore, organizations can align the dashboard with their internal standards.
Advantages of Recycling KPI Scorecard in Google Sheets
Click to Buy Recycling KPI Scorecard in Google Sheets
1. Easy to Use
The template is simple and user-friendly. Therefore, users can start using it without technical expertise.
2. Real-Time Updates
Because Google Sheets supports cloud updates, users can view real-time data changes.
3. Improved Decision-Making
Visual indicators and structured KPIs help managers make faster decisions.
4. Better Sustainability Tracking
The scorecard helps organizations track environmental performance effectively.
5. Cost-Effective Solution
Since it uses Google Sheets, there is no need for expensive software.
Opportunities for Improvement in Recycling KPI Tracking
-
Integrate IoT sensors for real-time data collection
-
Track carbon footprint metrics
-
Include predictive analytics
-
Automate waste classification systems
-
Monitor supplier recycling performance
Conclusion
Click to Buy Recycling KPI Scorecard in Google Sheets
The Recycling KPI Scorecard in Google Sheets is a powerful and easy-to-use tool for tracking recycling performance. It simplifies data analysis, improves visibility, and supports sustainability goals.
Because the template offers dynamic updates, visual indicators, and structured KPI tracking, it helps organizations make better decisions.
Therefore, adopting this scorecard can significantly enhance recycling operations and environmental performance.
Visit our YouTube channel to learn step-by-step video tutorials