In today’s modern agriculture industry, farmers and agribusinesses generate massive amounts of data. However, managing farm production, costs, revenue, yield, and profitability manually becomes difficult.Farm Production and Profitability Dashboard in Google Sheets
Because of that, many farms still rely on scattered spreadsheets. As a result, they miss important insights and struggle to make timely decisions.Farm Production and Profitability Dashboard in Google Sheets
Therefore, smart farmers now adopt digital dashboards to simplify data analysis. That’s where the Farm Production and Profitability Dashboard in Google Sheets becomes a powerful and practical solution.
In this comprehensive guide, you will learn everything about this dashboard. Moreover, you will understand its features, structure, advantages, and best practices to improve farm performance.Farm Production and Profitability Dashboard in Google Sheets
What is a Farm Production and Profitability Dashboard in Google Sheets?
Click to Buy Farm Production and Profitability Dashboard in Google Sheets
A Farm Production and Profitability Dashboard in Google Sheets is an interactive reporting tool that helps farmers and agribusinesses track and analyze farm operations.Farm Production and Profitability Dashboard in Google Sheets
It allows you to monitor:
-
Revenue and costs
-
Profitability
-
Crop production
-
Yield per acre
-
Regional performance
-
Seasonal trends
Instead of using multiple sheets, you can manage everything in one centralized dashboard. As a result, you gain better control over your farming operations.Farm Production and Profitability Dashboard in Google Sheets
Why Do Farms Need a Production Dashboard?
Agriculture involves multiple variables such as soil, weather, crops, and costs. However, without proper tracking, it becomes difficult to optimize performance.
Therefore, a dashboard helps you:
-
Track farm performance in real time
-
Identify profitable crops
-
Monitor costs and expenses
-
Improve yield and efficiency
-
Make data-driven decisions
Moreover, it saves time and reduces manual work.
Key Features of Farm Production and Profitability Dashboard
Click to Buy Farm Production and Profitability Dashboard in Google Sheets
This dashboard includes multiple interactive pages, each designed to provide deep insights.
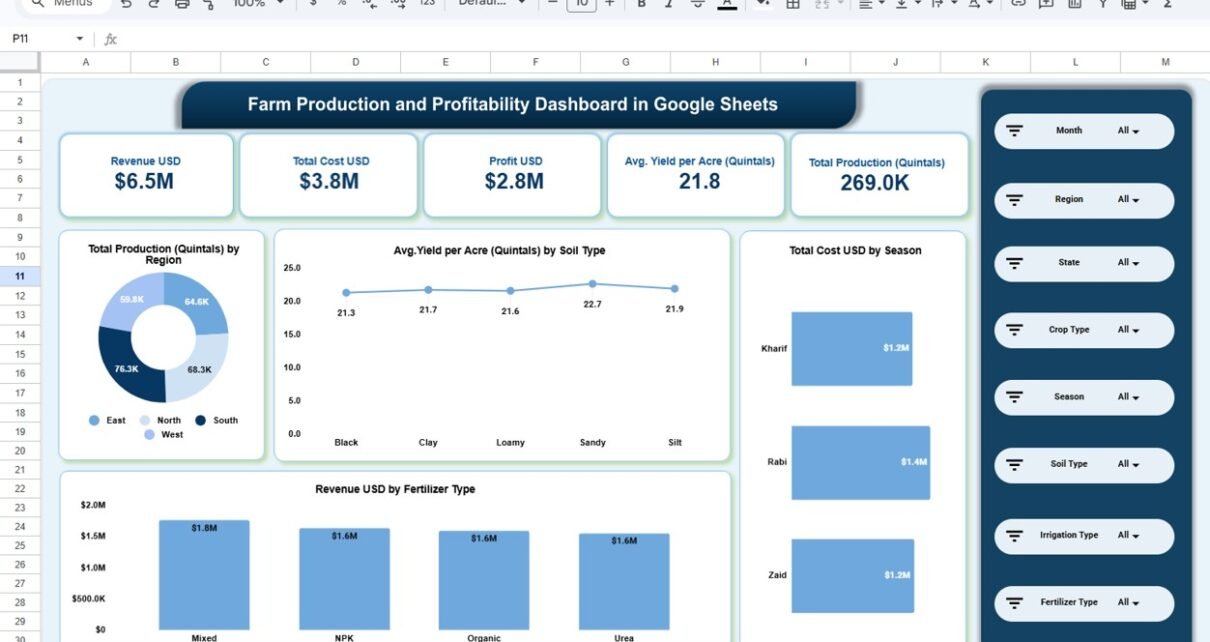
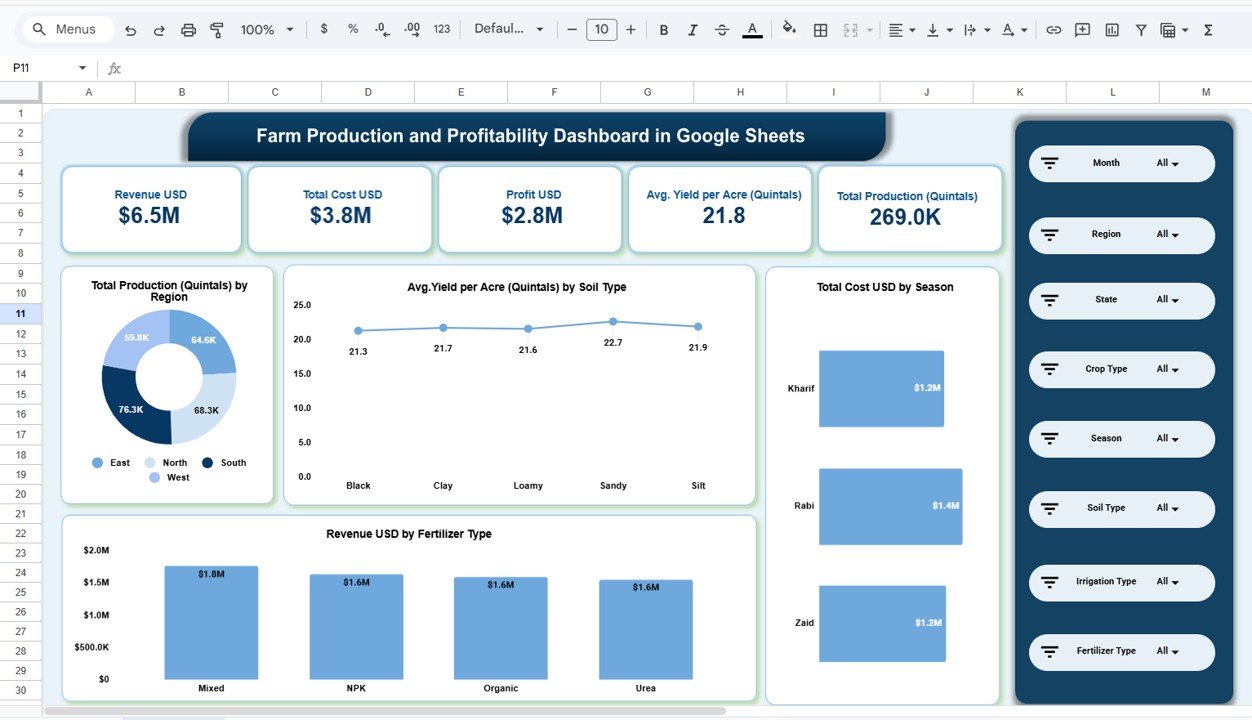
Overview Dashboard – Quick Farm Summary
The Overview Page gives a complete snapshot of farm performance.
Key KPIs:
-
Revenue: $6.5M
-
Total Cost: $3.8M
-
Profit: $2.8M
-
Avg Yield per Acre: 21.8 Quintals
-
Total Production: 269K Quintals
📈 Charts Included:
-
Production by Region
-
Yield by Soil Type
-
Cost by Season
-
Revenue by Fertilizer Type
🎯 Why It Matters:
Because this page summarizes everything, you can quickly evaluate farm performance.
Click to Buy Farm Production and Profitability Dashboard in Google Sheets
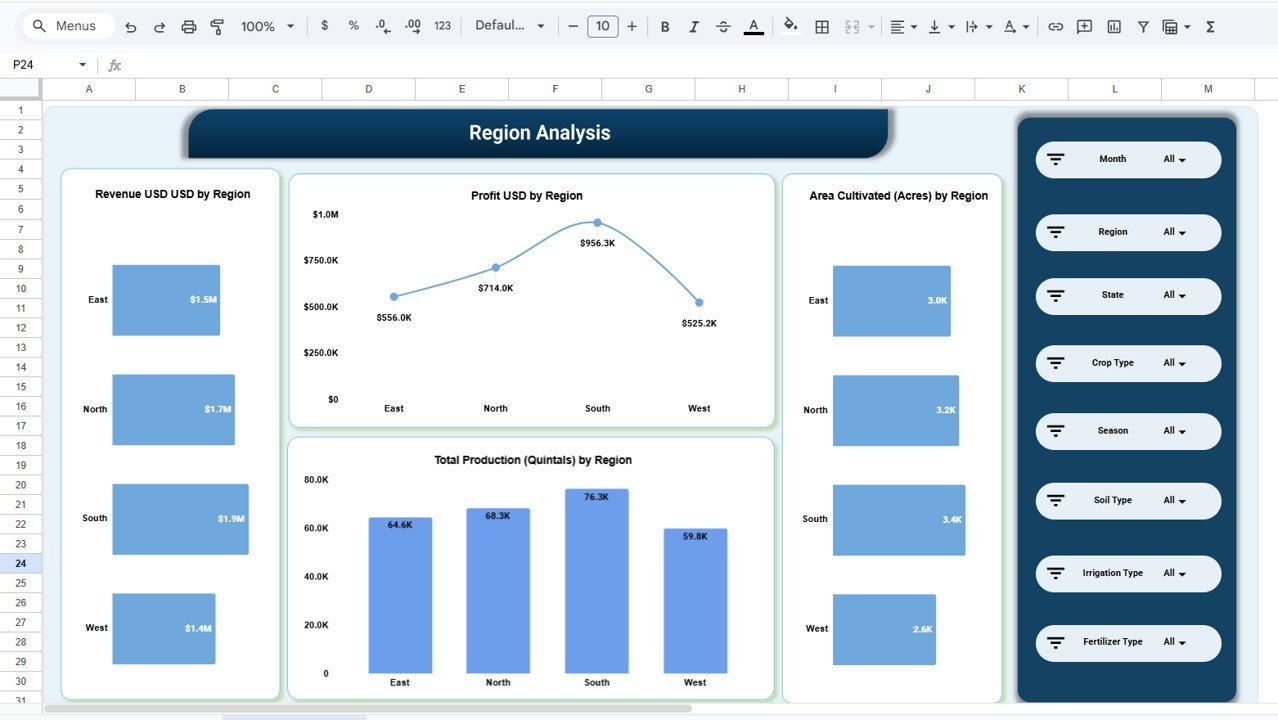
Region Analysis – Compare Geographic Performance
This page focuses on regional insights.
Key Metrics:
-
Revenue by Region
-
Profit by Region
-
Area Cultivated
-
Production by Region
🔍 Insights:
-
Which region performs best
-
Which region generates highest profit
-
Land utilization efficiency
🚀 Why It Matters:
Because geography affects productivity, this page helps optimize regional planning.
Click to Buy Farm Production and Profitability Dashboard in Google Sheets
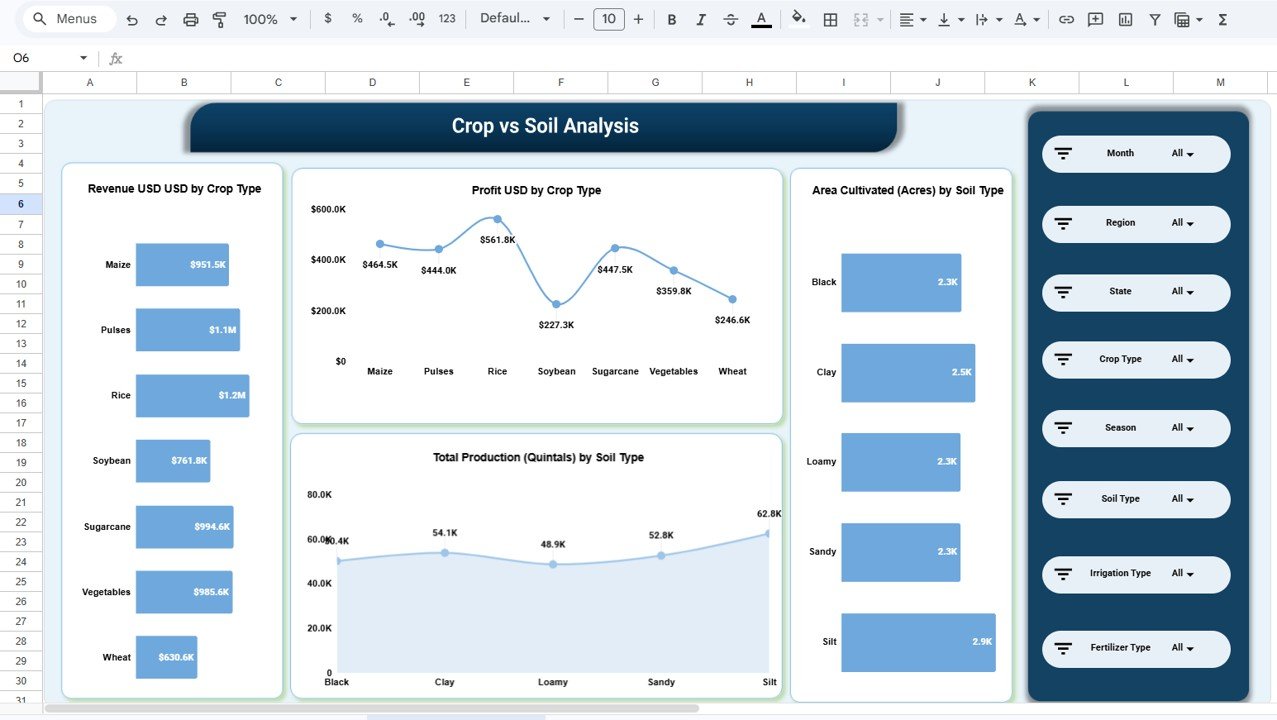
Crop vs Soil Analysis – Optimize Crop Selection
This page helps you understand crop performance across soil types.
📊 Key Metrics:
-
Revenue by Crop Type
-
Profit by Crop Type
-
Area by Soil Type
-
Production by Soil Type
🔍 Insights:
-
Best crops for each soil type
-
Most profitable crops
-
Soil productivity trends
🎯 Why It Matters:
Because crop selection impacts profit, this page improves decision-making.
Click to Buy Farm Production and Profitability Dashboard in Google Sheets
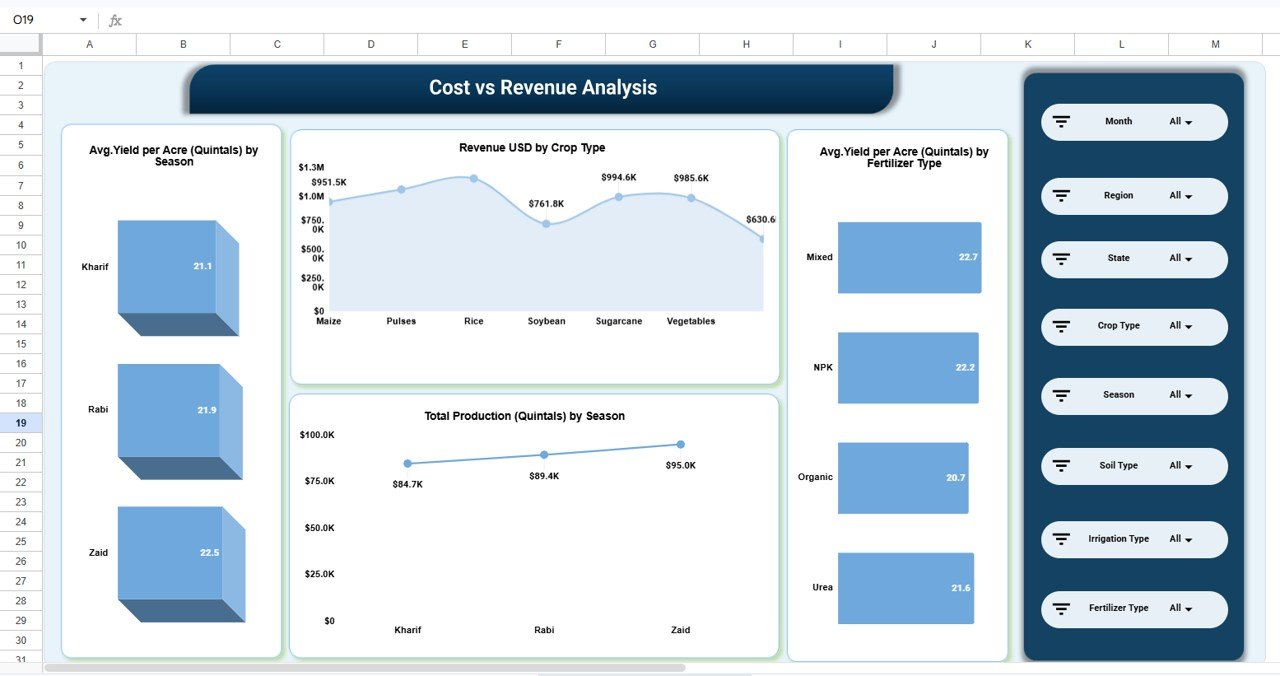
💰 Cost vs Revenue Analysis – Improve Profitability
This page focuses on financial performance.
📊 Key Metrics:
-
Yield by Season
-
Revenue by Crop Type
-
Production by Season
-
Yield by Fertilizer Type
🔍 Insights:
-
Which crops generate maximum revenue
-
Best fertilizer for higher yield
-
Seasonal performance trends
🎯 Why It Matters:
Because profitability is key, this page helps reduce costs and increase returns.
Click to Buy Farm Production and Profitability Dashboard in Google Sheets
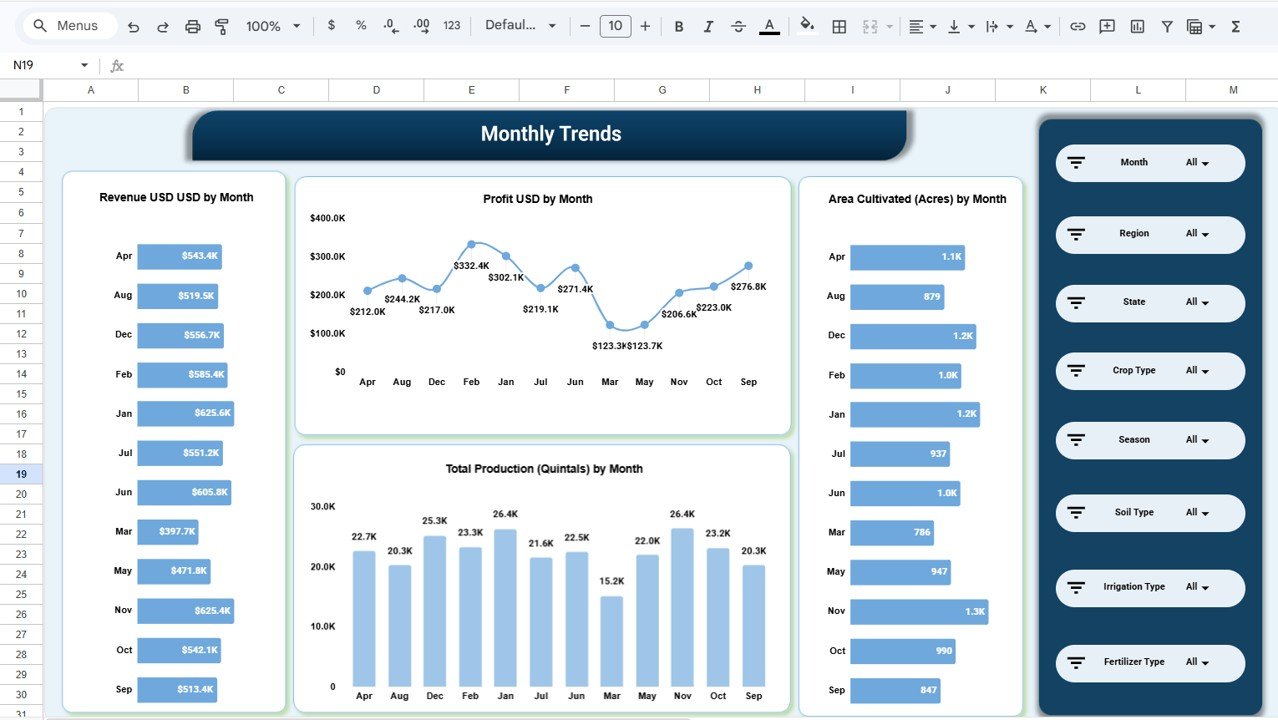
Monthly Trends – Track Seasonal Changes
This page shows time-based trends.
📊 Key Metrics:
-
Revenue by Month
-
Profit by Month
-
Area Cultivated
-
Production by Month
🔍 Insights:
-
Seasonal demand patterns
-
Monthly performance trends
-
Production fluctuations
📈 Why It Matters:
Because trends drive strategy, this page helps forecast future performance.
Click to Buy Farm Production and Profitability Dashboard in Google Sheets
How Does This Dashboard Work?
This dashboard uses Google Sheets features.
🔧 Core Components:
-
Data input sheets
-
Charts and visualizations
-
Slicers (filters)
-
Formulas and calculations
🔄 Workflow:
Enter farm data
Apply filters (Month, Region, Crop Type, etc.)
Analyze KPIs
Review trends
As a result, you can interact with data dynamically.
Advantages of Farm Production and Profitability Dashboard
Using this dashboard offers many benefits.
🚀 Key Advantages:
-
📊 Centralized Data Management
Track all farm data in one place. -
⚡ Real-Time Insights
Get instant updates. -
📈 Improved Productivity
Optimize crop and soil usage. -
💰 Better Profit Tracking
Monitor revenue and costs. -
🌍 Regional Analysis
Compare performance across locations. -
🧠 Data-Driven Decisions
Make smarter farming choices.
Opportunities for Improvement
Click to Buy Farm Production and Profitability Dashboard in Google Sheets
You can enhance this dashboard further.
💡 Suggested Improvements:
-
Add weather data integration
-
Include irrigation efficiency metrics
-
Add predictive analytics
-
Integrate IoT sensors
-
Automate data updates
Best Practices for the Farm Dashboard
Follow these best practices for better results.
✅ Best Practices:
-
📊 Keep data accurate and updated
-
🔄 Update data regularly
-
🎯 Focus on key KPIs
-
📌 Use simple and clear visuals
-
⚡ Optimize formulas
-
🎨 Maintain consistent design
Conclusion
Click to Buy Farm Production and Profitability Dashboard in Google Sheets
The Farm Production and Profitability Dashboard in Google Sheets is a powerful tool for modern farming. It simplifies complex data and provides actionable insights.
Moreover, it helps farmers track production, costs, and profits effectively. As a result, they can make smarter decisions and improve overall performance.
If you want to boost your farm productivity and profitability, this dashboard is a must-have solution.
Visit our YouTube channel to learn step-by-step video tutorials
Youtube.com/@NeotechNavigators
Watch the step-by-step video tutorial:
Click to Buy Farm Production and Profitability Dashboard in Google Sheets