In today’s fast-paced business environment, managing supply chain operations efficiently is more important than ever. Companies deal with multiple suppliers, warehouses, shipping methods, and product categories. However, when this data is scattered across spreadsheets, it becomes difficult to gain meaningful insights.
That’s exactly where the Supply Chain Analytics Dashboard in HTML comes in. This powerful, modern, and fully interactive dashboard helps you track, analyze, and optimize your supply chain operations—all in one place.
Built using advanced web technologies and interactive visualizations, this dashboard transforms complex data into clear insights, enabling faster and smarter decision-making.
What is a Supply Chain Analytics Dashboard?
A Supply Chain Analytics Dashboard is a centralized reporting tool designed to monitor key supply chain metrics such as:
- Total orders
- Delivery performance
- Order accuracy
- Return rates
- Fulfillment efficiency
Instead of relying on manual reports, this dashboard provides real-time insights through dynamic charts, filters, and KPI cards.
Why Do You Need This Dashboard?
Click to Buy Supply Chain Analytics Dashboard in HTML
Managing supply chain operations without proper analytics can lead to delays, inefficiencies, and increased costs.
With this dashboard, you can:
- Track supplier performance easily
- Monitor logistics efficiency
- Identify bottlenecks in delivery
- Improve customer satisfaction
- Make data-driven decisions
Key Features of the Dashboard
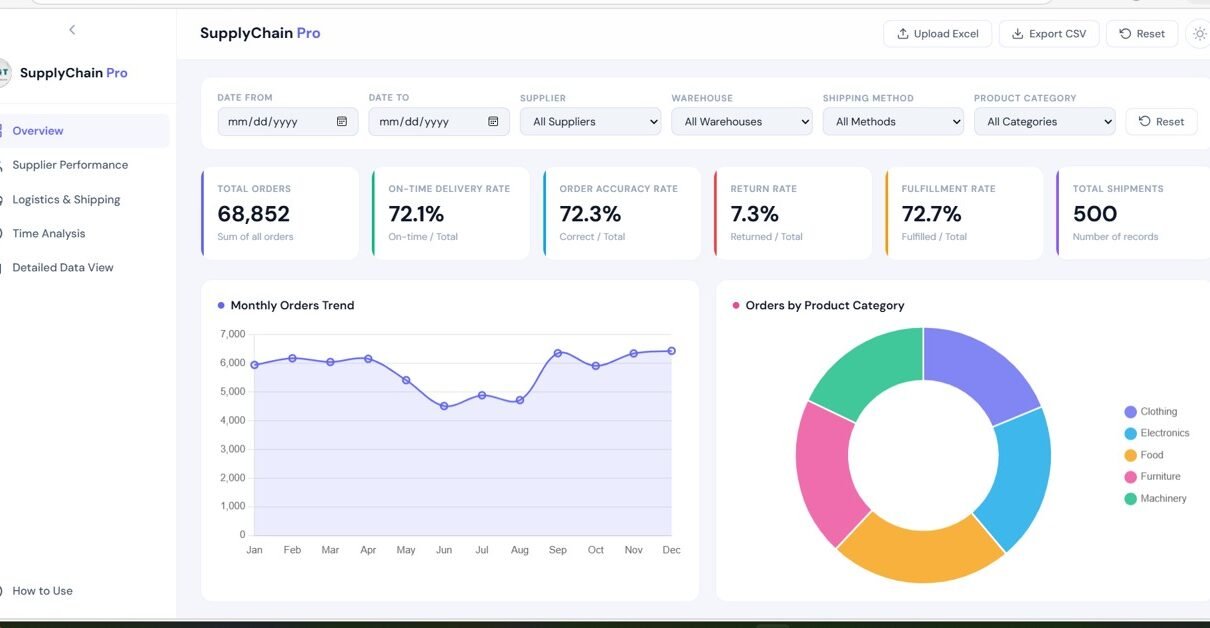
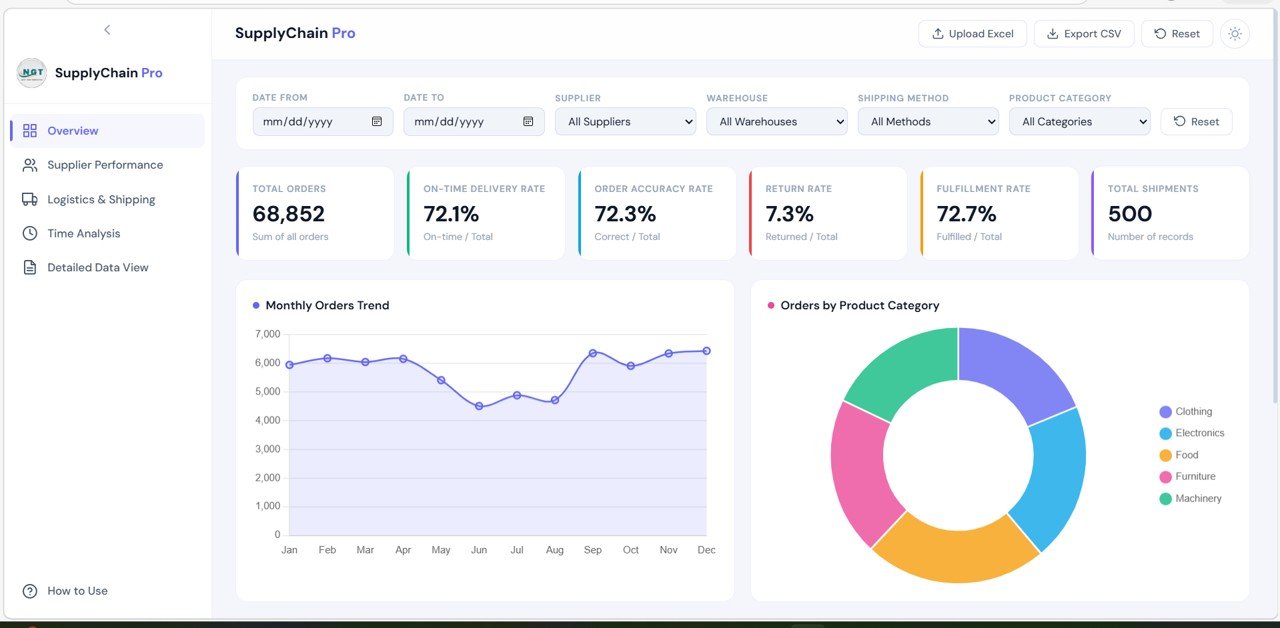
Overview Page
This is the main page that provides a high-level summary of your entire supply chain.
Key Highlights:
KPI Cards:
- Total Orders
- On-Time Delivery Rate
- Order Accuracy Rate
- Return Rate
- Fulfillment Rate
- Total Shipments
📈 Charts:
- Monthly Orders Trend
- Orders by Product Category (Donut Chart)
- Orders by Warehouse
- On-Time vs Returned by Category
- Fulfillment by Shipping Method
Click to Buy Supply Chain Analytics Dashboard in HTML
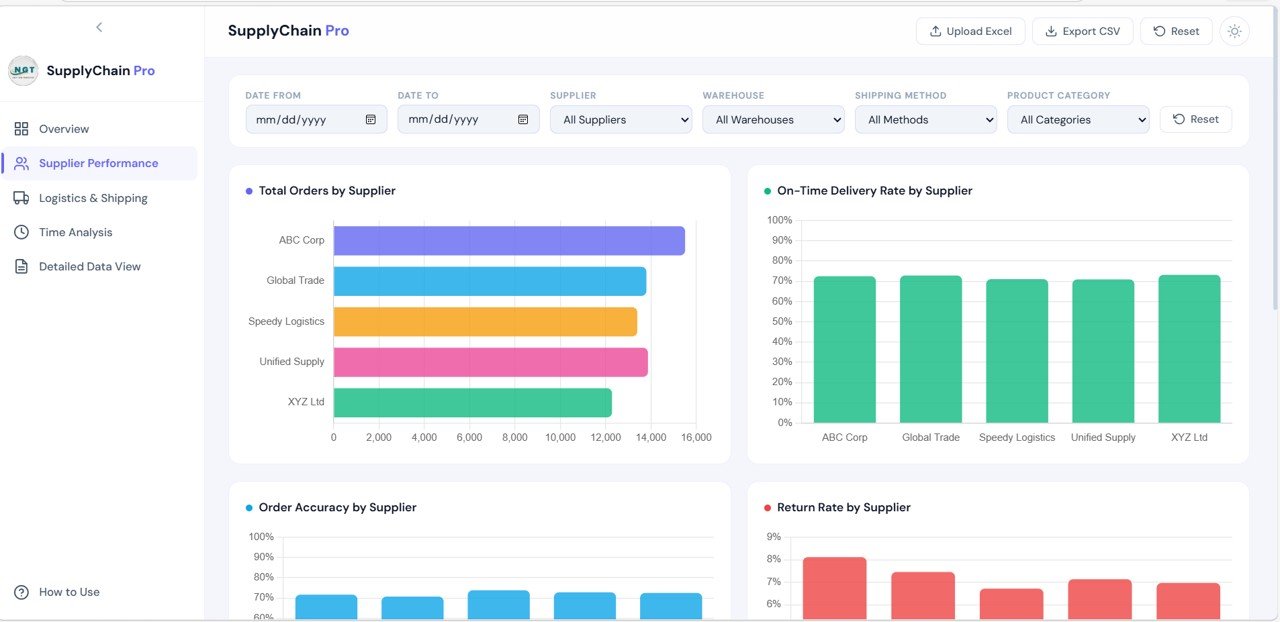
Supplier Performance
This page helps evaluate how well your suppliers are performing.
Key Highlights:
-
Total Orders by Supplier (Bar Chart)
-
On-Time Delivery Rate by Supplier
-
Order Accuracy by Supplier
-
Return Rate by Supplier
-
Supplier Performance Radar Chart
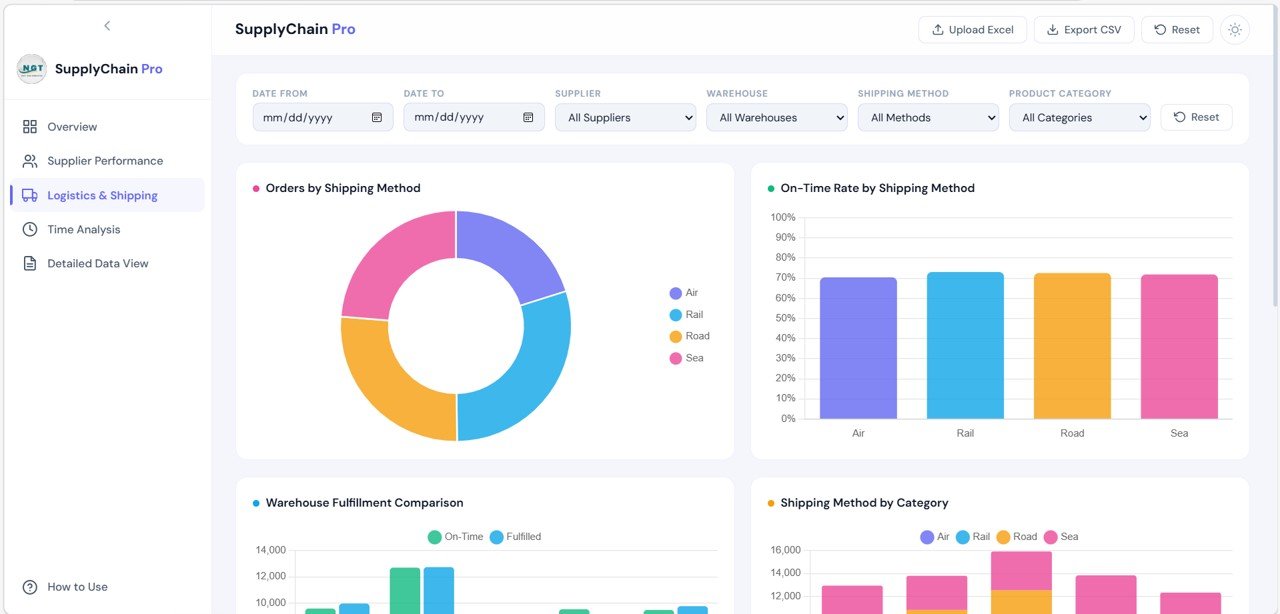
Logistics & Shipping
This section focuses on shipping efficiency and logistics performance.
Key Highlights:
-
Orders by Shipping Method (Air, Road, Rail, Sea)
-
On-Time Rate by Shipping Method
-
Warehouse Fulfillment Comparison
-
Shipping Method by Product Category
-
Total Orders by Warehouse
Click to Buy Supply Chain Analytics Dashboard in HTML
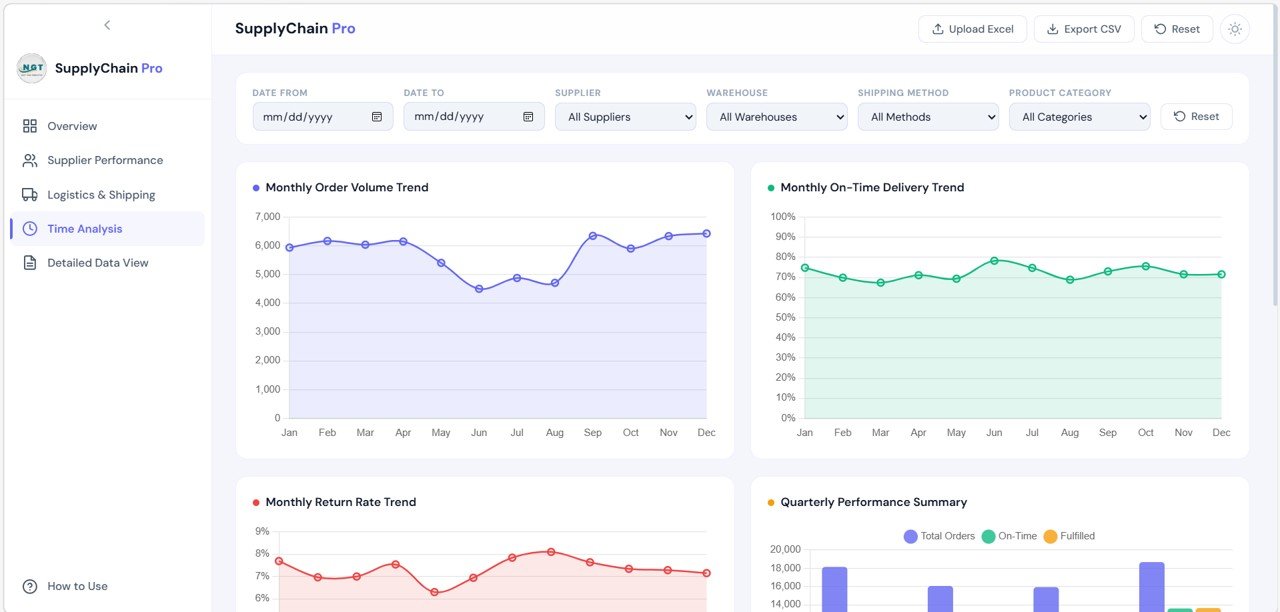
Time Analysis
This page provides insights into trends over time.
Key Highlights:
-
Monthly Order Volume Trend
-
Monthly On-Time Delivery Trend
-
Monthly Return Rate Trend
-
Quarterly Performance Summary
-
Monthly Orders by Category
Click to Buy Supply Chain Analytics Dashboard in HTML
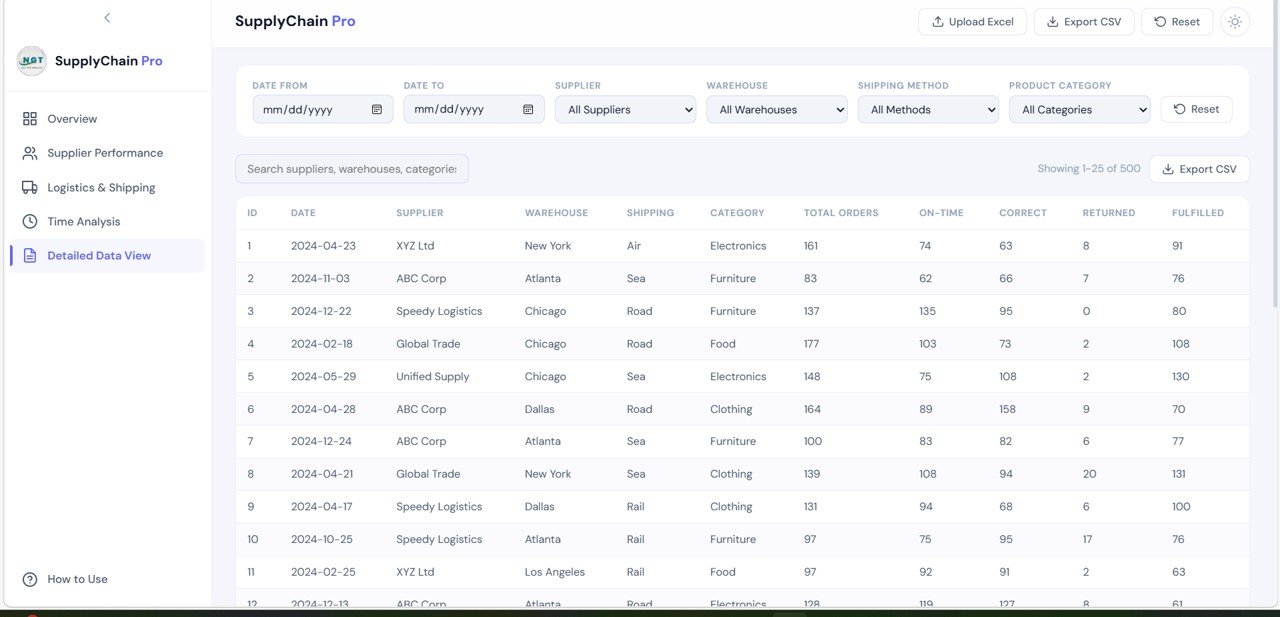
Detailed Data View
This section provides a complete tabular view of your data.
Key Highlights:
-
Search functionality for quick filtering
-
Sortable columns
-
Pagination for large datasets
-
Export filtered data to CSV
Click to Buy Supply Chain Analytics Dashboard in HTML
How to Use Section
The dashboard includes a built-in guide explaining:
- Required data format
- Column structure
- Upload process
- Dashboard navigation
Data Structure Required
To use this dashboard effectively, your dataset should include:
- Record ID
- Date
- Supplier Name
- Warehouse Location
- Shipping Method
- Product Category
- Total Orders
- On-Time Deliveries
- Correct Orders
- Returned Orders
- Fulfilled Orders
Benefits of This Dashboard
Click to Buy Supply Chain Analytics Dashboard in HTML
Better Decision-Making
Visual insights help managers take quick and informed decisions.
Improved Efficiency
Identify delays, errors, and inefficiencies instantly.
Supplier Optimization
Compare supplier performance and improve vendor selection.
Cost Reduction
Optimize logistics and reduce unnecessary expenses.
Real-Time Insights
Dynamic charts update instantly with filters.
Who Can Benefit?
Click to Buy Supply Chain Analytics Dashboard in HTML
This dashboard is ideal for:
- Supply Chain Managers
- Logistics Teams
- Operations Managers
- Warehouse Managers
- E-commerce Businesses
- Manufacturing Companies
Best Practices
To get the most out of this dashboard:
- Keep your data updated regularly
- Use filters for focused analysis
- Monitor KPIs weekly or monthly
- Identify trends and act quickly
- Compare supplier and shipping performance
Conclusion
Click to Buy Supply Chain Analytics Dashboard in HTML
The Supply Chain Analytics Dashboard in HTML is a powerful, modern solution designed to simplify complex supply chain data.
With interactive visuals, real-time filtering, and easy data integration, it helps businesses:
-
Improve performance
-
Reduce costs
-
Enhance decision-making
If you want to transform your supply chain operations into a data-driven system, this dashboard is the perfect tool.
Visit our YouTube channel to learn step-by-step video tutorials
Youtube.com/@NeotechNavigators
Click to Buy Supply Chain Analytics Dashboard in HTML