In today’s rapidly evolving Renewable Energy KPI Scorecard in Google Sheets landscape, renewable energy companies must continuously monitor performance to stay competitive. Whether you manage solar farms, wind projects, or hydroelectric plants, tracking key performance indicators (KPIs) plays a crucial role in ensuring efficiency and profitability. However, when organizations rely on scattered spreadsheets or manual reports, they often struggle to gain meaningful insights. As a result, performance gaps remain unnoticed, and decision-making becomes slow.Renewable Energy KPI Scorecard in Google Sheets
So, how can you effectively track renewable energy KPIs in a simple yet powerful way?
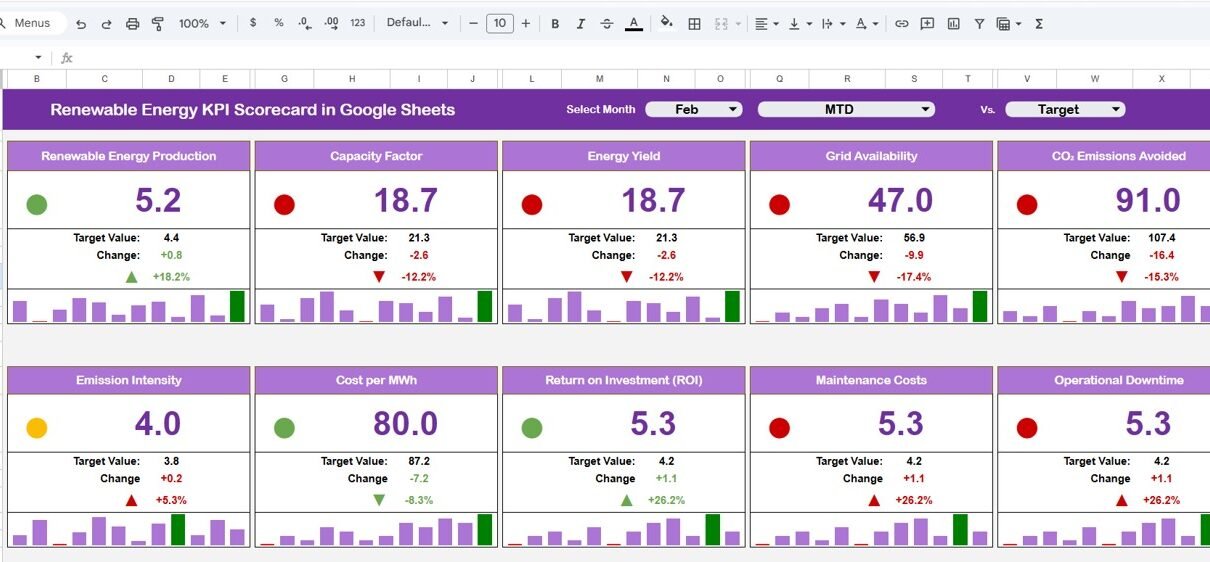
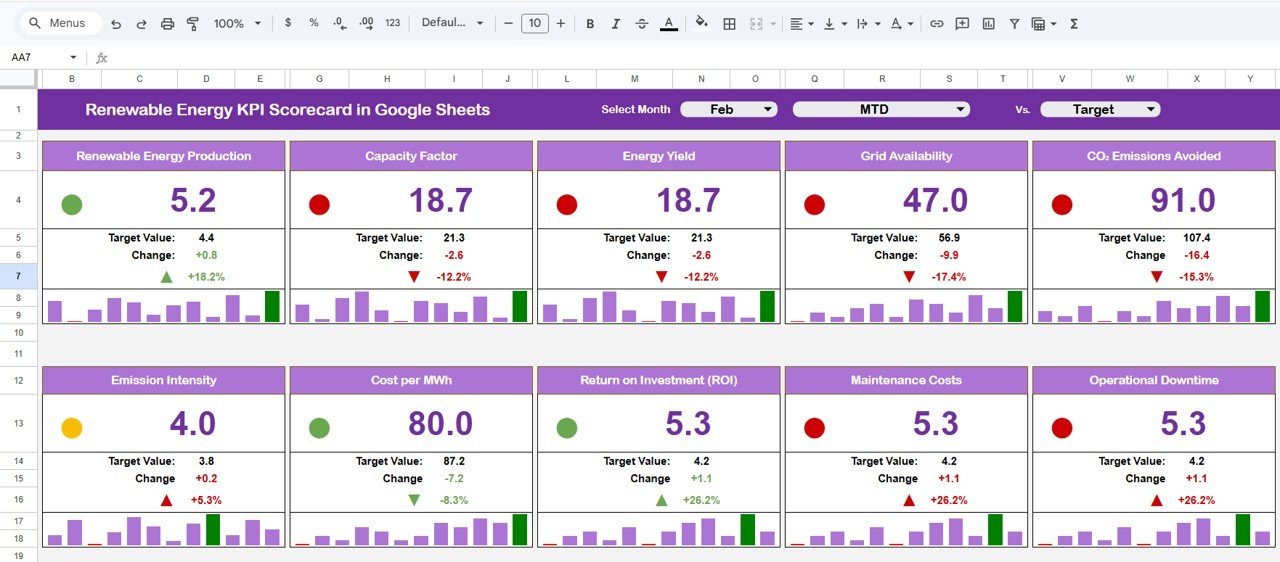
This ready-to-use and interactive scorecard helps organizations monitor, analyze, and improve energy performance in one centralized dashboard. Moreover, it transforms raw data into visual insights using traffic lights, trend indicators, and dynamic comparisons. Therefore, decision-makers can quickly identify areas of improvement and take action.
📊 What is a Renewable Energy KPI Scorecard in Google Sheets?
Click to Buy Renewable Energy KPI Scorecard in Google Sheets
A Renewable Energy KPI Scorecard in Google Sheets is a structured performance tracking tool designed to monitor key metrics related to energy production, efficiency, and sustainability.
Instead of using multiple tools, this scorecard centralizes all KPI data in one place. Therefore, users can:
-
Track monthly and yearly performance
-
Compare actual vs target values
-
Monitor trends over time
-
Identify operational inefficiencies
-
Improve energy output
Moreover, since Google Sheets supports real-time collaboration, teams can easily update and share data across departments.
Why Do You Need a Renewable Energy KPI Scorecard?
Renewable energy projects generate large amounts of operational data every day. However, without proper tracking, organizations cannot utilize this data effectively.
With this scorecard, you can:
-
Improve energy efficiency
-
Reduce operational losses
-
Monitor project performance
-
Ensure sustainability goals
-
Enhance decision-making
Therefore, it becomes an essential tool for renewable energy companies.
Key Features of Renewable Energy KPI Scorecard in Google Sheets
Click to Buy Renewable Energy KPI Scorecard in Google Sheets
This scorecard includes multiple powerful features that simplify performance tracking.
Dynamic Monthly Selection 📅
At the top of the scorecard, you can select any month using a dropdown.
As a result:
-
The entire dashboard updates automatically
-
All KPI values refresh instantly
-
Trend indicators adjust dynamically
MTD and YTD Performance Analysis 📊
You can analyze performance using:
-
MTD (Month-to-Date) – Monthly performance
-
YTD (Year-to-Date) – Annual performance
Traffic Light Indicators 🚦
The dashboard uses color-coded indicators:
-
🟢 Green – Target achieved
-
🔴 Red – Target missed
-
🟡 Yellow – Near target
Up/Down Arrows for Trend Analysis 📈
The scorecard includes:
-
▲ Up Arrow – Improvement
-
▼ Down Arrow – Decline
Click to Buy Renewable Energy KPI Scorecard in Google Sheets
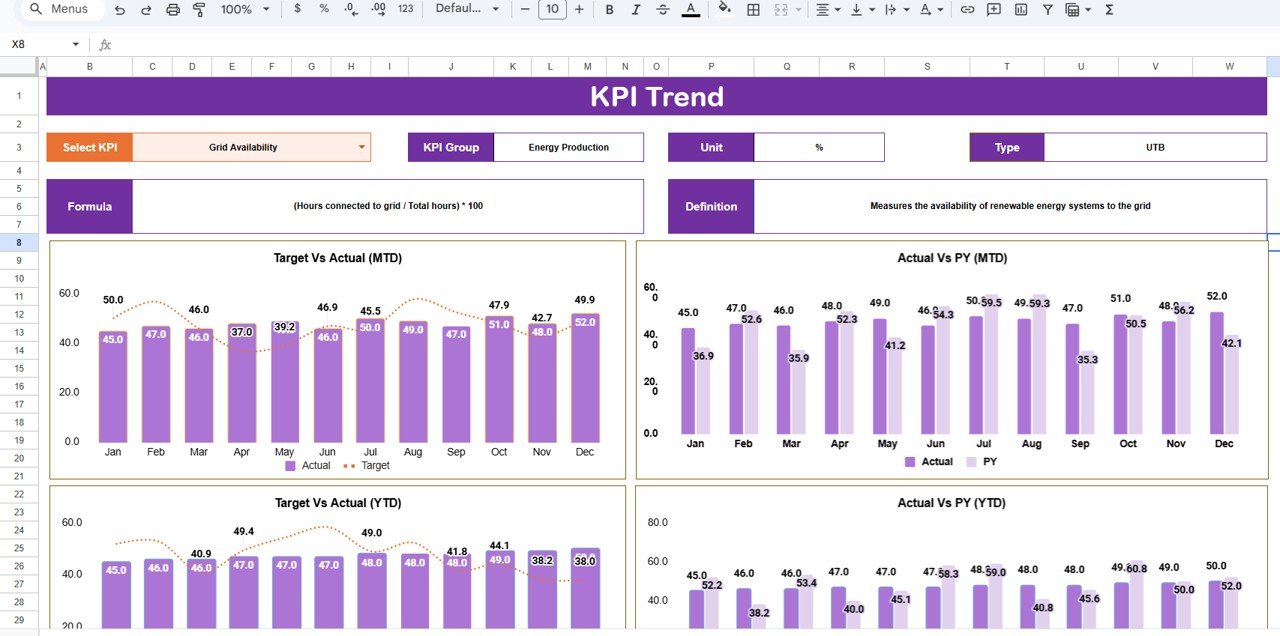
KPI Trend Sheet 📉
The Trend Sheet provides detailed KPI analysis.
🔹 Features:
-
KPI selection dropdown (Cell C3)
-
KPI Group and Category
-
KPI Unit
-
KPI Type (Lower the Better / Higher the Better)
Click to Buy Renewable Energy KPI Scorecard in Google Sheets
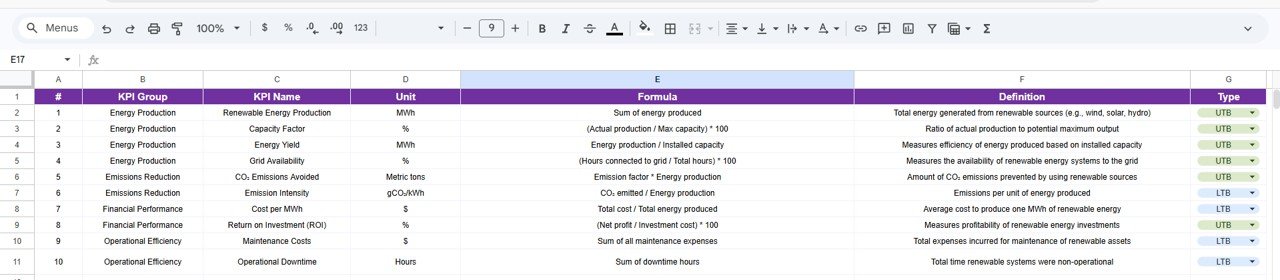
KPI Definition Sheet 📘
This sheet contains detailed KPI information.
🔹 Includes:
-
KPI Name
-
KPI Group
-
Unit
-
Formula
-
KPI Definition
Click to Buy Renewable Energy KPI Scorecard in Google Sheets
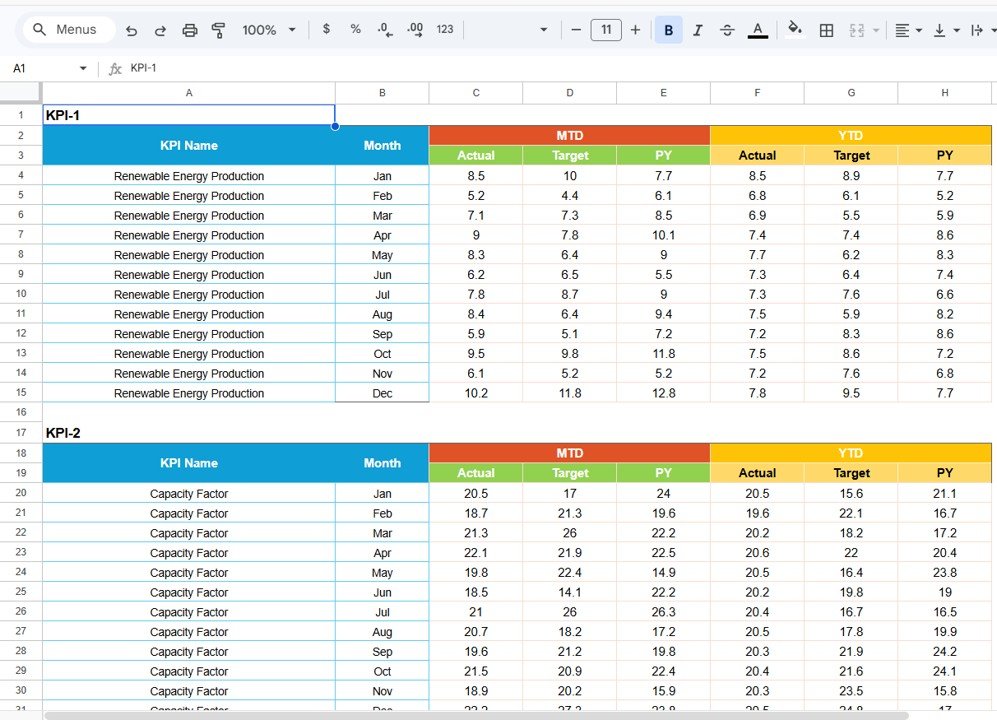
Data Input Sheet 📊
This sheet allows users to input raw data.
-
Data entry becomes simple
-
Dashboard updates automatically
-
Errors reduce significantly
Color Settings 🎨
You can customize color indicators based on performance thresholds.
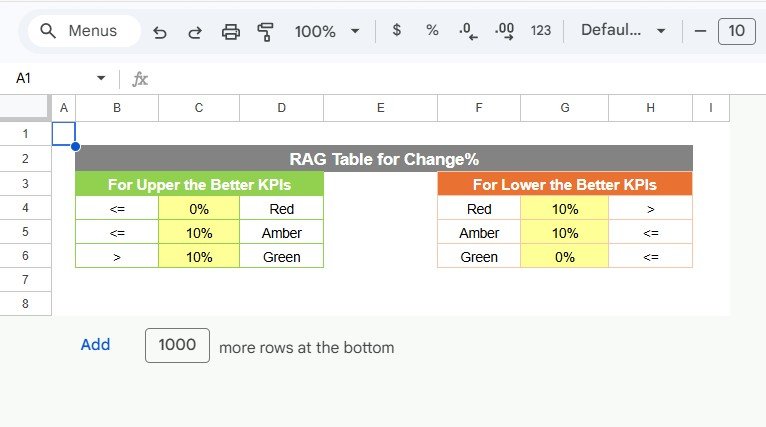
Click to Buy Renewable Energy KPI Scorecard in Google Sheets
Advantages of Renewable Energy KPI Scorecard in Google Sheets
✅ Better Performance Tracking
-
Monitor KPIs in real time
-
Identify issues quickly
✅ Improved Decision-Making
-
Data-driven insights
-
Faster actions
✅ Increased Efficiency
-
Reduce manual work
-
Streamline reporting
✅ Enhanced Sustainability
-
Track environmental impact
-
Improve energy efficiency
✅ Easy Collaboration
-
Share data across teams
-
Update in real time
How Does This Scorecard Improve Energy Operations?
Click to Buy Renewable Energy KPI Scorecard in Google Sheets
When organizations use this scorecard:
-
They detect inefficiencies early
-
They reduce downtime
-
They optimize energy production
-
They improve profitability
Therefore, overall performance improves significantly.
Best Practices for Renewable Energy KPI Scorecard
🔹 Use Accurate Data
-
Avoid errors
-
Maintain consistency
🔹 Focus on Key KPIs
-
Avoid unnecessary metrics
-
Prioritize critical indicators
🔹 Update Data Regularly
-
Ensure real-time insights
-
Maintain dashboard accuracy
🔹 Set Realistic Targets
-
Align with business goals
-
Avoid unrealistic expectations
🔹 Review Trends Frequently
-
Monitor monthly and yearly trends
-
Identify patterns
Conclusion
Click to Buy Renewable Energy KPI Scorecard in Google Sheets
The Renewable Energy KPI Scorecard in Google Sheets is a powerful tool that helps organizations track performance, improve efficiency, and achieve sustainability goals.
By using this scorecard, you can:
-
Monitor KPIs effectively
-
Optimize energy production
-
Improve decision-making
Therefore, it is a must-have solution for renewable energy management.
Visit our YouTube channel to learn step-by-step video tutorials
Youtube.com/@NeotechNavigators
Click to Buy Renewable Energy KPI Scorecard in Google Sheets