In today’s digital world, network performance plays a critical role in business success. Whether you manage IT infrastructure, telecom systems, or cloud networks, you must track performance continuously. However, when network data spreads across multiple files and tools, it becomes difficult to monitor KPIs effectively.Network Performance KPI Dashboard in Google Sheets
So, how can IT teams track network performance, identify issues, and improve efficiency—all in one place?
Network Performance KPI Dashboard in Google Sheets.
This powerful and ready-to-use dashboard helps IT managers, network engineers, and analysts monitor key performance indicators (KPIs) in real time. Moreover, it transforms complex network data into simple, interactive visuals for better decision-making.
In this detailed guide, you will learn everything about this dashboard, including its features, structure, advantages, best practices, and frequently asked questions.
What is a Network Performance KPI Dashboard in Google Sheets?
Click to Buy Network Performance KPI Dashboard in Google Sheets
A Network Performance KPI Dashboard in Google Sheets is an advanced reporting tool designed to track, analyze, and visualize network-related KPIs using a cloud-based platform.
Instead of managing multiple reports, this dashboard allows you to:
- 📈 Monitor network KPIs in real time
- ⚡ Track uptime, latency, and bandwidth usage
- 🎯 Compare actual vs target performance
- 📊 Analyze monthly and yearly trends
- 🔍 Identify performance issues quickly
Therefore, organizations can improve network reliability and operational efficiency.
Why Do You Need a Network Performance KPI Dashboard?
Network environments generate large volumes of data every second. Therefore, manual tracking becomes inefficient.
Here’s why this dashboard is essential:
- It centralizes all network KPIs in one place
- It improves decision-making speed
- It reduces downtime and performance issues
- It enhances visibility across systems
- It supports proactive network management
In short, this dashboard simplifies network monitoring and boosts performance.
Key Features of Network Performance KPI Dashboard in Google Sheets
Click to Buy Network Performance KPI Dashboard in Google Sheets
This dashboard includes 6 well-structured worksheets, each designed for specific analysis and data management.
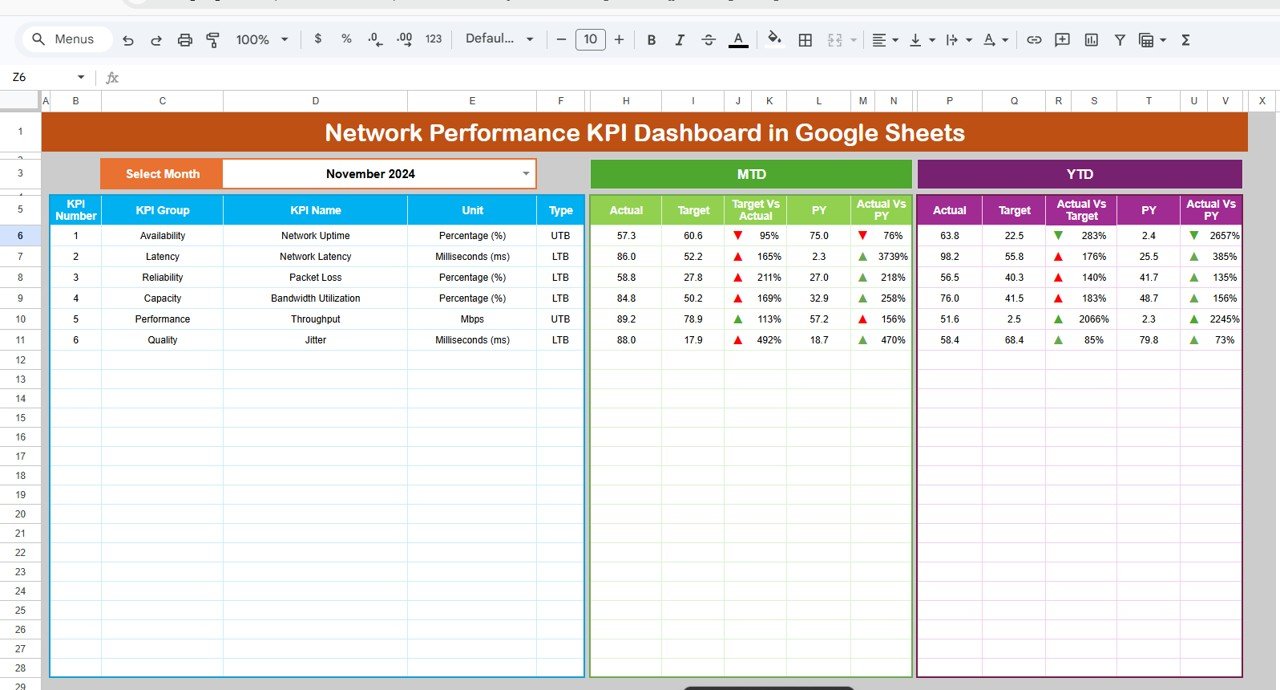
1. Dashboard Sheet Tab – Complete KPI Overview
The Dashboard Sheet is the main page where you can view all KPI data in one place.
Key Highlights:
- Month Selection (Cell D3):
- Select any month from the dropdown
- All dashboard values update automatically
- MTD Metrics:
- Actual
- Target
- Previous Year
- Target vs Actual (%)
- PY vs Actual (%)
- 🔺🔻 Conditional Formatting (Up/Down Arrows)
- YTD Metrics:
- Actual
- Target
- Previous Year
- Target vs Actual (%)
- PY vs Actual (%)
- 🔺🔻 Conditional Formatting
Click to Buy Network Performance KPI Dashboard in Google Sheets
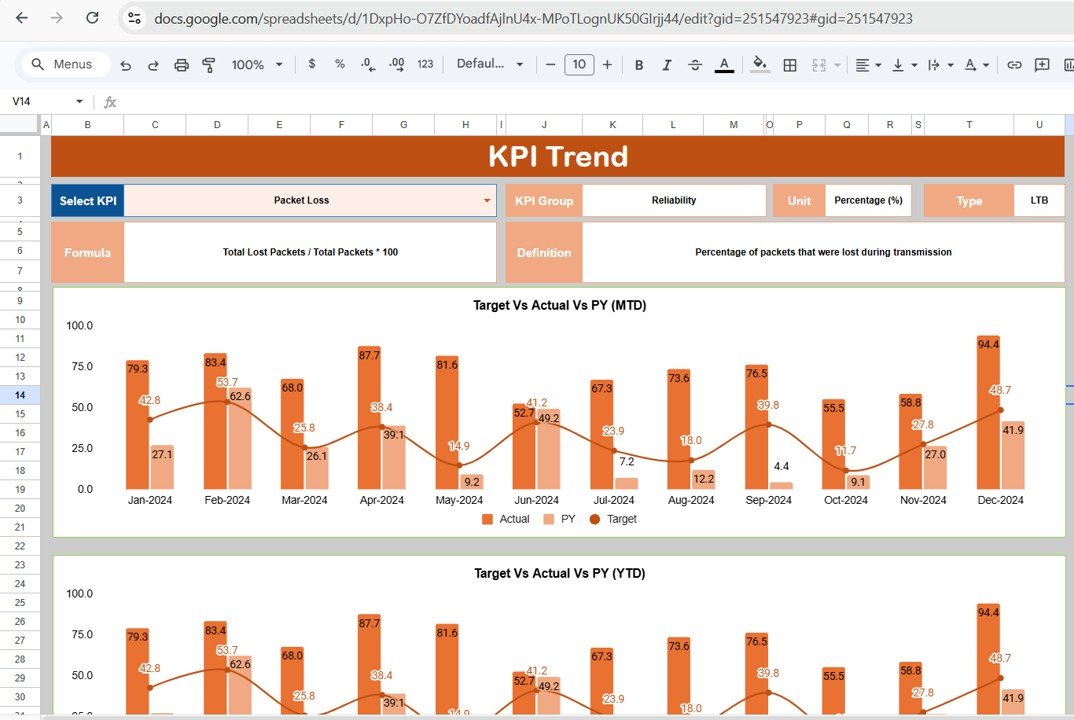
2. KPI Trend Sheet Tab – Analyze KPI Trends
The KPI Trend Sheet helps you analyze the performance of individual KPIs over time.
Key Features:
- KPI Selection Dropdown (Cell C3)
- Displays:
- KPI Group
- Unit
- KPI Type (Lower the Better / Upper the Better)
- KPI Formula
- KPI Definition
Insights You Can Gain:
- Track performance trends
- Understand KPI behavior
- Evaluate improvements or declines
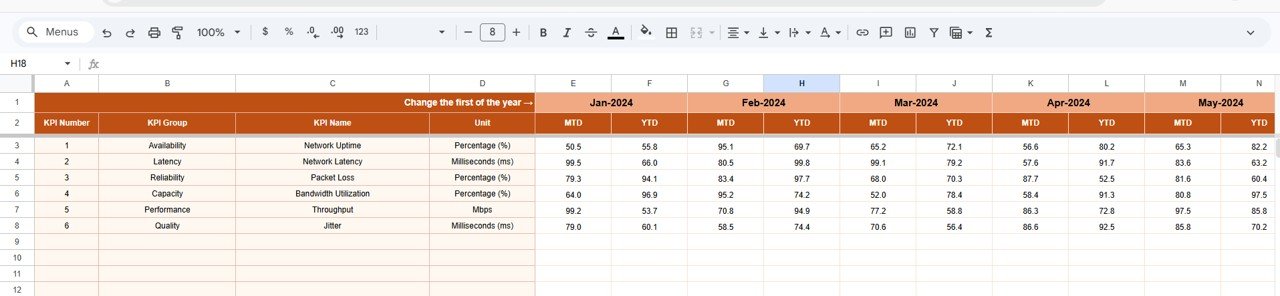
3. Actual Number Sheet Tab – Input Current Data
In this sheet, you enter actual KPI values.
Includes:
- Month Selection (Cell E1 – First month of the year)
- MTD Values
- YTD Values
Click to Buy Network Performance KPI Dashboard in Google Sheets
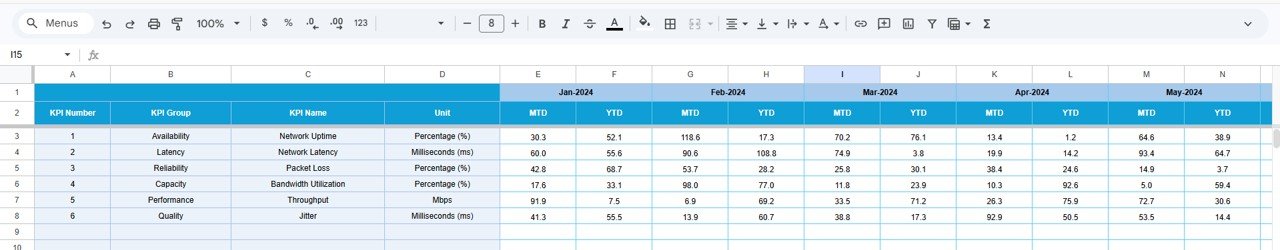
4. Target Sheet Tab – Define KPI Targets
The Target Sheet allows you to set performance goals.
Includes:
- Monthly Target Values
- MTD Targets
- YTD Targets
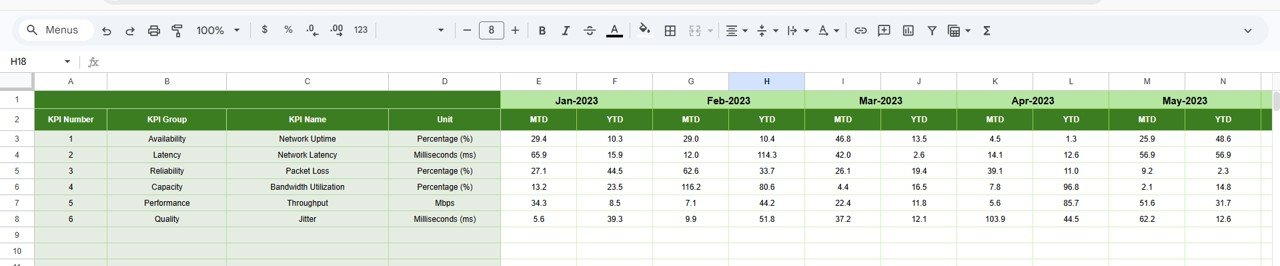
5. Previous Year Number Sheet Tab – Historical Comparison
This sheet stores previous year data.
Includes:
- Previous Year MTD
- Previous Year YTD
Click to Buy Network Performance KPI Dashboard in Google Sheets
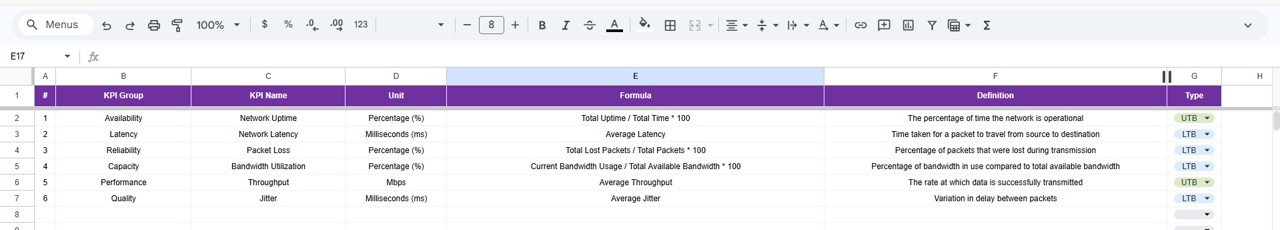
6. KPI Definition Sheet Tab – KPI Details
This sheet contains detailed KPI information.
Includes:
- KPI Name
- KPI Group
- Unit
- Formula
- KPI Definition
Click to Buy Network Performance KPI Dashboard in Google Sheets
Advantages of Network Performance KPI Dashboard in Google Sheets
Using this dashboard provides multiple benefits:
1. Real-Time Monitoring
You can track network performance instantly. Therefore, you stay updated.
2. Cloud-Based Accessibility
Since it is built in Google Sheets, you can access it from anywhere.
3. Improved Decision-Making
Clear visuals help you make faster decisions.
4. Reduced Downtime
You can identify issues early and fix them quickly.
5. Better Data Accuracy
Automation reduces manual errors.
6. Easy Collaboration
Teams can work together in real time.
Opportunities for Improvement
Click to Buy Network Performance KPI Dashboard in Google Sheets
You can enhance this dashboard further:
- Integrate with real-time network monitoring tools
- Add automated alerts for downtime
- Optimize for mobile dashboards
- Include geo-based network analysis
- Strengthen data security measures
Best Practices for the Network Performance KPI Dashboard in Google Sheets
To maximize performance, follow these best practices:
1. Keep Data Updated
Always enter data regularly for accurate insights.
2. Define KPIs Clearly
Ensure each KPI has a proper formula and definition.
3. Focus on Critical Metrics
Track only the most important KPIs.
4. Use Conditional Formatting
Highlight performance changes clearly.
5. Monitor Trends Regularly
Analyze trends to improve performance.
6. Ensure Data Security
Protect sensitive network data.
Who Can Benefit from This Dashboard?
Click to Buy Network Performance KPI Dashboard in Google Sheets
This dashboard is useful for:
- Network Engineers
- IT Managers
- Data Analysts
- Telecom Companies
- IT Service Providers
How Does This Dashboard Improve Network Performance?
This dashboard improves performance in several ways:
- Enhances network reliability
- Reduces downtime
- Improves monitoring efficiency
- Supports proactive decision-making
- Optimizes resource utilization
Conclusion
Click to Buy Network Performance KPI Dashboard in Google Sheets
The Network Performance KPI Dashboard in Google Sheets is a powerful tool for monitoring and improving network performance. It simplifies complex data, enhances visibility, and supports better decision-making.
Moreover, with its interactive design, real-time insights, and cloud accessibility, it helps organizations maintain high-performance networks.
If you want to optimize your network operations, this dashboard is the perfect solution.
Visit our YouTube channel to learn step-by-step video tutorials
Youtube.com/@NeotechNavigators
Click to Buy Network Performance KPI Dashboard in Google Sheets